. 2015 Apr 23:6:6894.
doi: 10.1038/ncomms7894.

C-Nap1 mutation affects centriole cohesion and is associated with a Seckel-like syndrome in cattle

Affiliations

C-Nap1 mutation affects centriole cohesion and is associated with a Seckel-like syndrome in cattle

Sandrine Floriot et al. Nat Commun. .

Abstract

Caprine-like Generalized Hypoplasia Syndrome (SHGC) is an autosomal-recessive disorder in Montbéliarde cattle. Affected animals present a wide range of clinical features that include the following: delayed development with low birth weight, hind limb muscular hypoplasia, caprine-like thin head and partial coat depigmentation. Here we show that SHGC is caused by a truncating mutation in the CEP250 gene that encodes the centrosomal protein C-Nap1. This mutation results in centrosome splitting, which neither affects centriole ultrastructure and duplication in dividing cells nor centriole function in cilium assembly and mitotic spindle organization. Loss of C-Nap1-mediated centriole cohesion leads to an altered cell migration phenotype. This discovery extends the range of loci that constitute the spectrum of autosomal primary recessive microcephaly (MCPH) and Seckel-like syndromes.


Figures

Figure 1
Figure 1. Identification of the SHGC-causing mutation in CEP250.
(a) General feature of mutant cows. Left picture: backs of mutant (left) and wild-type cows (right). Right pictures: top, mutant cow with typical elongated caprine-like long and thin head with ears' depigmentation; bottom: wild-type cow. (b) Evidence for linkage (y axis) is measured as log(1/P), with P being determined by the 50,000 locus (ASSHOM) permutations (see Methods), leading to the identification of a 2.5-Mb shared region between markers BTA13 rs109267613 and rs109957099. Below, list of the analysed markers present in this region, including the microsatellites (in green) used in the initial mapping study. (c) The CEP250 gene comprises 32 coding exons. The comprised 5′ and 3′ untranslated regions are depicted in white. Location of the observed mutation is indicated. (d) Chromatograms of the obtained sequences covering the mutation.
Figure 2
Figure 2. Characterization of truncated CEP250 transcripts and C-Nap1 mislocalization in SHGC primary fibroblasts.
(a) Structure of the 5′ region of the bovine CEP250 gene. The 5′ untranslated region is depicted in white. Exons are numbered from the first coding exon. Two transcripts (a and a′) are detected in wild-type cells including one lacking exon 3 and retaining the last five nucleotides of intron 3 (a′). Mutation in exon 4 generates two shorter transcripts: transcript (b) starts at an AG dinucleotide likely located at the end of intron 4 and includes exon 5 (depicted as *); transcript (c) starts in exon 6 at nucleotide 656 of the open reading frame. (b) Agarose gel showing the 5′ RACE products amplified using RT primer GSP1 and GSP2 located in exon 9 and PCR primers GSP3 or GSP4 located in exon 8 (black and white triangles, respectively), with or without formamide. The longest products were purified and sequenced (boxes). Original gel is presented in Supplementary Fig. 6. (c) Relative CEP250 mRNA levels estimated by RT–qPCR targeting the indicated exons. Values are provided relative to wild type. Mutant, n=3 and wild-type, n=2. (d) C-Nap1 subcellular localization in wild-type and SHGC mutant fibroblasts using C-Nap1 C-terminus labelling (R63 serum). In 92% of wild-type cells (n=113), centrosomes (white arrows) are labelled with an antibody against γ-tubulin (red) and with R63 (green). In 91% of mutant cells (n=97), only γ-tubulin labelling is detected on split centrosomes (double arrows). The anti-C-Nap1 antibody only produced a heterogeneous labelling (green colour on the merge) but no labelling of split centrosomes. Scale bar, 10 μm.
Figure 3
Figure 3. Centrosome splitting and rootletin loss in SHGC mutant cells.
(a) Centrosomes were visualized (arrows) with gamma-tubulin immunolabelling (green) on individual fibroblasts from wild-type and SHGC mutant animals. Centrosome splitting in mutant cells was rescued by transient expression of myc-tagged human C-Nap1. Myc labelling (red) revealed unsplit centrosomes (white arrows) in 88% of the cells (n=42) as opposed to 21% in nontransfected cells (**, n=230). DNA was stained with 4,6-diamidino-2-phenylindole (DAPI). Scale bar, 10 μm. (b) Box and whiskers diagram: distance between two centrosomes measured on Z projections from different fields (SP5 Leica), for 344 wild-type and 686 SHGC mutant cells during exponential growth. The mean distance equals 0 for wild-type cells and 7.48 μm for SHGC mutant cells. The mean, upper and lower decile, upper and lower quartile and interquartile range of data (individual dots: outliers). Student's t-test following two-tailed analysis of variance (****P<0.0001). Histogram: percentage of cells with split centrosomes in 344 wild-type and 686 SHGC mutant cells, and following rescue with human C-Nap1. (c) Centrosome splitting and reduction in rootletin levels in the SHGC mutant kidney. Centrosomes (arrows) were visualized by immunolabelling with gamma-tubulin (red) and the intercentriolar protein linker rootletin (green). DNA was stained with DAPI. Scale bar, 10 μm. (d) Severe reduction of Rootletin on the centrosome of SHGC mutant fibroblasts. Wild-type cells (left panel) present a strong rootletin staining (green) in between both centrioles (gamma-tubulin in red) and extending outside the intercentriolar region. Mutant fibroblasts show either severely reduced (mid panel) or undetectable (right panel) levels of rootletin (arrows). The two latter images are from the same cell. DNA was stained with DAPI. Scale bar, 2 μm. (e) Quantification of rootletin staining in wild-type and mutant fibroblasts. Centrosome splitting was scored together with the presence of rootletin near the unsplit centrosome (white bar) or in any or none of the two split centrioles (grey and dark bars). Rootletin was tightly associated with the unsplit centrosome (95% of the cases) in wild-type fibroblasts as opposed to less than 10% in mutant cells. More than 50% mutant cells exhibited a split centrosome with no detectable rootletin.
Figure 4
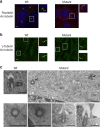
Figure 4. Ciliogenesis and ultrastructure of mutant centrioles observed using transmission electron microscopy.
(a) Ciliogenesis in vivo in adult kidney cells. Cilia were observed on kidney sections from wild-type and mutant cattle using acetylated tubulin to label the axoneme (in red) and rootletin (in green, arrow) to stain the cilium base. Enlargements show a cilium with strongly reduced rootletin staining in the mutant context. Distribution of cilia in SHGC mutant tissue was similar to the wild type, despite the very severe reduction of rootletin labelling (white arrow). Scale bar, 10 μm. (b) Ciliogenesis in fibroblast cells with split centrosomes. Cilia presence and length were analysed after labelling the axoneme with acetylated tubulin (in red) and the basal body with gamma-tubulin antibodies (in green, arrow). Enlargements of cells are shown to highlight the cilia. Mutant cells have the ability to grow and maintain cilia as efficiently as wild-type cells (see Supplementary Fig. 3 for statistics). Scale bar, 10 μm. (c) Normal centriole ultrastructure and cilium assembly in SHGC mutant fibroblasts. Wild-type centrioles were found as pairs in 50% of the sections analysed (n=20/42), while mutant centrioles were found isolated in 93% of the sections examined (n=91/98) or distantly located (black arrows). Transverse sections through the basal body shows the normal 9 microtubule triplets arrangement in the mutant centrioles and longitudinal sections allows the detection of subdistal appendages (*) and distal appendages that allow ciliary vesicle docking (cv), and subsequent fusion with the plasma membrane (pm). n, nucleus. Scale bar, 500 nm.
Figure 5
Figure 5. Bipolar mitotic spindle formation with paired centrioles in SHGC mutant cells.
Images show examples of microtubule, centrosome and centriole staining in wild-type and SHGC mutant primary fibroblasts at different stages of the cell cycle. (a) Newly formed centrioles remain associated with parental centrioles through the cell cycle in C-Nap1-deficient cells. Fibroblasts were synchronized in G1/S with thymidine and released for 8 h to observe cells in G2 or in various mitotic phases such as prophase and prometaphase. Centrioles and cilia are labelled with antiglutamylated tubulin monoclonal antibody GT335 (green), the centrosome with anti-gamma-tubulin serum (red), nuclei are stained with DAPI (blue). Insets are enlargements of GT335 labelling to highlight the number of centrioles (two centrioles in G1/S and four centrioles in G2 and mitosis). Note the presence of cilia in some G1/S and G2 cells. White arrows point each centriole. Merged images are stacks of four sections of 0.2 μm. Scale bar, 10 μm. (b) C-Nap1-deficient cells do not exhibit major defects in microtubule organization in interphase or mitosis. Asynchronously growing fibroblasts were immunolabelled for alpha-tubulin in green and DNA was stained with DAPI (blue). N=50 mitotic mutant cells were examined to assess spindle bipolarity.
Figure 6
Figure 6. Altered migration behaviour in SHGC mutant fibroblasts.
(a) Phase contrast images from time-lapse video-microscopy showing the migration capacity of cells in a wound-healing assay. Wild-type and SHGC mutant confluent quiescent cells migrated into the cell free gap of 500 μm during 20 h. Scale bar, 100 μm. (b) The cell-free area was measured at 20 h. Data show the mean and standard deviation from four independent experiments with one animal of each genotype. A Student's t-test following two-tailed analysis of variance using the Prism software was run to calculate P values (**P=0.008). (c) The migration tracks of wild-type and SHGC mutant cells were plotted in ImageJ (manual tracking plugin) and data analysed after normalizing each starting point to x=0 and y=0 (Ibidi software). The accumulated and Euclidean distance covered by individual cells, as well as the mean, upper and lower decile of the directionality distribution from four individual experiments of two wild-type and two mutant SHGC cell cultures are shown. Wild-type cells, n=73. SHGC mutant cells, n=52. A Student's t-test following two-tailed analysis of variance using the Prism software was run to calculate P values (****P<0.0001). The greater the directionality, the more linear the motion in a given direction is.

Similar articles

Cited by

References

    1. Nigg E. A. & Raff J. W. Centrioles, centrosomes, and cilia in health and disease. Cell 139, 663–678 (2009). - PubMed
    1. Bornens M. The centrosome in cells and organisms. Science 335, 422–426 (2012). - PubMed
    1. Mardin B. R. & Schiebel E. Breaking the ties that bind: new advances in centrosome biology. J. Cell Biol. 197, 11–18 (2012). - PMC - PubMed
    1. Nigg E. A. & Stearns T. The centrosome cycle: centriole biogenesis, duplication and inherent asymmetries. Nat. Cell Biol. 13, 1154–1160 (2011). - PMC - PubMed
    1. Fry A. M. et al.. C-Nap1, a novel centrosomal coiled-coil protein and candidate substrate of the cell cycle-regulated protein kinase Nek2. J. Cell Biol. 141, 1563–1574 (1998). - PMC - PubMed

Publication types

Substances