. 2015 Apr 22:4:e07736.
doi: 10.7554/eLife.07736.

The coordinated action of the MVB pathway and autophagy ensures cell survival during starvation

Affiliations

The coordinated action of the MVB pathway and autophagy ensures cell survival during starvation

Martin Müller et al. Elife. .

Abstract

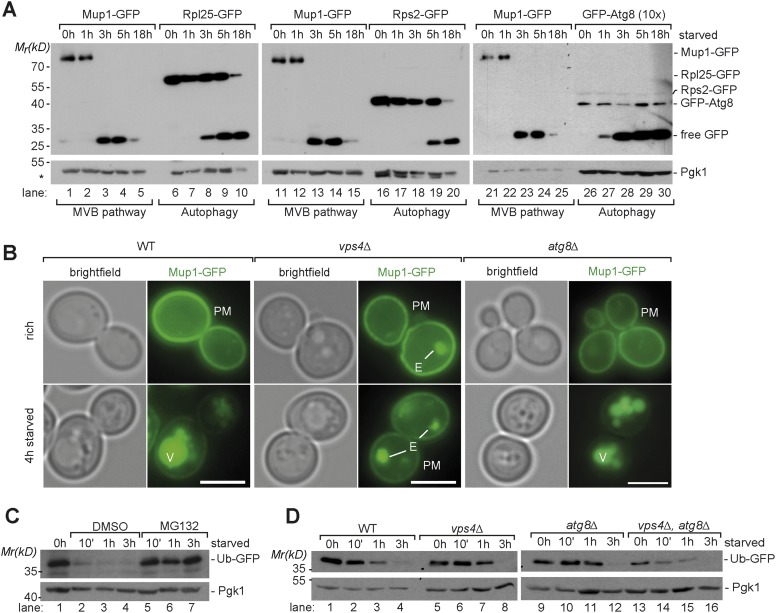
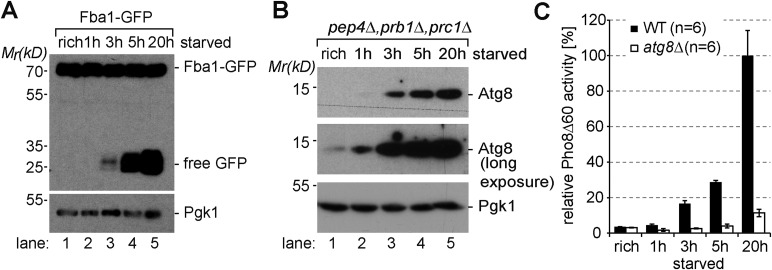
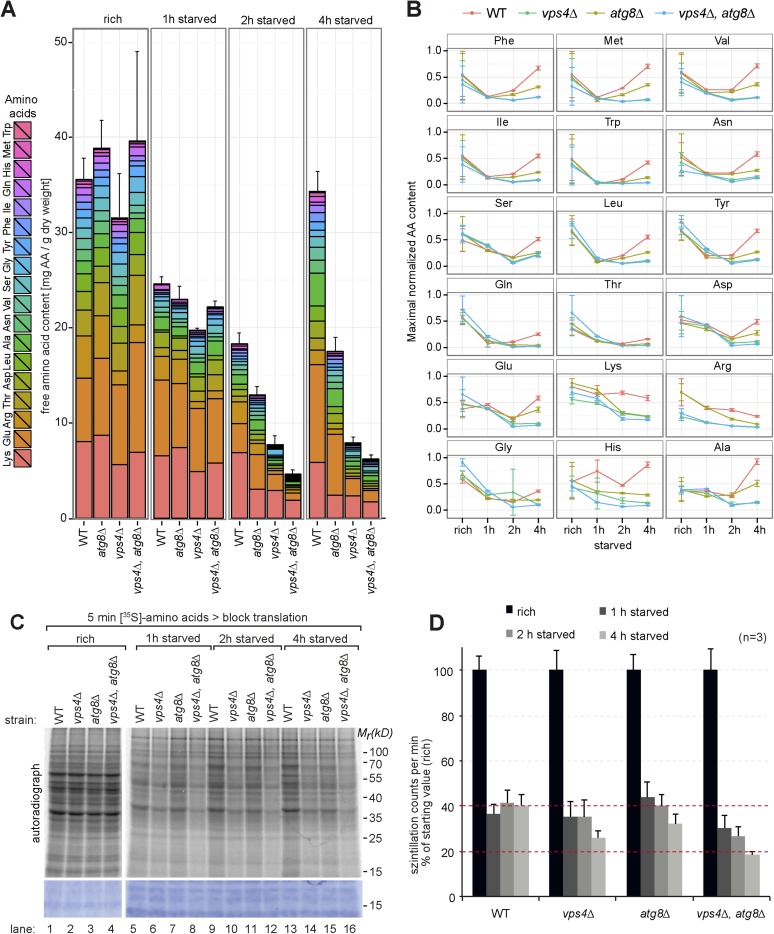
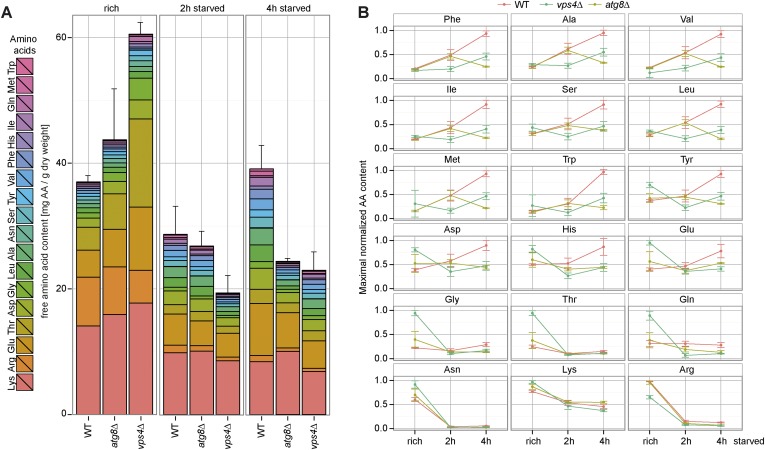
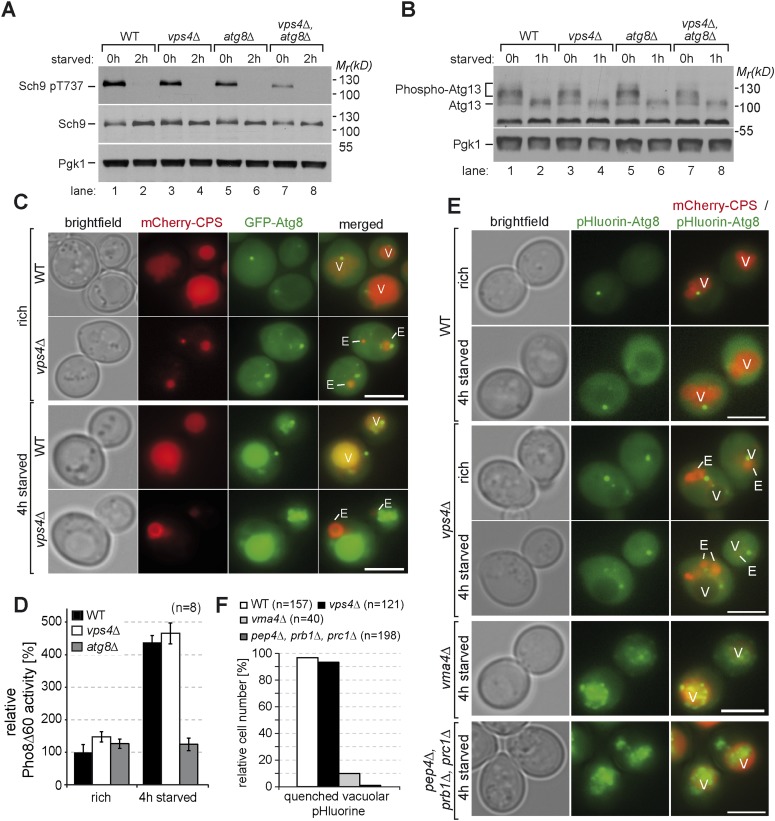
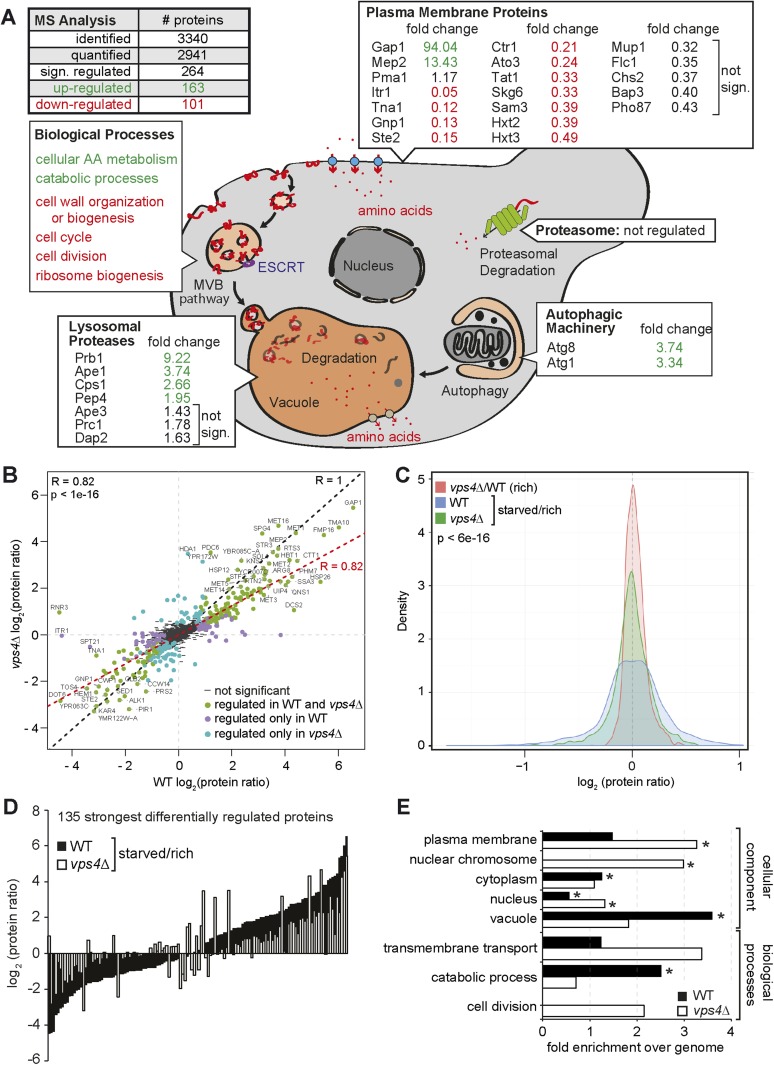
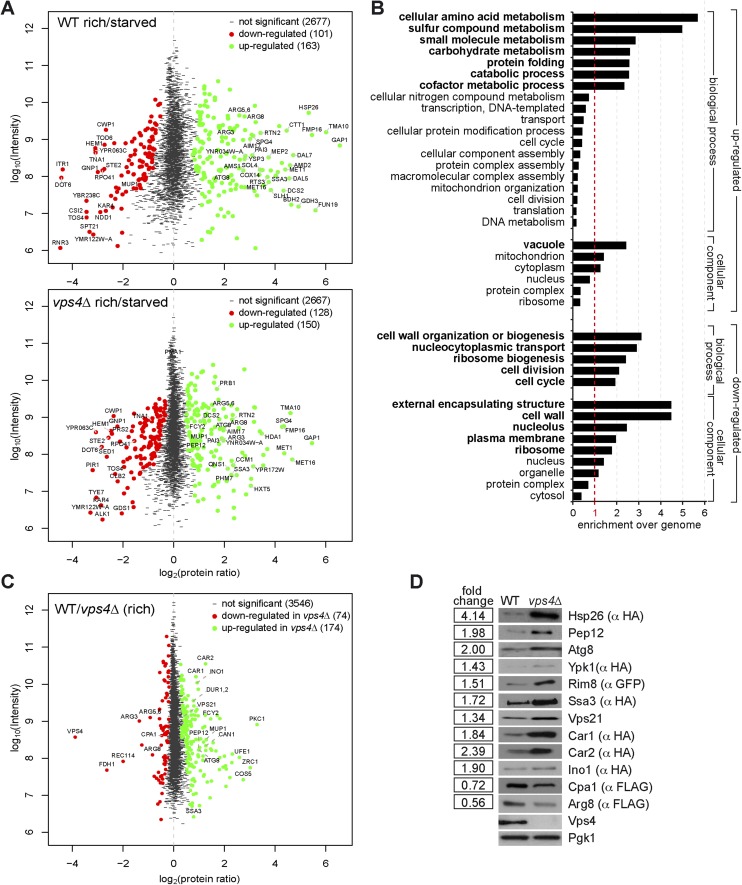
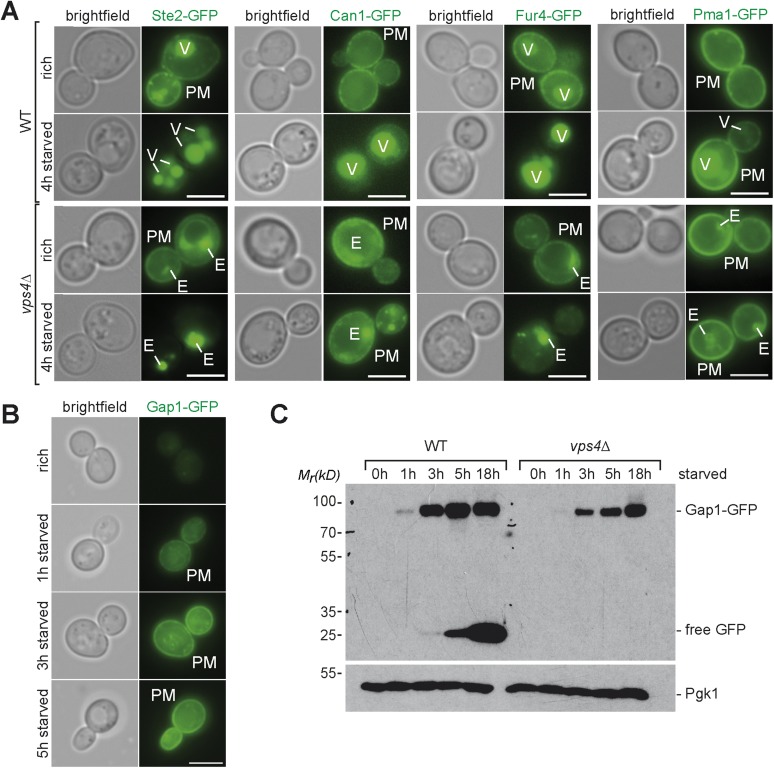
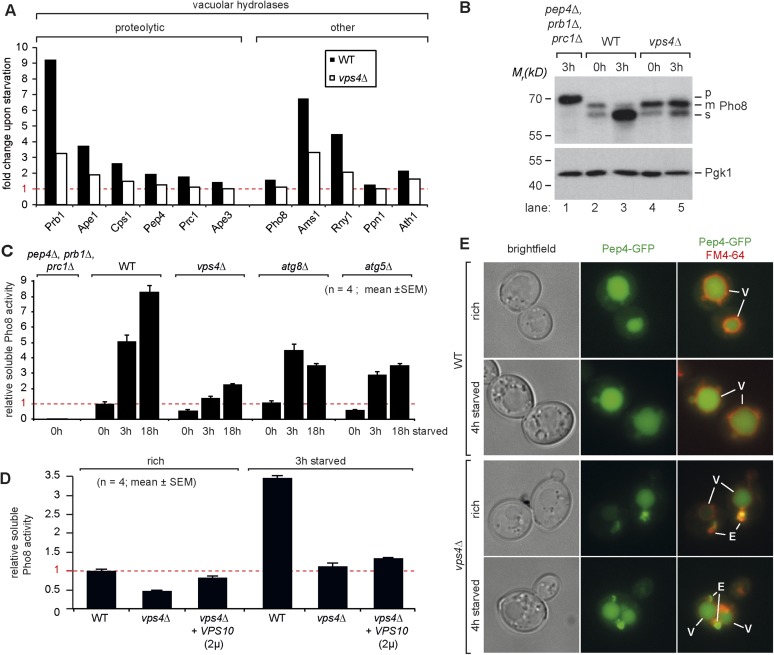
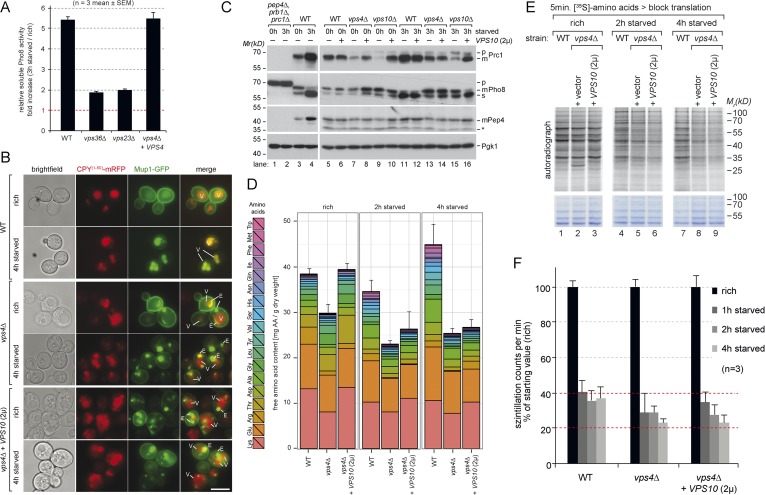
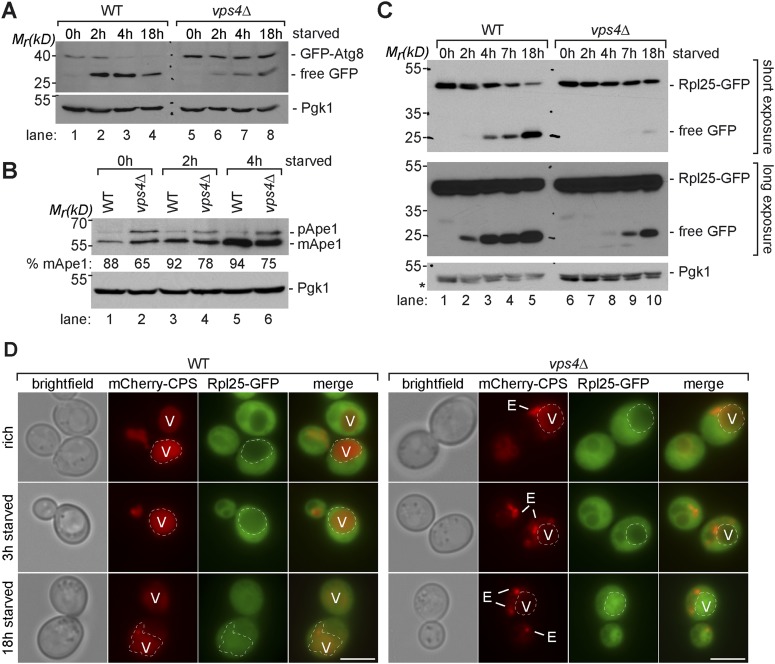
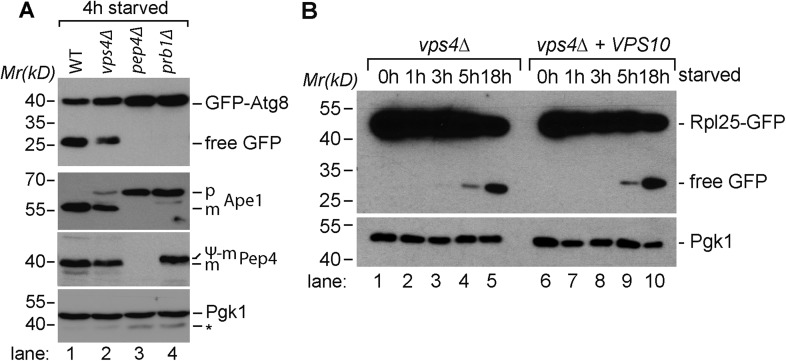
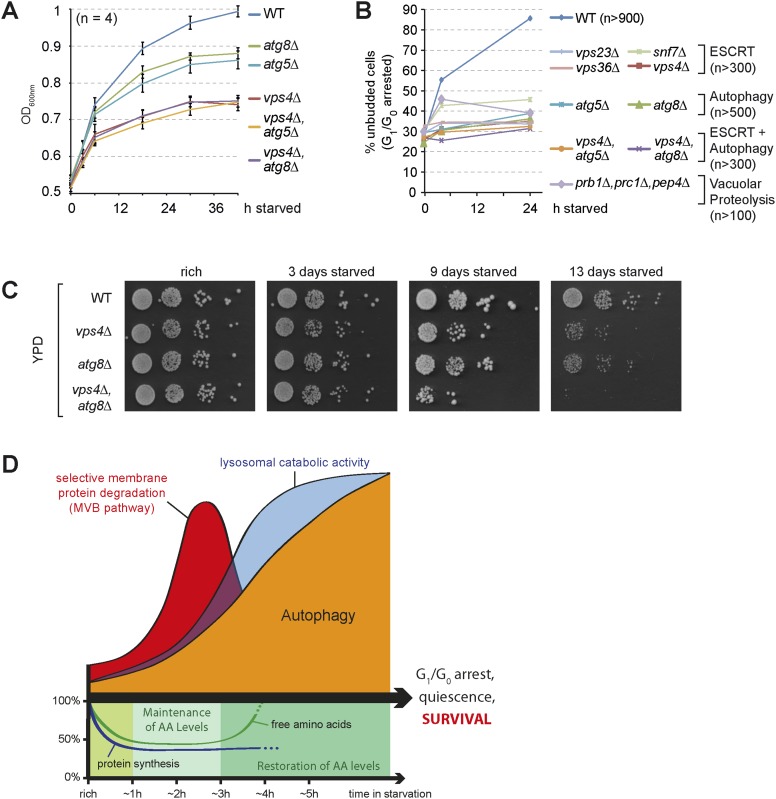
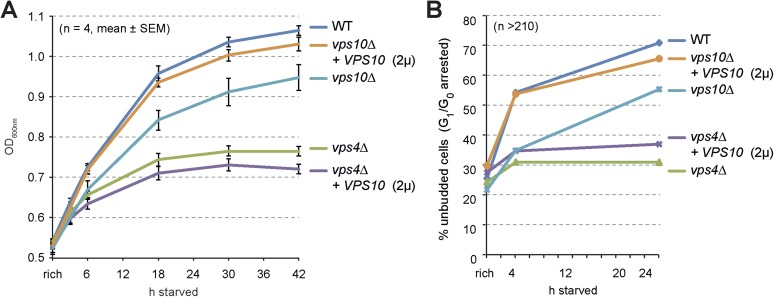
The degradation and recycling of cellular components is essential for cell growth and survival. Here we show how selective and non-selective lysosomal protein degradation pathways cooperate to ensure cell survival upon nutrient limitation. A quantitative analysis of starvation-induced proteome remodeling in yeast reveals comprehensive changes already in the first three hours. In this period, many different integral plasma membrane proteins undergo endocytosis and degradation in vacuoles via the multivesicular body (MVB) pathway. Their degradation becomes essential to maintain critical amino acids levels that uphold protein synthesis early during starvation. This promotes cellular adaptation, including the de novo synthesis of vacuolar hydrolases to boost the vacuolar catabolic activity. This order of events primes vacuoles for the efficient degradation of bulk cytoplasm via autophagy. Hence, a catabolic cascade including the coordinated action of the MVB pathway and autophagy is essential to enter quiescence to survive extended periods of nutrient limitation.

Keywords: MVB pathway; S. cerevisiae; autophagy; biochemistry; cell biology; endocytosis.


Conflict of interest statement

The authors declare that no competing interests exist.

Figures

Figure 1.
Figure 1.. Starvation induces selective and non-selective protein degradation pathways.
(A) WT cells expressing Mup1-GFP, Rpl25-GFP, Rps2-GFP or GFP-Atg8 were grown in rich medium (0 hr) or starved as indicated. Cell lysates were analyzed by SDS-PAGE and western blot (WB) using the indicated antibodies. *residual anti-GFP signal after re-probing the membrane with anti-Pgk1 antibody. (B) Fluorescence microscopy of Mup1-GFP in WT cells, vps4∆ mutants and atg8∆ mutants growing under rich or starvation conditions. (V)acuoles, (P)lasma (M)embrane and class (E) compartments. Scale bar = 5 µm. (C, D) Whole cell lysates of WT cells or the indicated mutants grown under rich conditions or starved for the indicated times were separated by SDS-PAGE and analyzed by western blot using the indicated antibodies. (C) pdr5∆ cells were treated with the proteasome inhibitor MG132 (50 µM) or vehicle (DMSO) during starvation. DOI: http://dx.doi.org/10.7554/eLife.07736.003
Figure 1—figure supplement 1.
Figure 1—figure supplement 1.. Induction of autophagy.
(A) SDS-PAGE and western blot analysis of WT cells grown under rich conditions or starved using the indicated antibodies. (B) Vacuolar hydrolase-deficient cells (pep4∆, prb1∆, prc1∆) analyzed as in (A). (C) Pho8∆60-specific alkaline phosphatase activity was measured in WT, and atg8∆ cells under rich conditions and after starvation (n = 6, mean ± SD). WT Pho8∆60 activity after 20 hr of starvation was set to 100%. DOI: http://dx.doi.org/10.7554/eLife.07736.004
Figure 2.
Figure 2.. Changes in free amino acid levels and protein synthesis during starvation.
(A) Cells were grown to mid-log phase (rich) and starved as indicated. Free amino acids were extracted and analyzed by liquid chromatography. Data are represented as the sum of free amino acids (mg) per gram of dry yeast. Mean ± SD, n ≥ 3. (B) Changes in individual amino acids from (A) normalized to maximal values. Mean ± SD, n ≥ 3. (C, D) Cells grown under the indicated conditions were incubated for 5 min with 35S-labeled Met and Cys. (C) 35S-incorporation was analyzed by SDS-PAGE and digital autoradiography. Coomassie staining shows equal protein loading. (D) Quantification of 35S-incorporation under rich conditions and after 1, 2 and 4 hr of starvation by liquid scintillation counting. Incorporation under rich conditions was set to 100%. Mean ± SEM, n = 3. DOI: http://dx.doi.org/10.7554/eLife.07736.005
Figure 2—figure supplement 1.
Figure 2—figure supplement 1.. Changes in free amino acids levels during starvation in prototrophic yeast.
(A) Prototrophic cells were grown to mid-log phase (rich) and starved as indicated. Free amino acids were extracted and analyzed by liquid chromatography. Data are represented as the sum of free amino acids (mg) per gram of dry yeast. Mean ± SD, n = 3. (B) Changes in individual amino acids from (A) were normalized to maximal values. Mean ± SD, n = 3. DOI: http://dx.doi.org/10.7554/eLife.07736.006
Figure 3.
Figure 3.. Autophagy in ESCRT mutants.
(A, B) SDS-PAGE and western blot analysis of total cell lysates from WT cells and vps4∆, atg8∆ single and double mutants grown in rich medium (0 hr) or during starvation using the indicated antibodies. (C) Live-cell fluorescence microscopy of WT cells and vps4∆ mutants expressing GFP-Atg8 (green) and mCherry-CPS (red) under rich conditions or 4 hr after starvation. (D) Pho8∆60-specific alkaline phosphatase activity was measured in WT, vps4∆ and atg8∆ cells under rich conditions and after 4 hr of starvation (n = 8, ±SD). WT Pho860 activity under rich conditions was normalized to 100%. (E) Fluorescence microscopy of pHluorin-Atg8 (green) and mCherry-CPS (red) in WT cells and indicated mutants under rich conditions or after 4 hr of starvation. (F) Quantification of quenching of vacuolar pHluorin-Atg8 from E. (C, E) (V)acuoles and class (E) compartments. Scale bar = 5 µm. DOI: http://dx.doi.org/10.7554/eLife.07736.007
Figure 4.
Figure 4.. The MVB is required for starvation induced proteome remodeling.
(A) Schematic presentation of proteome remodeling in WT cells during starvation. Starvation induced changes in protein levels were measured using SILAC based quantitative proteomics (see also Figure 4—figure supplement 1A,B, Supplementary files 1, 2). The major changes in WT cells under starvation as indicated by Gene Ontology (GO) analysis of significantly changed proteins are shown. Green: up-regulated; red: down-regulated under starvation. (B) Correlation of changes in protein abundance in WT cells and vps4∆ mutants during starvation (see also Figure 4—figure supplement 1A, Supplementary file 3). WT and vps4∆ mutant protein ratios (log2 [starved/rich]) are plotted against each other. Green: significantly regulated in both datasets; blue: significantly regulated only in vps4∆; purple: significantly regulated only in WT. Grey: not significantly regulated. (C) Density plot showing log2-transformed protein ratio distributions in the three quantitative proteome datasets. The significant protein changes are excluded. Blue: WT (starved)/WT(rich); green: vps4∆(starved)/vps4∆(rich); red: vps4∆(rich)/WT(rich) (see also Figure 4—figure supplement 1, Supplementary file 4). p-value according to Kolmogorov–Smirnov <6 × 10⁻¹⁶ (D) The 135 significantly differentially regulated proteins during starvation between WT cells (black bars) and vps4∆ mutants (white bars) (see also Supplementary file 5). (E) Enrichment of GO terms in 135 significantly differentially regulated proteins (from D). Data are represented as fold-enrichment over whole genome frequency (see also Supplementary file 6). * significantly represented GO terms. DOI: http://dx.doi.org/10.7554/eLife.07736.008
Figure 4—figure supplement 1.
Figure 4—figure supplement 1.. Quantitative proteomics and GO analysis.
(A, C) Representation of SILAC based quantitative proteomic changes. Protein ratio is plotted against signal intensity. Proteins that were significantly (significance B) down-regulated (red dots) or up-regulated (green dots) during 3 hr of starvation are shown. Non-regulated proteins are shown as grey bars. (A) Upper panel: protein ratios of WT cells starved/rich (labeled with heavy lysine); lower panel: protein ratios of vps4∆ mutants starved/rich (labeled with heavy lysine). (C) Protein ratios of vps4∆(rich)/WT(rich, labeled with heavy lysine). (B) GO terms (cellular processes and components) that were significantly up- or down-regulated in the proteomic analysis of WT cells under starvation. Data are represented as enrichment over whole genome frequency for each GO term. (Bold: more than 1.5-fold enriched). (D) SDS-PAGE and western blot analysis of cells grown under rich conditions using the indicated antibodies. DOI: http://dx.doi.org/10.7554/eLife.07736.009
Figure 4—figure supplement 2.
Figure 4—figure supplement 2.. Starvation induced endocytosis.
(A) Fluorescence microscopy of Ste2-GFP, Can1-GFP, Fur4-GFP, and Pma1-GFP in WT and vps4∆ cells growing under rich conditions or after starvation. Vacuole (V), class E compartment (E) and plasma membrane (PM) are labeled. Scale bar = 5 µm. (B) Fluorescence microscopy of Gap1-GFP in WT cells growing under rich conditions or after starvation. Plasma membrane (PM) is labeled. Scale bar = 5 µm. (C) WT and vps4∆ cells expressing Gap1-GFP were grown in rich medium or starved as indicated. Cell lysates were analyzed by SDS-PAGE and western blot (WB) using the indicated antibodies. DOI: http://dx.doi.org/10.7554/eLife.07736.010
Figure 5.
Figure 5.. Boosting the catabolic activity of vacuoles during starvation requires the MVB pathway.
(A) Starvation-induced changes in the protein levels of various vacuolar hydrolases based on SILAC data in WT (black) and vps4∆ mutants (white). (B) Indicated yeast strains were grown in rich medium (0 hr) or starved for 3 hr. Cell lysates were subjected to SDS-PAGE and western blot analysis with the indicated antibodies. p, precursor form; m, mature form; s, soluble form. (C, D) Soluble Pho8 (sPho8) activity in rich medium and upon starvation of the indicated strains (mean ± SEM, n = 4). (E) Fluorescence microscopy of Pep4-GFP (green) in WT cells and vps4∆ mutants growing under rich or starvation conditions. (V)acuoles (FM4-64, red) and class (E) compartments. Scale bar = 5 µm. vps10∆ + VPS10 (2 µ) cells were used as the isogenic WT control in (D) and (E). DOI: http://dx.doi.org/10.7554/eLife.07736.011
Figure 5—figure supplement 1.
Figure 5—figure supplement 1.. Boosting the catabolic activity of vacuoles requires membrane protein degradation via the MVB pathway.
(A) Soluble vacuolar alkaline phosphatase (sPho8) activity in WT and ESCRT mutants (vps36∆; vps23∆). Data are represented as fold increase in activity after 3 hr starvation over rich growth condition (n = 3; mean ± SEM). (B) Fluorescence microscopy of CPY(1–50)-mRFP and Mup1-GFP in WT cells, vps4∆ mutants and vps4∆ mutants over-expressing Vps10 growing under rich or starvation conditions. (V)acuoles and class (E) compartments. (C) Indicated yeast strains were grown in rich medium (0 hr) or starved for 3 hr. Cell lysates were subjected to SDS-PAGE and western blot analysis with the indicated antibodies. p, precursor form; m, mature form; s, soluble form; *unspecific background band. (D) WT cells, vps4∆ mutants and vps4∆ mutants over-expressing Vps10 were grown to mid-log phase (rich) and starved as indicated. Free amino acids were extracted and analyzed by liquid chromatography. Data are represented as the sum of free amino acids (mg) per gram of dry yeast. Mean ± SD, n = 3. (E) 35S-Met/Cys incorporation into proteins of WT (vps10∆ + VPS10, 2 µ), vps4∆ mutants and vps4∆ mutants over-expressing Vps10 under rich growth conditions and during starvation, was analyzed by SDS-PAGE and digital autoradiography. Coomassie staining shows equal protein loading. (F) Quantification of 35S-incorporation under rich conditions and after 1, 2 and 4 hr of starvation by liquid scintillation counting. Incorporation under rich conditions was set to 100%. Mean ± SEM, n = 3. DOI: http://dx.doi.org/10.7554/eLife.07736.012
Figure 6.
Figure 6.. Boosting the catabolic activity of vacuoles is essential for the efficient degradation of autophagic cargo.
(A, B, C) SDS-PAGE and western blot analysis of total cell lysates from WT cells and vps4∆ mutants grown in rich medium or during starvation using the indicated antibodies. p(ro)Ape1, m(ature)Ape1. *residual anti-GFP signal after re-probing the membrane with anti-Pgk1 antibody. (D) Fluorescence microscopy of Rpl25-GFP (green) and mCherry-CPS (red) in WT cells and vps4∆ mutants under rich conditions or after starvation. Dashed lines indicate the vacuolar membrane. (V)acuoles and class (E) compartments. Scale bar = 5 µm. DOI: http://dx.doi.org/10.7554/eLife.07736.013
Figure 6—figure supplement 1.
Figure 6—figure supplement 1.. Proteolytic processing of autophagic cargo.
(A) SDS-PAGE and western blot analysis of total cell lysates from WT cells and the indicated mutants starved for 4 hr using the indicated antibodies. p, precursor form; m, mature form; Ψ-m, pseudo-mature form generated in prb1∆; *residual anti-GFP signal after re-probing the membrane with anti-Pgk1 antibody. (B) SDS-PAGE and western blot analysis of total cell lysates from vps4∆ mutants and vps4∆ mutants overexpressing Vps10 grown in rich medium or during starvation using the indicated antibodies. DOI: http://dx.doi.org/10.7554/eLife.07736.014
Figure 7.
Figure 7.. The coordinated function of the MVB pathway and autophagy is required to enter quiescence upon starvation.
(A) Growth of WT cells and the indicated mutants after shift from logarithmic growth in rich medium (0 hr) to starvation measured with OD600nm. Mean ± SEM, n = 4. (B) Quantification of unbudded cells (G1/G0 arrested) under rich conditions (0 hr) or after indicated time of starvation. (C) Cells were starved for the indicated times and equal amounts of cells in serial dilutions were placed on rich medium (YPD). (D) Model representing the coordinated action of lysosomal protein degradation pathways for amino acid maintainance and recycling as well as protein synthesis during starvation. DOI: http://dx.doi.org/10.7554/eLife.07736.015
Figure 7—figure supplement 1.
Figure 7—figure supplement 1.. Cell growth and entry into quiescence upon starvation.
(A) Growth of WT cells and the indicated mutants overexpressing Vps10 after shift from logarithmic growth in rich medium to starvation measured with OD600nm. Mean ± SEM, n = 4. (B) Quantification of unbudded cells (G1/G0 arrested) under rich growth or after 4 hr or 24 hr of starvation. n > 210. DOI: http://dx.doi.org/10.7554/eLife.07736.016

Similar articles

Cited by

References

    1. Abeliovich H, Dunn WA, Jr, Kim J, Klionsky DJ. Dissection of autophagosome biogenesis into distinct nucleation and expansion steps. The Journal of Cell Biology. 2000;151:1025–1034. doi: 10.1083/jcb.151.5.1025. - DOI - PMC - PubMed
    1. Altmann F. Determination of amino sugars and amino acids in glycoconjugates using precolumn derivatization with o-phthalaldehyde. Analytical Biochemistry. 1992;204:215–219. doi: 10.1016/0003-2697(92)90164-3. - DOI - PubMed
    1. An Z, Tassa A, Thomas C, Zhong R, Xiao G, Fotedar R, Tu BP, Klionsky DJ, Levine B. Autophagy is required for G₁/G₀ quiescence in response to nitrogen starvation in Saccharomyces cerevisiae. Autophagy. 2014;10:1702–1711. doi: 10.4161/auto.32122. - DOI - PMC - PubMed
    1. Baba M, Osumi M, Scott SV, Klionsky DJ, Ohsumi Y. Two distinct pathways for targeting proteins from the cytoplasm to the vacuole/lysosome. The Journal of Cell Biology. 1997;139:1687–1695. doi: 10.1083/jcb.139.7.1687. - DOI - PMC - PubMed
    1. Babst M, Wendland B, Estepa EJ, Emr SD. The Vps4p AAA ATPase regulates membrane association of a Vps protein complex required for normal endosome function. The EMBO Journal. 1998;17:2982–2993. doi: 10.1093/emboj/17.11.2982. - DOI - PMC - PubMed

Publication types

MeSH terms

Substances