A RNA-Seq Analysis of the Rat Supraoptic Nucleus Transcriptome: Effects of Salt Loading on Gene Expression
- PMID: 25897513
- PMCID: PMC4405539
- DOI: 10.1371/journal.pone.0124523
A RNA-Seq Analysis of the Rat Supraoptic Nucleus Transcriptome: Effects of Salt Loading on Gene Expression
Erratum in
-
Correction: A RNA-Seq Analysis of the Rat Supraoptic Nucleus Transcriptome: Effects of Salt Loading on Gene Expression.PLoS One. 2015 Jun 25;10(6):e0131892. doi: 10.1371/journal.pone.0131892. eCollection 2015. PLoS One. 2015. PMID: 26110672 Free PMC article. No abstract available.
Abstract
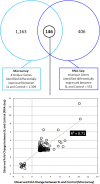
Magnocellular neurons (MCNs) in the hypothalamo-neurohypophysial system (HNS) are highly specialized to release large amounts of arginine vasopressin (Avp) or oxytocin (Oxt) into the blood stream and play critical roles in the regulation of body fluid homeostasis. The MCNs are osmosensory neurons and are excited by exposure to hypertonic solutions and inhibited by hypotonic solutions. The MCNs respond to systemic hypertonic and hypotonic stimulation with large changes in the expression of their Avp and Oxt genes, and microarray studies have shown that these osmotic perturbations also cause large changes in global gene expression in the HNS. In this paper, we examine gene expression in the rat supraoptic nucleus (SON) under normosmotic and chronic salt-loading SL) conditions by the first time using "new-generation", RNA sequencing (RNA-Seq) methods. We reliably detect 9,709 genes as present in the SON by RNA-Seq, and 552 of these genes were changed in expression as a result of chronic SL. These genes reflect diverse functions, and 42 of these are involved in either transcriptional or translational processes. In addition, we compare the SON transcriptomes resolved by RNA-Seq methods with the SON transcriptomes determined by Affymetrix microarray methods in rats under the same osmotic conditions, and find that there are 6,466 genes present in the SON that are represented in both data sets, although 1,040 of the expressed genes were found only in the microarray data, and 2,762 of the expressed genes are selectively found in the RNA-Seq data and not the microarray data. These data provide the research community a comprehensive view of the transcriptome in the SON under normosmotic conditions and the changes in specific gene expression evoked by salt loading.
Conflict of interest statement
Figures


Similar articles
-
Microarray analysis of gene expression in the supraoptic nucleus of normoosmotic and hypoosmotic rats.Cell Mol Neurobiol. 2006 Jul-Aug;26(4-6):959-78. doi: 10.1007/s10571-006-9017-0. Epub 2006 May 13. Cell Mol Neurobiol. 2006. PMID: 16699879 Free PMC article.
-
A comparison of physiological and transcriptome responses to water deprivation and salt loading in the rat supraoptic nucleus.Am J Physiol Regul Integr Comp Physiol. 2015 Apr 1;308(7):R559-68. doi: 10.1152/ajpregu.00444.2014. Epub 2015 Jan 28. Am J Physiol Regul Integr Comp Physiol. 2015. PMID: 25632023 Free PMC article.
-
Neurotransmitter regulation of c-fos and vasopressin gene expression in the rat supraoptic nucleus.Exp Neurol. 2009 Sep;219(1):212-22. doi: 10.1016/j.expneurol.2009.05.019. Epub 2009 May 20. Exp Neurol. 2009. PMID: 19463813 Free PMC article.
-
Gene expression in the supraoptic nucleus.Microsc Res Tech. 2002 Jan 15;56(2):158-63. doi: 10.1002/jemt.10020. Microsc Res Tech. 2002. PMID: 11810718 Review.
-
Cell-type specific expression of oxytocin and vasopressin genes: an experimental odyssey.J Neuroendocrinol. 2012 Apr;24(4):528-38. doi: 10.1111/j.1365-2826.2011.02236.x. J Neuroendocrinol. 2012. PMID: 21985498 Free PMC article. Review.
Cited by
-
Transcriptome and methylome of the supraoptic nucleus provides insights into the age-dependent loss of neuronal plasticity.Front Aging Neurosci. 2023 Aug 30;15:1223273. doi: 10.3389/fnagi.2023.1223273. eCollection 2023. Front Aging Neurosci. 2023. PMID: 37711995 Free PMC article.
-
Regulation of cAMP Responsive Element Binding Protein 3-Like 1 (Creb3l1) Expression by Orphan Nuclear Receptor Nr4a1.Front Mol Neurosci. 2017 Dec 12;10:413. doi: 10.3389/fnmol.2017.00413. eCollection 2017. Front Mol Neurosci. 2017. PMID: 29311806 Free PMC article.
-
Activation of lateral hypothalamic area neurotensin-expressing neurons promotes drinking.Neuropharmacology. 2019 Aug;154:13-21. doi: 10.1016/j.neuropharm.2018.09.038. Epub 2018 Sep 25. Neuropharmacology. 2019. PMID: 30266601 Free PMC article.
-
Spatial transcriptomics reveal basal sex differences in supraoptic nucleus gene expression of adult rats related to cell signaling and ribosomal pathways.Biol Sex Differ. 2023 Oct 19;14(1):71. doi: 10.1186/s13293-023-00554-3. Biol Sex Differ. 2023. PMID: 37858270 Free PMC article.
-
Ageing restructures the transcriptome of the hypothalamic supraoptic nucleus and alters the response to dehydration.NPJ Aging. 2023 Jun 1;9(1):12. doi: 10.1038/s41514-023-00108-2. NPJ Aging. 2023. PMID: 37264028 Free PMC article.
References
-
- Antunes-Rodrigues J, de Castro M, Elias LL, Valenca MM, McCann SM (2004) Neuroendocrine control of body fluid metabolism. Physiol Rev 84: 169–208. - PubMed
-
- Armstrong WE (1995) Morphological and electrophysiological classification of hypothalamic supraoptic neurons. Prog Neurobiol 47: 291–339. - PubMed
-
- Brownstein MJ, Russell JT, Gainer H (1980) Synthesis, transport, and release of posterior pituitary hormones. Science 207: 373–378. - PubMed
-
- Hatton GI (1990) Emerging concepts of structure-function dynamics in adult brain: the hypothalamo-neurohypophysial system. Prog Neurobiol 34: 437–504. - PubMed
-
- Hatton GI (1997) Function-related plasticity in hypothalamus. Annu Rev Neurosci 20: 375–397. - PubMed
Publication types
MeSH terms
Substances
Associated data
- Actions
- Actions
- SRA/SRP049482
Grants and funding
LinkOut - more resources
Full Text Sources
Other Literature Sources
Miscellaneous

