. 2015 Apr 22:12:79.
doi: 10.1186/s12974-015-0293-9.

Astrocyte response to IFN-γ limits IL-6-mediated microglia activation and progressive autoimmune encephalomyelitis

Affiliations

Astrocyte response to IFN-γ limits IL-6-mediated microglia activation and progressive autoimmune encephalomyelitis

Carine Savarin et al. J Neuroinflammation. .

Abstract

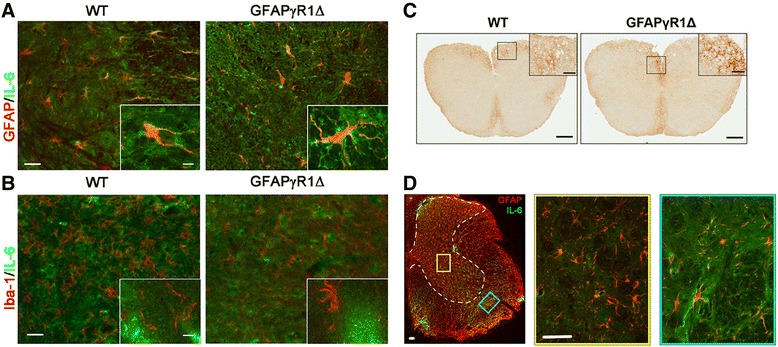
Background: Therapeutic modalities effective in patients with progressive forms of multiple sclerosis (MS) are limited. In a murine model of progressive MS, the sustained disability during the chronic phase of experimental autoimmune encephalomyelitis (EAE) correlated with elevated expression of interleukin (IL)-6, a cytokine with pleiotropic functions and therapeutic target for non-central nervous system (CNS) autoimmune disease. Sustained IL-6 expression in astrocytes restricted to areas of demyelination suggested that IL-6 plays a major role in disease progression during chronic EAE.

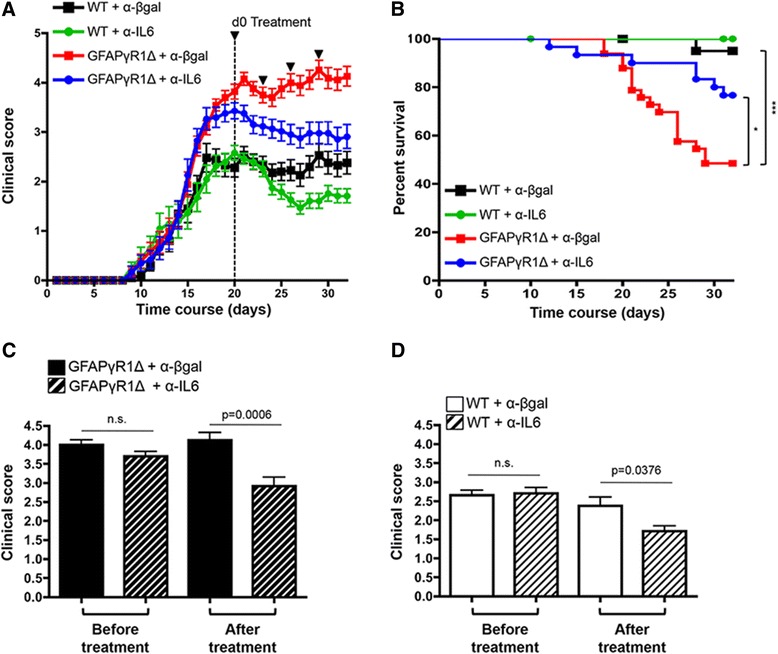
Methods: A progressive form of EAE was induced using transgenic mice expressing a dominant negative interferon-γ (IFN-γ) receptor alpha chain under control of human glial fibrillary acidic protein (GFAP) promoter (GFAPγR1Δ mice). The role of IL-6 in regulating progressive CNS autoimmunity was assessed by treating GFAPγR1Δ mice with anti-IL-6 neutralizing antibody during chronic EAE.

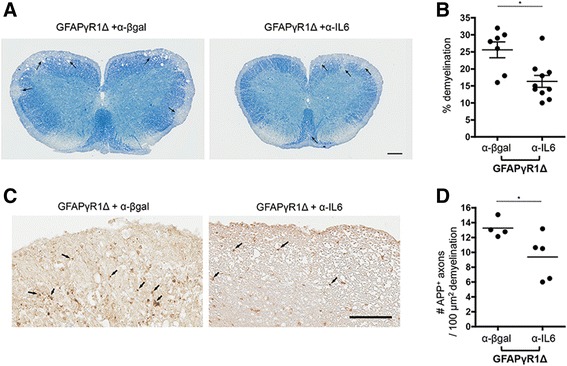
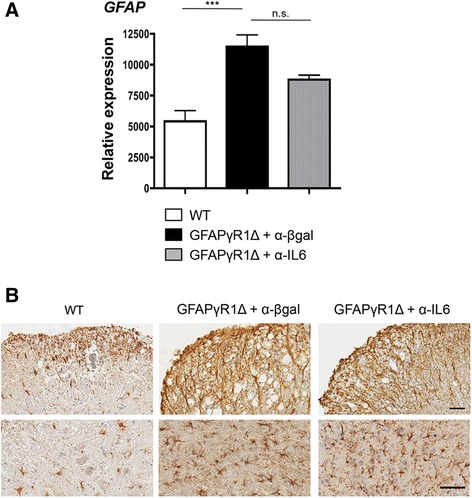
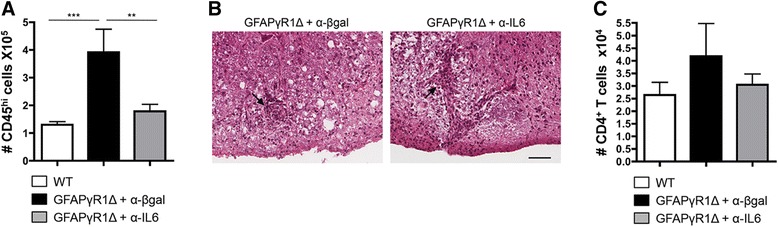
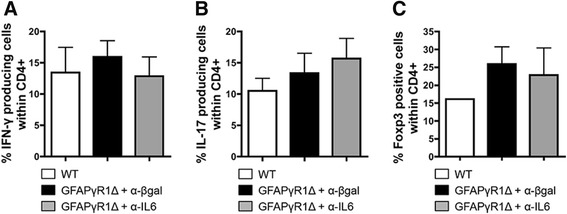
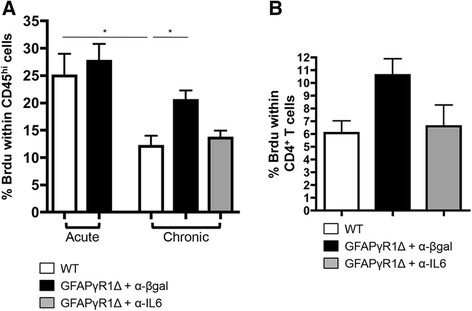
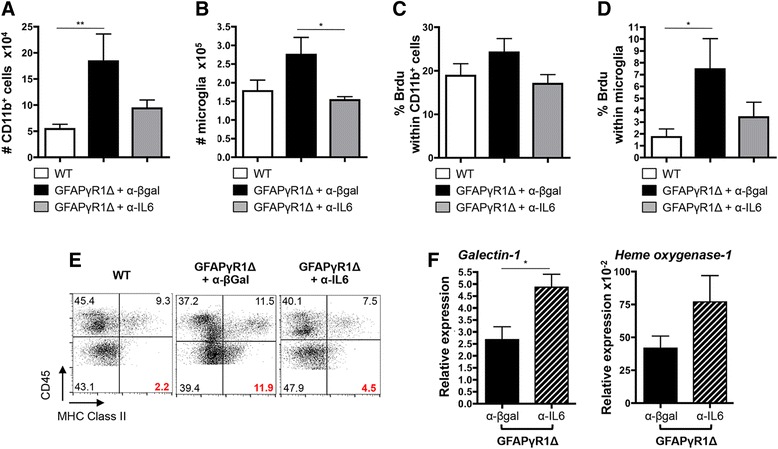
Results: IL-6 neutralization restricted disease progression and decreased disability, myelin loss, and axonal damage without affecting astrogliosis. IL-6 blockade reduced CNS inflammation by limiting inflammatory cell proliferation; however, the relative frequencies of CNS leukocyte infiltrates, including the Th1, Th17, and Treg CD4 T cell subsets, were not altered. IL-6 blockade rather limited the activation and proliferation of microglia, which correlated with higher expression of Galectin-1, a regulator of microglia activation expressed by astrocytes.

Conclusions: These data demonstrate that astrocyte-derived IL-6 is a key mediator of progressive disease and support IL-6 blockade as a viable intervention strategy to combat progressive MS.


Figures

Figure 1
Figure 1
Astrocytes produce IL-6 during chronic EAE. IL-6 co-localizes with GFAP+ astrocytes (A) in both WT and GFAPγR1Δ mice during the acute EAE, but not with Iba-1+ macrophage/microglia (B). Bars = 25 μm in the main panel, 5 μm in the insets. (C) During resolving (WT mice) and progressive (GFAPγR1Δ mice) EAE at day 35 post immunization, IL-6-secreting cells were restricted to white matter areas within the spinal cord of both WT and GFAPγR1Δ mice. Bar = 200 μm in the main figure, bar = 50 μm in the inset. (D) During progressive EAE, activated astrocytes are found in both gray matter (marked with a dashed line) and white matter lesion areas. No astrocytes producing IL-6 were detected in the gray matter (yellow frame). Only astrocytes in or around white matter lesions produced IL-6 (cyan frame). Images were obtained from the lumbar segments of both WT and GFAPγR1Δ mice and are representative of three mice per group. Bar = 50 μm.
Figure 2
Figure 2
Anti-IL-6 treatment ameliorates clinical disease. GFAPγR1Δ and WT mice were separated into two groups with identical clinical scores at the peak of EAE and received either the isotype control α-β-gal or α-IL-6 mAb treatment. (A) Disease progression was inhibited in GFAPγR1Δ mice and recovery was promoted in WT mice by anti-IL-6 treatment. Arrowheads represent time of injection. (B) Minimal mortality in WT mice treated with α-β-gal or α-IL-6 mAb. Survival decreased in GFAPγR1Δ mice treated with isotype control mAb. By contrast, mortality was reduced by treatment of GFAPγR1Δ mice with α-IL-6 mAb. Kaplan-Meier survival curves with *P < 0.05, ***P < 0.001, log-rank test. (C, D) At day 32 post immunization (12 days after initial α-IL-6 treatment), both GFAPγR1Δ (C) and WT (D) mice treated with α-IL-6 exhibited improved clinical disease. Statistical differences determined by a two-tailed unpaired t test. Data represent the average ± SEM with GFAPγR1Δ + α-β-gal (n = 33), GFAPγR1Δ + α-IL-6 (n = 30), WT+ α-β-gal (n = 20), and WT+ α-IL-6 (n = 20) from at least three separate experiments.
Figure 3
Figure 3
Inhibition of disease progression in GFAPγR1Δ mice correlates with decreased demyelination and axonal damage. Spinal cord sections of GFAPγR1Δ mice treated with α-β-gal and α-IL-6 mAbs at day 32 post immunization stained with LFB (A) or anti-APP (C) to assess demyelination and axonal damage, respectively. Representative sections from three experiments with three individual mice per group per experiment. In (A), areas of demyelination are shown with arrows. Bar = 200 μm. (B) Percentage area of demyelination in spinal cord white matter calculated by analysis of transverse sections at six separate levels per mouse. Data represent the mean ± SEM of seven to nine individual mice per group from two separate experiments. APP+-damaged axons (C) shown with arrows. Bar = 100 μm. (D) Number of APP+ axons per 100-μm2 area of demyelination analyzed in GFAPγR1Δ mice treated with α-β-gal and α-IL-6 mAb at day 32 post immunization. Data represent the mean ± SEM of four to five individual mice per group from two separate experiments. Statistical differences determined by a two-tailed unpaired t test with *P < 0.05.
Figure 4
Figure 4
IL-6 blockade has a limited effect on astrocyte activation. (A) GFAP mRNA expression analyzed by real-time PCR at day 32 post immunization in the spinal cords of WT, GFAPγR1Δ + α-β-gal, and GFAPγR1Δ + α-IL-6 mice with n = 3 to 4 individual mice per group. Statistics were calculated with one-way ANOVA with Bonferroni post-test with ***P < 0.001. (B) Immunohistochemical staining for GFAP in WT, GFAPγR1Δ + α-β-gal, and GFAPγR1Δ + α-IL-6 mice. Upper panels show GFAP labeling within areas of white matter demyelination. Lower panels show GFAP labeling in gray matter distal from areas of demyelination. Bar = 50 μm.
Figure 5
Figure 5
Inflammatory leukocytes during progressive EAE are reduced by IL-6 blockade. (A) Total number of bone marrow-derived inflammatory cells (CD45hi). Data represent the mean ± SEM of two separate experiments with n = 4 per group per experiment. Statistics were calculated with one-way ANOVA with Bonferroni post-test with **P < 0.01; ***P < 0.001. (B) Inflammatory cells within the spinal cord sections of GFAPγR1Δ mice treated with α-β-gal or α-IL-6 mAb at day 32 post immunization identified with H&E. Inflammatory cells were limited to lesions and were both perivascular (arrows) and within the parenchyma. Bar = 50 μm. Representative sections from two experiments with four individual mice per group per experiment. (C) CD4+ T cells (CD45hiCD4+) within the CNS of WT, GFAPγR1Δ + α-β-gal, and GFAPγR1Δ + α-IL-6 mice analyzed by flow cytometry at day 32 post immunization. Data represent the mean ± SEM of two separate experiments with n = 4 per group per experiment.
Figure 6
Figure 6
CD4+ T cell response is not altered by anti-IL-6 treatment. Frequencies of CD4+ T cells within the CNS of WT, GFAPγR1Δ + α-β-gal, and GFAPγR1Δ + α-IL-6 mice producing IFN-γ (A) and IL-17 (B) as well as cells expressing Foxp3 (C) determined by flow cytometry at day 32 post immunization. Data represent the mean ± SEM of two separate experiments with n = 4 pooled mice per group per experiment.
Figure 7
Figure 7
Proliferation of inflammatory cells during progressive EAE is reduced by anti-IL-6 treatment. (A) Proliferation of CD45hi cells within the CNS of WT and GFAPγR1Δ mice during acute EAE (day 20 post immunization) or WT, GFAPγR1Δ + α-β-gal, and GFAPγR1Δ + α-IL-6 mice during chronic EAE (day 32 post immunization) measured by BrdU staining and flow cytometry. Four individual mice were analyzed per group per time point. (B) Percentage of BrdU-positive cells within CD4+ cells analyzed at day 32 post immunization in WT and GFAPγR1Δ mice treated with α-β-gal or α-IL-6 mAb. Data represent the mean ± SEM of two separate experiments with n = 4 per group per experiment. Statistics were calculated with one-way ANOVA with Bonferroni post-test with *P < 0.05.
Figure 8
Figure 8
Increased microgliosis characteristic of progressive EAE is decreased after anti-IL-6 treatment. Total number of macrophages (CD45hiCD11b+) (A) and microglia (CD45loCD11b+) (B) within the CNS of WT and GFAPγR1Δ mice treated with α-IL-6 or α-β-gal mAb at day 32 post immunization. Percentage of BrdU-positive macrophages (CD45hiCD11b+) (C) and microglia (CD45loCD11b+) (D) in WT and GFAPγR1Δ mice treated with α-β-gal or α-IL-6 analyzed at day 32 post immunization by flow cytometry. Data represent the mean ± SEM of two separate experiments with n = 4 per group per experiment. Statistics calculated with one-way ANOVA with Bonferroni post-test with *P < 0.05; **P < 0.01. (E) Microglia activation, characterized by MHC class II expression within CD45loCD11b+ cells, analyzed at day 32 post immunization by flow cytometry in WT, GFAPγR1Δ + α-β-gal, and GFAPγR1Δ + α-IL-6 mice. (F) Galectin-1 and heme oxygenase-1 mRNA expression within the brain of GFAPγR1Δ mice treated with α-β-gal or α-IL-6 at day 32 post immunization. Data represent the mean ± SEM of four individual mice per group. Statistics were calculated with by a two-tailed unpaired t test with *P < 0.05.

Similar articles

Cited by

References

    1. Lassmann H, van Horssen J, Mahad D. Progressive multiple sclerosis: pathology and pathogenesis. Nat Rev Neurol. 2012;8:647–56. doi: 10.1038/nrneurol.2012.168. - DOI - PubMed
    1. Gold R, Linington C, Lassmann H. Understanding pathogenesis and therapy of multiple sclerosis via animal models: 70 years of merits and culprits in experimental autoimmune encephalomyelitis research. Brain. 2006;129:1953–71. doi: 10.1093/brain/awl075. - DOI - PubMed
    1. Rangachari M, Kuchroo VK. Using EAE to better understand principles of immune function and autoimmune pathology. J Autoimmun. 2013;45:31–9. doi: 10.1016/j.jaut.2013.06.008. - DOI - PMC - PubMed
    1. Fletcher JM, Lalor SJ, Sweeney CM, Tubridy N, Mills KH. T cells in multiple sclerosis and experimental autoimmune encephalomyelitis. Clin Exp Immunol. 2010;162:1–11. doi: 10.1111/j.1365-2249.2010.04143.x. - DOI - PMC - PubMed
    1. Codarri L, Gyulveszi G, Tosevski V, Hesske L, Fontana A, Magnenat L, et al. RORgammat drives production of the cytokine GM-CSF in helper T cells, which is essential for the effector phase of autoimmune neuroinflammation. Nat Immunol. 2011;12:560–7. doi: 10.1038/ni.2027. - DOI - PubMed

Publication types

MeSH terms