Differences in the Kinetic of the First Meiotic Division and in Active Mitochondrial Distribution between Prepubertal and Adult Oocytes Mirror Differences in their Developmental Competence in a Sheep Model
- PMID: 25893245
- PMCID: PMC4403920
- DOI: 10.1371/journal.pone.0124911
Differences in the Kinetic of the First Meiotic Division and in Active Mitochondrial Distribution between Prepubertal and Adult Oocytes Mirror Differences in their Developmental Competence in a Sheep Model
Abstract
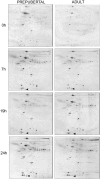
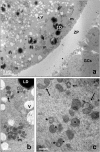
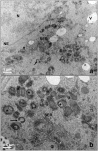
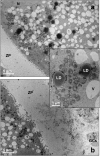
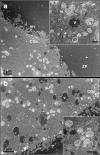
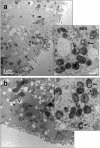
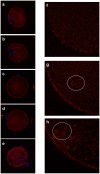
Our aim is to verify if oocyte developmental potential is related to the timing of meiotic progression and to mitochondrial distribution and activity using prepubertal and adult oocytes as models of low and high developmental capacity respectively. Prepubertal and adult oocytes were incorporated in an in vitro maturation system to determine meiotic and developmental competence and to assess at different time points kinetic of meiotic maturation, 2D protein electrophoresis patterns, ATP content and mitochondria distribution. Maturation and fertilization rates did not differ between prepubertal and adult oocytes (95.1% vs 96.7% and 66.73% vs 70.62% respectively for prepubertal and adult oocytes). Compared to adults, prepubertal oocytes showed higher parthenogenesis (17.38% vs 2.08% respectively in prepubertals and adults; P<0.01) and polispermy (14.30% vs 2.21% respectively in prepubertals and adults; P<0.01), lower cleavage rates (60.00% vs 67.08% respectively in prepubertals and adults; P<0.05) and blastocyst output (11.94% vs 34.% respectively in prepubertals and adults; P<0.01). Prepubertal oocytes reached MI stage 1 hr later than adults and this delay grows as the first meiotic division proceeds. Simultaneously, the protein pattern was altered since in prepubertal oocytes it fluctuates, dropping and rising to levels similar to adults only at 24 hrs. In prepubertal oocytes ATP rise is delayed and did not reach levels comparable to adult ones. CLSM observations revealed that at MII, in the majority of prepubertal oocytes, the active mitochondria are homogenously distributed, while in adults they are aggregated in big clusters. Our work demonstrates that mitochondria and their functional aggregation during maturation play an active role to provide energy in terms of ATP. The oocyte ATP content determines the timing of the meiotic cycle and the acquisition of developmental competence. Taken together our data suggest that oocytes with low developmental competence have a slowed down energetic metabolism which delays later development.
Conflict of interest statement
Figures





Similar articles
-
A pre-in vitro maturation medium containing cumulus oocyte complex ligand-receptor signaling molecules maintains meiotic arrest, supports the cumulus oocyte complex and improves oocyte developmental competence.Mol Hum Reprod. 2017 Sep 1;23(9):594-606. doi: 10.1093/molehr/gax032. Mol Hum Reprod. 2017. PMID: 28586460
-
AY9944 A-7 promotes meiotic resumption and preimplantation development of prepubertal sheep oocytes maturing in vitro.Theriogenology. 2013 Sep 15;80(5):436-42. doi: 10.1016/j.theriogenology.2013.05.005. Epub 2013 Jun 6. Theriogenology. 2013. PMID: 23746691
-
Heparin and cAMP modulators interact during pre-in vitro maturation to affect mouse and human oocyte meiosis and developmental competence.Hum Reprod. 2013 Jun;28(6):1536-45. doi: 10.1093/humrep/det086. Epub 2013 Apr 4. Hum Reprod. 2013. PMID: 23559189
-
Bovine oocyte meiotic inhibition before in vitro maturation and its value to in vitro embryo production: does it improve developmental competence?Reprod Domest Anim. 2012 Aug;47(4):687-93. doi: 10.1111/j.1439-0531.2011.01924.x. Epub 2011 Oct 12. Reprod Domest Anim. 2012. PMID: 21988654 Review.
-
Mitochondrial function in the human oocyte and embryo and their role in developmental competence.Mitochondrion. 2011 Sep;11(5):797-813. doi: 10.1016/j.mito.2010.09.012. Epub 2010 Oct 7. Mitochondrion. 2011. PMID: 20933103 Review.
Cited by
-
Protective effect of resveratrol against cadmium-induced toxicity on ovine oocyte in vitro maturation and fertilization.J Anim Sci Biotechnol. 2022 Jul 22;13(1):83. doi: 10.1186/s40104-022-00731-1. J Anim Sci Biotechnol. 2022. PMID: 35864507 Free PMC article.
-
Mitochondrial content, activity, and morphology in prepubertal and adult human ovaries.J Assist Reprod Genet. 2021 Oct;38(10):2581-2590. doi: 10.1007/s10815-021-02282-2. Epub 2021 Jul 31. J Assist Reprod Genet. 2021. PMID: 34331619 Free PMC article.
-
Effects of low-dose X-ray medical diagnostics on female gonads: Insights from large animal oocytes and human ovaries as complementary models.PLoS One. 2021 Jun 24;16(6):e0253536. doi: 10.1371/journal.pone.0253536. eCollection 2021. PLoS One. 2021. PMID: 34166427 Free PMC article.
-
Seasonal Effect on Developmental Competence, Oxidative Status and Tubulin Assessment of Prepubertal Ovine Oocyte.Animals (Basel). 2021 Jun 24;11(7):1886. doi: 10.3390/ani11071886. Animals (Basel). 2021. PMID: 34202918 Free PMC article.
-
In vitro embryo production in small ruminants: what is still missing?Anim Reprod. 2023 Nov 10;20(3):e20230055. doi: 10.1590/1984-3143-AR2023-0055. eCollection 2023. Anim Reprod. 2023. PMID: 38025995 Free PMC article. Review.
References
-
- Gardner DK, Lane M. Ex vivo early embryo development and effects on gene expression and imprinting. Reprod Fertil Dev. 2005;17(3):361–70. - PubMed
-
- Brevini TA, Vassena R, Francisci C, Gandolfi F. Role of adenosine triphosphate, active mitochondria, and microtubules in the acquisition of developmental competence of parthenogenetically activated pig oocytes. Biol Reprod. 2005;72(5):1218–23. - PubMed
-
- Dumollard R, Duchen M, Carroll J. The role of mitochondrial function in the oocyte and embryo. Curr Top Dev Biol. 2007;77:21–49. - PubMed
Publication types
MeSH terms
Substances
Grants and funding
LinkOut - more resources
Full Text Sources
Other Literature Sources
Medical

