

Cytosolic and nuclear calcium signaling in atrial myocytes: IP3-mediated calcium release and the role of mitochondria
- PMID: 25891132
- PMCID: PMC4594594
- DOI: 10.1080/19336950.2015.1040966
Cytosolic and nuclear calcium signaling in atrial myocytes: IP3-mediated calcium release and the role of mitochondria
Abstract
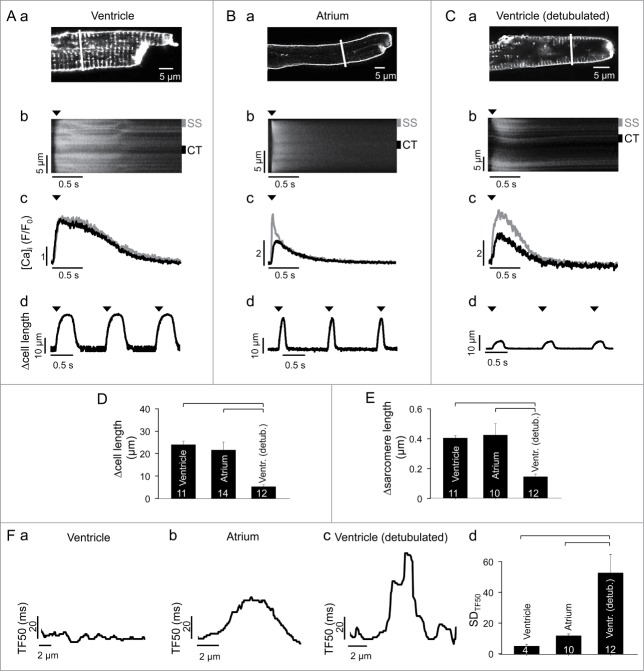
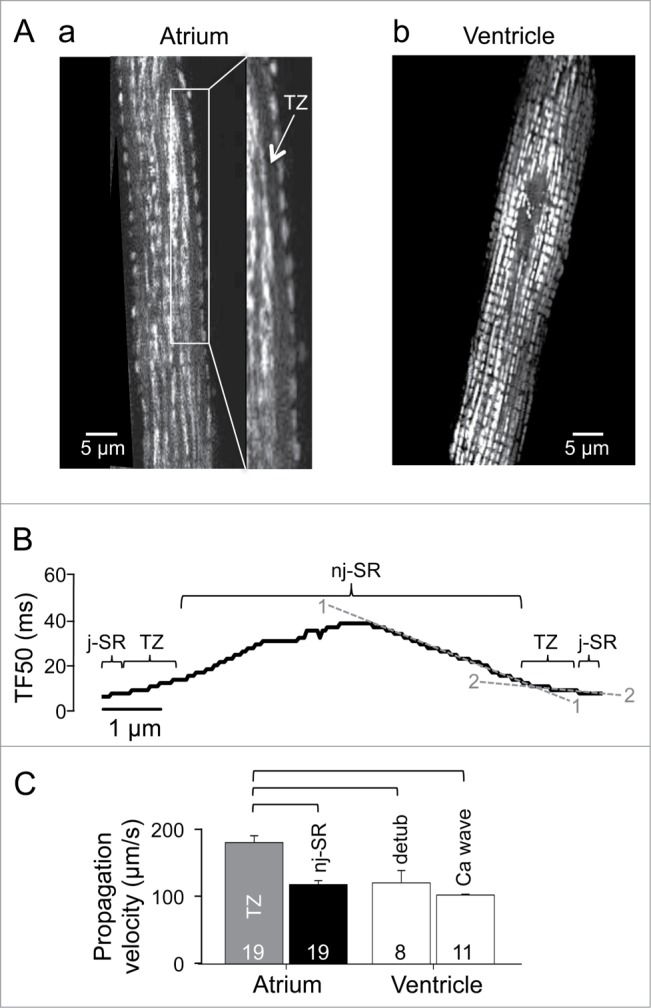
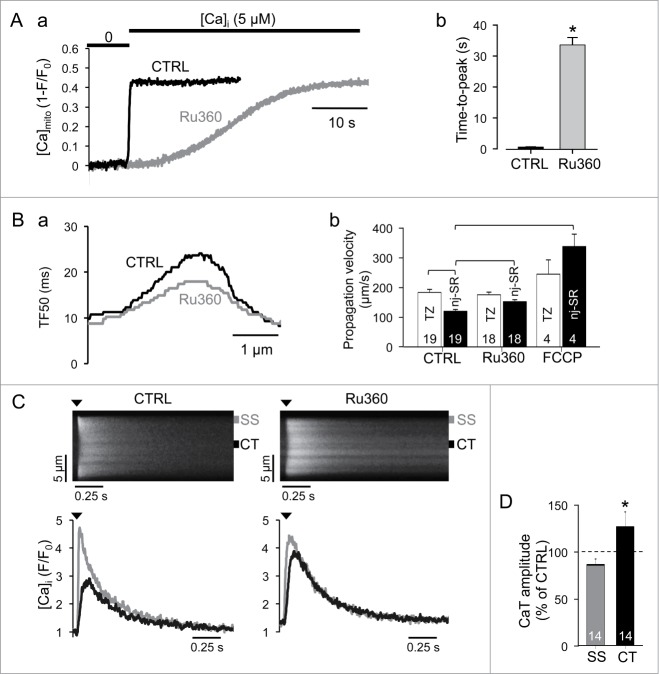
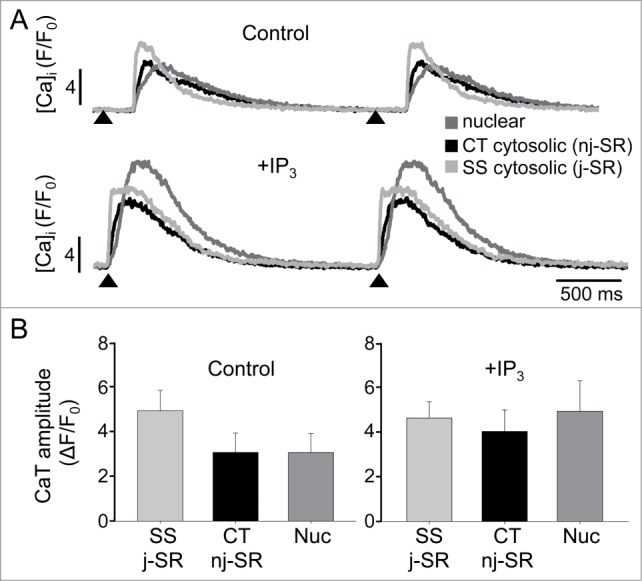
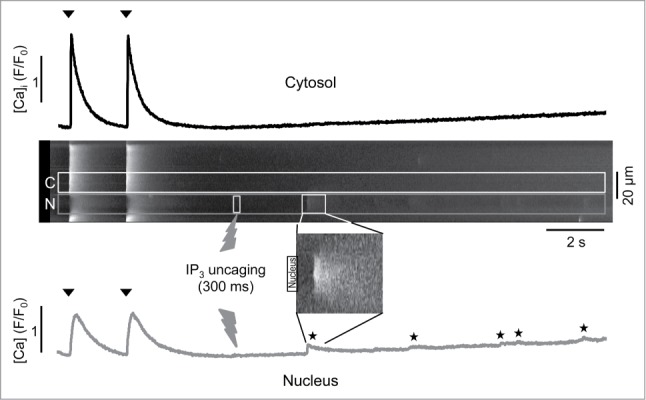
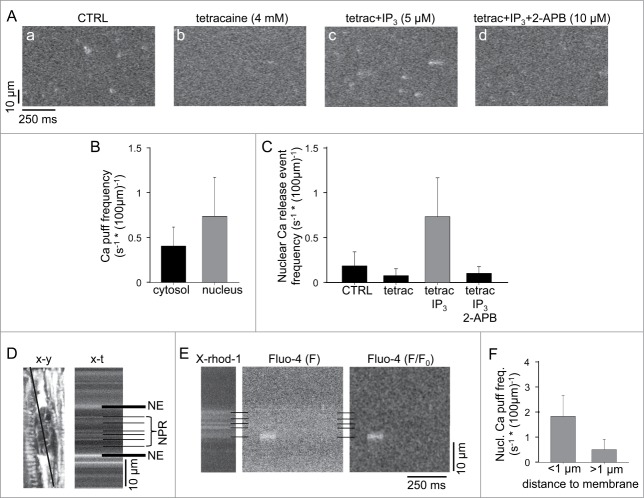
In rabbit atrial myocytes Ca signaling has unique features due to the lack of transverse (t) tubules, the spatial arrangement of mitochondria and the contribution of inositol-1,4,5-trisphosphate (IP3) receptor-induced Ca release (IICR). During excitation-contraction coupling action potential-induced elevation of cytosolic [Ca] originates in the cell periphery from Ca released from the junctional sarcoplasmic reticulum (j-SR) and then propagates by Ca-induced Ca release from non-junctional (nj-) SR toward the cell center. The subsarcolemmal region between j-SR and the first array of nj-SR Ca release sites is devoid of mitochondria which results in a rapid propagation of activation through this domain, whereas the subsequent propagation through the nj-SR network occurs at a velocity typical for a propagating Ca wave. Inhibition of mitochondrial Ca uptake with the Ca uniporter blocker Ru360 accelerates propagation and increases the amplitude of Ca transients (CaTs) originating from nj-SR. Elevation of cytosolic IP3 levels by rapid photolysis of caged IP3 has profound effects on the magnitude of subcellular CaTs with increased Ca release from nj-SR and enhanced CaTs in the nuclear compartment. IP3 uncaging restricted to the nucleus elicites 'mini'-Ca waves that remain confined to this compartment. Elementary IICR events (Ca puffs) preferentially originate in the nucleus in close physical association with membrane structures of the nuclear envelope and the nucleoplasmic reticulum. The data suggest that in atrial myocytes the nucleus is an autonomous Ca signaling domain where Ca dynamics are primarily governed by IICR.
Keywords: 2-APB, 2-aminoethoxydiphenyl borate; AP, action potential; CICR, Ca-induced Ca release; CRU, Ca release units; CT, central; CaT, Ca transient; ECC, excitation-contraction coupling; IICR; IICR, IP3R-induced Ca release; IP3; IP3R, Inositol-1,4,5-trisphosphate receptor; LCC, L-type Ca channels; MCU, mitochondrial Ca uniporter; NE, nuclear envelope; NFAT, nuclear factor of activated T cells; NPR, nucleoplasmic reticulum; RyR, ryanodine receptor; SR, sarcoplasmic reticulum; SS, subsarcolemmal; TF50, time to half-maximal amplitude; TZ, transition zone.; [Ca]i, cytosolic Ca concentration; [Ca]mito, mitochondrial Ca concentration; atria; excitation-contraction coupling; j-SR, junctional SR; mitochondria; nj-SR, non-junctional SR; nuclear calcium; t-tubule, transverse tubule.
Figures
Comment in
-
Atrial myocytes demonstrate the diversity of cardiac calcium signalling.Channels (Austin). 2015;9(5):219-20. doi: 10.1080/15384101.2015.1086203. Channels (Austin). 2015. PMID: 26542624 Free PMC article. No abstract available.
Similar articles
-
A novel mechanism of tandem activation of ryanodine receptors by cytosolic and SR luminal Ca2+ during excitation-contraction coupling in atrial myocytes.J Physiol. 2017 Jun 15;595(12):3835-3845. doi: 10.1113/JP273611. Epub 2017 Feb 1. J Physiol. 2017. PMID: 28028837 Free PMC article.
-
Inositol-1,4,5-trisphosphate induced Ca2+ release and excitation-contraction coupling in atrial myocytes from normal and failing hearts.J Physiol. 2015 Mar 15;593(6):1459-77. doi: 10.1113/jphysiol.2014.283226. Epub 2014 Dec 22. J Physiol. 2015. PMID: 25416623 Free PMC article.
-
Regional differences in spontaneous Ca2+ spark activity and regulation in cat atrial myocytes.J Physiol. 2006 May 1;572(Pt 3):799-809. doi: 10.1113/jphysiol.2005.103267. J Physiol. 2006. PMID: 16484302 Free PMC article.
-
Local calcium gradients during excitation-contraction coupling and alternans in atrial myocytes.J Physiol. 2003 Jan 1;546(Pt 1):19-31. doi: 10.1113/jphysiol.2002.025239. J Physiol. 2003. PMID: 12509476 Free PMC article. Review.
-
Calcium and IP3 dynamics in cardiac myocytes: experimental and computational perspectives and approaches.Front Pharmacol. 2014 Mar 6;5:35. doi: 10.3389/fphar.2014.00035. eCollection 2014. Front Pharmacol. 2014. PMID: 24639654 Free PMC article. Review.
Cited by
-
Atrial myocytes demonstrate the diversity of cardiac calcium signalling.Channels (Austin). 2015;9(5):219-20. doi: 10.1080/15384101.2015.1086203. Channels (Austin). 2015. PMID: 26542624 Free PMC article. No abstract available.
-
Dyssynchronous calcium removal in heart failure-induced atrial remodeling.Am J Physiol Heart Circ Physiol. 2016 Dec 1;311(6):H1352-H1359. doi: 10.1152/ajpheart.00375.2016. Epub 2016 Sep 30. Am J Physiol Heart Circ Physiol. 2016. PMID: 27694214 Free PMC article.
-
Crosstalk between FGF23- and angiotensin II-mediated Ca2+ signaling in pathological cardiac hypertrophy.Cell Mol Life Sci. 2018 Dec;75(23):4403-4416. doi: 10.1007/s00018-018-2885-x. Epub 2018 Jul 30. Cell Mol Life Sci. 2018. PMID: 30062428 Free PMC article.
-
A novel mechanism of tandem activation of ryanodine receptors by cytosolic and SR luminal Ca2+ during excitation-contraction coupling in atrial myocytes.J Physiol. 2017 Jun 15;595(12):3835-3845. doi: 10.1113/JP273611. Epub 2017 Feb 1. J Physiol. 2017. PMID: 28028837 Free PMC article.
-
The 'Reverse FDUF' Mechanism of Atrial Excitation-Contraction Coupling Sustains Calcium Alternans-A Hypothesis.Biomolecules. 2022 Dec 20;13(1):7. doi: 10.3390/biom13010007. Biomolecules. 2022. PMID: 36671392 Free PMC article.
References
-
- Huser J, Lipsius SL, Blatter LA.. Calcium gradients during excitation-contraction coupling in cat atrial myocytes. J Physiol 1996; 494 (Pt 3):641-51; PMID:8865063; http://dx.doi.org/10.1113/jphysiol.1996.sp021521 - DOI - PMC - PubMed
-
- Cordeiro JM, Spitzer KW, Giles WR, Ershler PE, Cannell MB, Bridge JH.. Location of the initiation site of calcium transients and sparks in rabbit heart Purkinje cells. J Physiol 2001; 531:301-14; PMID:11310434; http://dx.doi.org/10.1111/j.1469-7793.2001.0301i.x - DOI - PMC - PubMed
-
- Mackenzie L, Bootman MD, Berridge MJ, Lipp P.. Predetermined recruitment of calcium release sites underlies excitation-contraction coupling in rat atrial myocytes. J Physiol 2001; 530:417-29; PMID:11158273; http://dx.doi.org/10.1111/j.1469-7793.2001.0417k.x - DOI - PMC - PubMed
-
- Smyrnias I, Mair W, Harzheim D, Walker SA, Roderick HL, Bootman MD.. Comparison of the T-tubule system in adult rat ventricular and atrial myocytes, and its role in excitation-contraction coupling and inotropic stimulation. Cell Calcium 2010; 47:210-23; PMID:20106523; http://dx.doi.org/10.1016/j.ceca.2009.10.001 - DOI - PubMed
-
- Bootman MD, Higazi DR, Coombes S, Roderick HL.. Calcium signalling during excitation-contraction coupling in mammalian atrial myocytes. J Cell Sci 2006; 119:3915-25; PMID:16988026; http://dx.doi.org/10.1242/jcs.03223 - DOI - PubMed
Publication types
MeSH terms
Substances
Grants and funding
LinkOut - more resources
Full Text Sources
Other Literature Sources
Research Materials
Miscellaneous