. 2015 Apr 1:14:72.
doi: 10.1186/s12943-015-0345-x.

Hedgehog Acyltransferase as a target in estrogen receptor positive, HER2 amplified, and tamoxifen resistant breast cancer cells

Affiliations

Hedgehog Acyltransferase as a target in estrogen receptor positive, HER2 amplified, and tamoxifen resistant breast cancer cells

Armine Matevossian et al. Mol Cancer. .

Abstract

Background: Hedgehog acyltransferase (Hhat) catalyzes the transfer of the fatty acid palmitate onto Sonic Hedgehog (Shh), a modification that is essential for Shh signaling activity. The Shh signaling pathway has been implicated in the progression of breast cancer.

Methods: To determine the functional significance of Hhat expression in breast cancer, we used a panel of breast cancer cell lines that included estrogen receptor (ER) positive, HER2 amplified, triple negative, and tamoxifen resistant cells. We monitored both anchorage dependent and independent proliferation of these cells following depletion of Hhat with lentiviral shRNA and inhibition of Hhat activity with RU-SKI 43, a small molecule inhibitor of Hhat.

Results: Depletion of Hhat decreased anchorage-dependent and anchorage-independent proliferation of ER positive, but not triple negative, breast cancer cells. Treatment with RU-SKI 43 also reduced ER positive cell proliferation, whereas a structurally related, inactive compound had no effect. Overexpression of Hhat in ER positive cells not only rescued the growth defect in the presence of RU-SKI 43 but also resulted in increased cell proliferation in the absence of drug. Furthermore, depletion or inhibition of Hhat reduced proliferation of HER2 amplified as well as tamoxifen resistant cells. Inhibition of Smoothened had no effect on proliferation, indicating that canonical Shh signaling was not operative. Moreover, Hhat regulated the proliferation of both Shh responsive and non-responsive ER positive cells, suggesting a Shh independent function for Hhat.

Conclusions: These data suggest that Hhat plays a critical role in ER positive, HER2 amplified, and hormone resistant breast cancer proliferation and highlights the potential promise of Hhat inhibitors for therapeutic benefit in breast cancer.


Figures
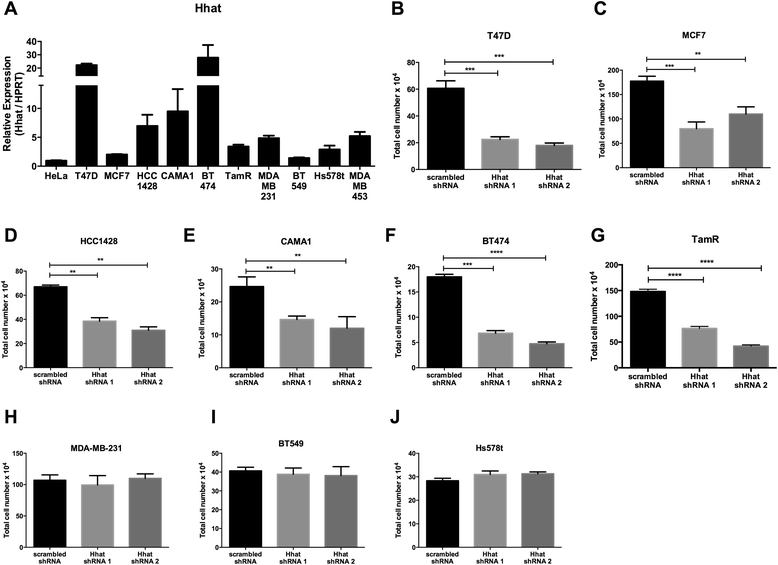
Figure 1
Figure 1
Hhat depletion reduces proliferation of ER positive breast cancer cells. A, Hhat mRNA expression in indicated breast cancer cell lines and a control cervical cancer (HeLa) cell line, was measured by qRT-PCR. Hhat expression is shown relative to the expression in HeLa cells, which is set to 1. Bars represent mean ± SD (n = 3). Experiments were performed twice in triplicate. B-J, Total cell number at day 6 for (B) T47D, (C) MCF7, (D) HCC1428, (E) CAMA-1, (F) BT474, (G) TamR, (H) MDA-MB-231, (I) BT549, and (J) Hs578t. Cells stably expressing scrambled or Hhat shRNAs were seeded at 5-7 × 104 cells/well, depending on cell type, in 6-well plates and cell numbers were quantified on day 6. For panels B-J, Bars represent mean ± SD (n = 3). Three independent experiments were performed in duplicate using cells at three different passages. *P ≤ 0.05; **P ≤ 0.01; ***P ≤ 0.001; ****P ≤ 0.0001; Student’s t test.
Figure 2
Figure 2
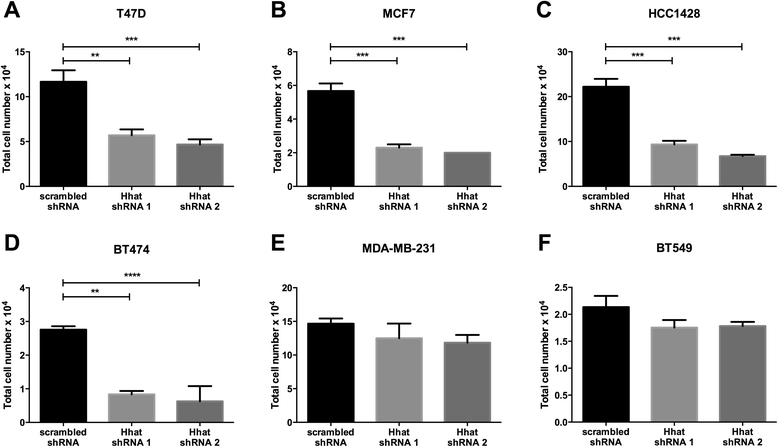
Hhat depletion reduces anchorage independent proliferation of ER positive cells. A-F, indicated breast cancer cell lines stably expressing scrambled or Hhat shRNAs were seeded at 1-2 × 104 cells/well in 24-well ultra-low adherence plates, and cell numbers were quantified 14 days later. Bars represent mean ± SD (n = 3) for all panels. Three independent experiments were performed in duplicate using cells at three different passages. *P ≤ 0.05; **P ≤ 0.01; ***P ≤ 0.001; ****P ≤ 0.0001; Student’s t test.
Figure 3
Figure 3
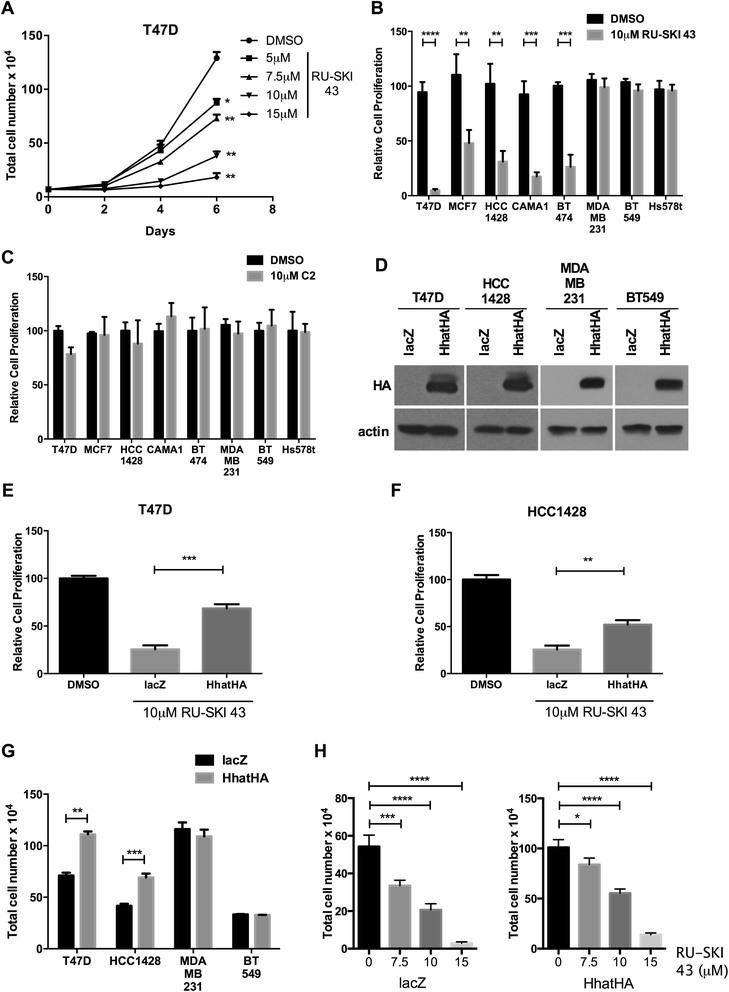
Hhat inhibition with RU-SKI 43 results in decreased proliferation of ER positive cells. A, T47D cells were seeded at 7 × 104 cells/well in 6-well plates. 24 hrs post seeding, cells were treated with either DMSO or the indicated concentrations of RU-SKI 43. Media was changed every 48 hrs and cell numbers were quantified 2, 4, and 6 days post treatment. B, indicated cell lines were seeded at 5-7 × 104 cells/well in 6-well plates. 24 hrs post seeding, cells were treated with either DMSO or 10 μM RU-SKI 43. Cell numbers were quantified 6 days post treatment and expressed relative to growth in DMSO (100 x (RU-SKI 43/DMSO)). C, indicated cell lines were seeded at 5-7 × 104 cells/well in 6-well plates. 24 hrs post seeding, cells were treated with either DMSO or 10 μM C2. Cell numbers were quantified 6 days post treatment and expressed relative to growth in DMSO. D, cell lysates from T47D, HCC1428, MDA-MB-231, and BT549 cells stably expressing LacZ or HhatHA were analyzed directly by Western blotting. E-F, (E) T47D and (F) HCC1428 cells stably expressing LacZ or HhatHA were seeded at 7 × 104 cells/well in 6-well plates and grown in media containing DMSO or 10 μM RU-SKI 43. Cell numbers were quantified on day 6 and expressed relative to DMSO treated cells. The increase in proliferation between Hhat and LacZ overexpressing cells in the presence of RU-SKI 43 is 176% and 106%, for T47D and HCC1428 respectively. G, growth curves for T47D, HCC1428, MDA-MB-231, and BT549 cells stably expressing LacZ or HhatHA. Cells were seeded at 5-7 × 104 cells/well and cell numbers were quantified on day 6. The increase in proliferation in response to overexpressing Hhat in untreated cells is 56% and 61%, for T47D and HCC1428 respectively. H, T47D cells overexpressing lacZ or HhatHA were cultured in the presence of DMSO or the indicated concentrations of RU-SKI 43. Cells numbers were quantified on day 6. Bars represent mean ± SD (n = 3) for all panels. Three independent experiments were performed in duplicate using cells at three different passages. *P ≤ 0.05; **P ≤ 0.01; ***P ≤ 0.001; ****P ≤ 0.0001; Student’s t test.
Figure 4
Figure 4
RU-SKI 43 does not alter localization or activation of ERα. A, MCF7 cells were cultured in the presence of DSMO or 10 μM RU-SKI 43 for 4 h. Cells were fixed and stained with anti-ERα. Three independent experiments were performed using cells at three different passages. B-C, MCF7 (B) or TamR (C) cells were treated with DSMO or 10 μM RU-SKI 43 for 4 h. Cells were treated with ethanol or 17β-estradiol for 30 minutes prior to lysis. Cell lysates were analyzed directly by Western blotting with indicated antibodies. Three independent experiments were performed in duplicate using cells at three different passages.
Figure 5
Figure 5
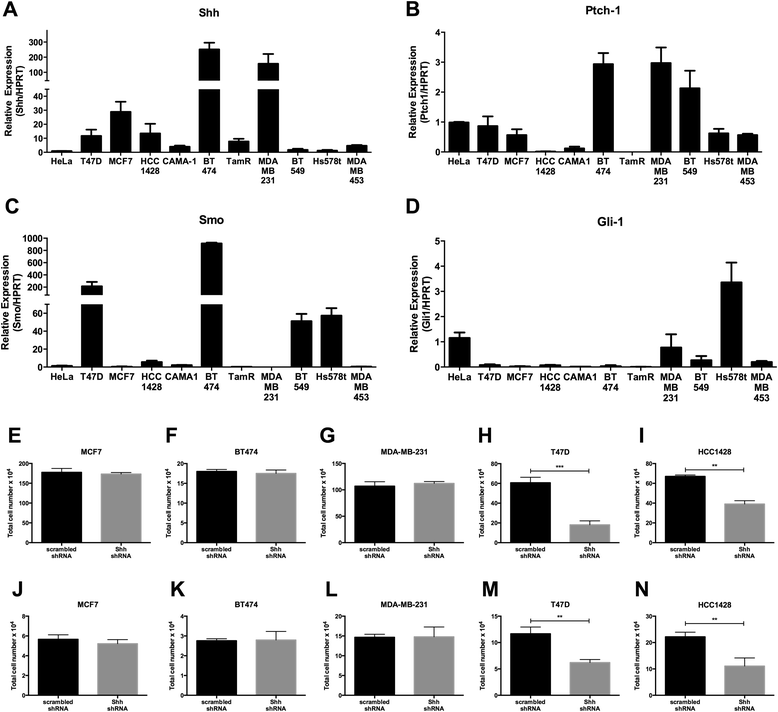
Analysis of Shh signaling pathway components in breast cancer cells. A-D, expression of (A) Shh, (B) Ptch-1, (C) Smo, and (D) Gli-1 mRNAs in indicated breast cancer cell lines and a control cervical cancer (HeLa) cell line, was measured by qRT-PCR. Expression of individual genes is shown relative to the expression in HeLa cells, which is set to 1. Bars represent mean ± SD (n = 3). Experiments were performed twice in triplicate. E-I, indicated breast cancer cells stably expressing scrambled or Shh shRNAs were seeded at 5-7 × 104 cells/well, depending on cell type, in 6-well plates and cell numbers were quantified on day 6. J-N, indicated breast cancer cell lines stably expressing scrambled or Shh shRNAs were seeded at 1-2 × 104 cells/well in 24-well ultra-low adherence plates, and cell numbers were quantified 14 days later. For E-N, bars represent mean ± SD (n = 3). Three independent experiments were performed in duplicate using cells at three different passages. *P ≤ 0.05; **P ≤ 0.01; ***P ≤ 0.001; ****P ≤ 0.0001; Student’s t test.
Figure 6
Figure 6
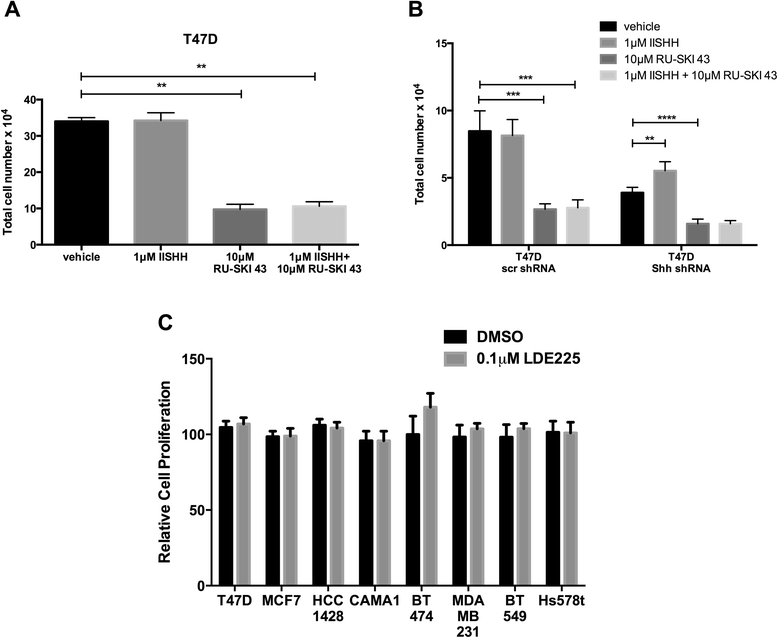
Evidence for non-canonical Shh signaling in breast cancer cells. A, T47D cells were cultured in the presence of 1 μM Shh(CII24), 10 μM RU-SKI 43, or both for 6 days. Cell numbers were quantified and normalized to vehicle treated cells (100 x (drug/vehicle)). Bars represent mean ± SD (n = 3). Experiments were performed twice in triplicate. *P ≤ 0.05; **P ≤ 0.01; ***P ≤ 0.001; ****P ≤ 0.0001; Student’s t test. B, T47D cells were transduced with either a control scrambled or Shh shRNA expressing lentivirus and selected in puromycin. Cells were then cultured in the presence of 1 μM Shh(CII24), 10 μM RU-SKI 43, or both for 6 days. Cell numbers were quantified and normalized to vehicle treated cells (100 x (drug/vehicle)). Bars represent mean ± SD (n = 3). Experiments were performed twice in triplicate. **P ≤ 0.01; ***P ≤ 0.001; ****P ≤ 0.0001; Student’s t test. C, indicated cell lines were seeded at 5-7 × 104 cells/well in 6-well plates. 24 hrs post seeding, cells were treated with either DMSO or 0.1 μM LDE225. Cell numbers were quantified 6 days post treatment and expressed relative to growth in DMSO. Bars represent mean ± SD (n = 3). Three independent experiments were performed in triplicate using cells at three different passages.
Figure 7
Figure 7
Hhat inhibition reduces proliferation of HER2 amplified cells. A-C, BT474 (A), MDA-MB-453 (B), and SK-BR3 (C) cells were cultured for 6 days in the presence of DMSO, RU-SKI 43 alone or in combination with indicated concentrations of lapatinib. Cell numbers were quantified and normalized to vehicle treated cells (100 x (drug/vehicle). Bars represent mean ± SD (n = 3) for all panels. Each experiment was performed using three separate passages of cells in triplicate. *P ≤ 0.05; **P ≤ 0.01; ***P ≤ 0.001; ****P ≤ 0.0001; Student’s t test.
Figure 8
Figure 8
Combined inhibition of Hhat and PI3K/mTOR effectively reduces breast cancer cell proliferation. A-C, T47D (A), MCF7 (B), and BT474 (C) cells were cultured for 6 days in the presence of 10 μM RU-SKI 43 alone or in combination with 10 μM LY294002 or 10nM rapamycin. Cell numbers were quantified and normalized to DMSO treated cells (100 x (drug/DMSO)). Bars represent mean ± SD (n = 3) for all panels. Three independent experiments were performed in duplicate using cells at three different passages. *P ≤ 0.05; **P ≤ 0.01; ***P ≤ 0.001; ****P ≤ 0.0001; Student’s t test.
Figure 9
Figure 9
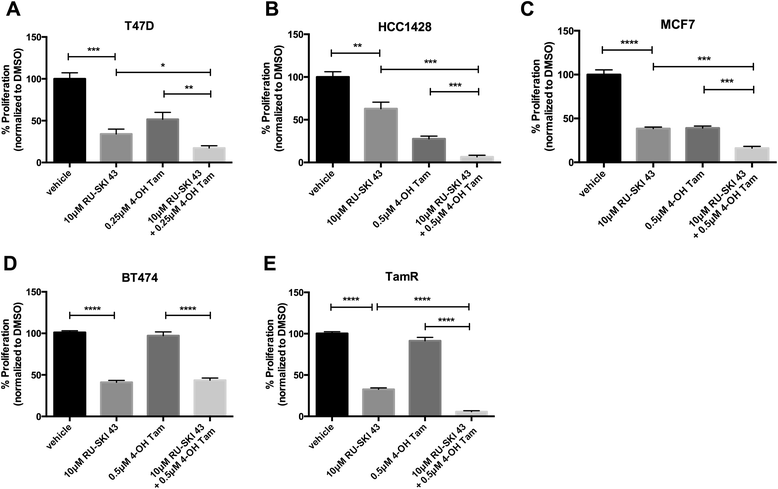
Tamoxifen resistant cells are sensitive to Hhat inhibition. A-D, T47D (A), HCC1428 (B), MCF7 (C), BT474 (D), and TamR (E) cells were cultured for 6 days in the presence of vehicle, 10 μM RU-SKI 43 alone or in combination with indicated concentrations of 4-hydroxytamoxifen (4-OH Tam). Cell numbers were quantified and normalized to vehicle treated cells (100 x (drug/vehicle). Bars represent mean ± SD (n = 3) for all panels. Three independent experiments were performed in duplicate using cells at three different passages. *P ≤ 0.05; **P ≤ 0.01; ***P ≤ 0.001; ****P ≤ 0.0001; Student’s t test.

Similar articles

Cited by

References

    1. Kamangar F, Dores GM, Anderson WF. Patterns of cancer incidence, mortality, and prevalence across five continents: defining priorities to reduce cancer disparities in different geographic regions of the world. J Clin Oncol. 2006;24(14):2137–50. doi: 10.1200/JCO.2005.05.2308. - DOI - PubMed
    1. Sorlie T, Wang Y, Xiao C, Johnsen H, Naume B, Samaha RR, et al. Distinct molecular mechanisms underlying clinically relevant subtypes of breast cancer: gene expression analyses across three different platforms. BMC Genomics. 2006;7:127. doi: 10.1186/1471-2164-7-127. - DOI - PMC - PubMed
    1. Sotiriou C, Neo SY, McShane LM, Korn EL, Long PM, Jazaeri A, et al. Breast cancer classification and prognosis based on gene expression profiles from a population-based study. Proc Natl Acad Sci U S A. 2003;100(18):10393–8. doi: 10.1073/pnas.1732912100. - DOI - PMC - PubMed
    1. Rouzier R, Perou CM, Symmans WF, Ibrahim N, Cristofanilli M, Anderson K, et al. Breast cancer molecular subtypes respond differently to preoperative chemotherapy. Clin Cancer Res. 2005;11(16):5678–85. doi: 10.1158/1078-0432.CCR-04-2421. - DOI - PubMed
    1. Early Breast Cancer Trialists’ Collaborative G Effects of chemotherapy and hormonal therapy for early breast cancer on recurrence and 15-year survival: an overview of the randomised trials. Lancet. 2005;365(9472):1687–717. doi: 10.1016/S0140-6736(05)66544-0. - DOI - PubMed

Publication types

MeSH terms