. 2014 Dec 1;9(6):759-784.
doi: 10.1016/j.nantod.2014.12.002.

Nanotopographical Surfaces for Stem Cell Fate Control: Engineering Mechanobiology from the Bottom

Affiliations

Nanotopographical Surfaces for Stem Cell Fate Control: Engineering Mechanobiology from the Bottom

Weiqiang Chen et al. Nano Today. .

Abstract

During embryogenesis and tissue maintenance and repair in an adult organism, a myriad of stem cells are regulated by their surrounding extracellular matrix (ECM) enriched with tissue/organ-specific nanoscale topographical cues to adopt different fates and functions. Attributed to their capability of self-renewal and differentiation into most types of somatic cells, stem cells also hold tremendous promise for regenerative medicine and drug screening. However, a major challenge remains as to achieve fate control of stem cells in vitro with high specificity and yield. Recent exciting advances in nanotechnology and materials science have enabled versatile, robust, and large-scale stem cell engineering in vitro through developments of synthetic nanotopographical surfaces mimicking topological features of stem cell niches. In addition to generating new insights for stem cell biology and embryonic development, this effort opens up unlimited opportunities for innovations in stem cell-based applications. This review is therefore to provide a summary of recent progress along this research direction, with perspectives focusing on emerging methods for generating nanotopographical surfaces and their applications in stem cell research. Furthermore, we provide a review of classical as well as emerging cellular mechano-sensing and -transduction mechanisms underlying stem cell nanotopography sensitivity and also give some hypotheses in regard to how a multitude of signaling events in cellular mechanotransduction may converge and be integrated into core pathways controlling stem cell fate in response to extracellular nanotopography.

Keywords: Biomaterials; Mechanobiology; Nanotopography; Stem cell; Tissue engineering and regenerative medicine.


Figures
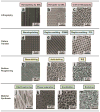
Figure 1
Figure 1. Fabrication of nanotopographic surfaces
Lithographic patterning. (a) A nanogrooved silicon substrates with 70 nm wide ridge and 400 nm pitch fabricated by EBL [36]. Reproduced with permission [36]. Copyright 2003, Biologists Ltd. (b) Regular (left) and random (right) arrays of 120-nm-diameter, 100-nm-deep nanopits on silicon substrates fabricated by EBL [37]. Reproduced with permission [37]. Copyright 2007, Nature Publishing Group. (c) A nanotopographic substrate fabricated by the self-assembly of 110-nm-diameter nanoparticles [54]. Reproduced with permission [54]. Copyright 2003, IEEE. Pattern transfer. (d) Nanostructured polyurethane acrylate (PUA) surface with a patterned array of nanopillars fabricated by nanoimprinting from a silicon master. The diameter of the pillars was 300 nm and the gap between the pillars was 900 nm [68]. Reproduced with permission [68]. Copyright 2013, American Chemical Society. (e) PDMS nanograting produced by replica molding from a PMMA master [69]. Reproduced with permission [69]. Copyright 2005, Elsevier. (f) AFM scan of a PCL surface with nanopits produced by replica molding from a pillared quartz master [38]. Reproduced with permission [38]. Copyright 2002, IEEE. Surface roughening. (g) Nanostructured PCL with feature dimensions of 50–100 nm fabricated by NaOH etching [77]. Reproduced with permission [77]. Copyright 2003, Wiley Periodicals, Inc. (h) Nanoroughened Ti surface (surface roughness Ra = 0.87 ± 0.03 μm) fabricated by acid etching in hydrochloric acid/sulfuric acid [78]. Reproduced with permission [78]. Copyright 1998, John Wiley & Sons, Inc. (i) Glass surfaces with surface roughness of 100 nm fabricated by RIE [80]. Reproduced with permission [80]. Copyright 2013, American Chemical Society. Material synthesis. (j) Aligned nanofibrous hydroxybutyl chitosan (HBC) scaffolds fabricated by electrospinning [104]. Reproduced with permission [104]. Copyright 2007, WILEY-VCH Verlag GmbH & Co. (k) Nanofibrous PLLA matrix with an average fiber diameter of 148 ± 21 nm and a porosity of 92.9% fabricated by phase separation [114]. Reproduced with permission [114]. Copyright 2009, Mary Ann Liebert, Inc. (l) Self-aligned TiO2 nanotubes with a diameter of 100 nm generated by anodizing Ti sheets under a potential of 20 V [139]. Reproduced with permission [139]. Copyright 2009, National Academy of Sciences of the USA. (m) Nanostructured alumina substrates with 24-nm grain-like structures fabricated by sintering [146]. Reproduced with permission [146]. Copyright 2008, Wiley Periodicals, Inc.
Figure 2
Figure 2. Nanotopography regulates MSC lineage
(a) TiO2 nanotube diameter directs MSC osteogenic differentiation [14]. The top row presents SEM images of highly ordered TiO2 nanotubes of small (15 nm; left) and large (100 nm; right) pore sizes. The bottom row presents immunofluorescence images of cells with osteocalcin staining in red and F-actin staining is in green on 15 and 100 nm nanotubes after 2 weeks in culture in osteoblast differentiation medium. Osteogenic differentiation occurred 15 nm nanotubes as seen by osteocalcin staining but rarely detectable on 100 nm nanotubes. Reproduced with permission [14]. Copyright 2007, American Chemical Society. (b) Using of fibrin nanofiber and PLGA microfiber composite scaffold for human MSC differentiation toward myocardial lineage [148]. The top row presents SEM micrographs of PLGA–fibrin electrospun membrane at different magnification. The bottom row presents confocal microscopy images of MSCs grown on PLGA–fibrin composite fibers after 14 days of induction of cardiac differentiation expressing of cardiac specific markers including cardiac troponin, α-sarcomeric actinin, tropomyosin as indicated. Reproduced with permission [148]. Copyright 2013, Mary Ann Liebert, Inc. (c) Nanofibrous scaffold for human MSC chondrogenesis [97]. The left column shows SEM images of nanofibrous surface (top) produced by the electrospinning process showing random orientation of ultra-fine fibers with an diameter ranging from 500 to 900 nm and MSCs (bottom) with round, ECM-embedded chondrocyte-like cells on the surface after 21 days culture in the presence of TGF-β1. The middle and right columns present the histological analysis of human MSC cultured on nanofibrous surface in a chondrogenic medium supplemented with TGF-β1 for 21 days. Sections from the upper and lower portions of the three-dimensional constructs were stained with H&E (middle column) and Alcian blue (right column). H&E staining showed flat fibroblast-like cells on the top zone (bracket, *), round chondrocyte-like cells embedded in lacunae (arrows) in the middle zone (bracket, **), and small, flat cells at the bottom zone (bracket, ***). Alcian blue staining showed the presence of sulfated proteoglycan-rich ECM in the construct. Reproduced with permission [97]. Copyright 2005, Elsevier. (d) Nanograting surfaces induce neuroal transdifferetiation of MSCs [75]. SEM (top) and immunofluorescence (bottom) images of human MSCs cultured on nanograting and unpatterned PDMS as indicated. In the immunofluorescence images, cells were differentiated for 14 days in the presence of retinoic acid and were stained with neuronal marker Tuj1in red and GFAP in green. Reproduced with permission [75]. Copyright 2007, Elsevier.
Figure 3
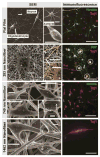
Figure 3. Nanotopography regulates NSC lineage[101]
SEM (left) and immunofluorescence (right) images of rat NSCs cultured on various substrates (laminin-coated PES films (flat film), 283-nm, 749-nm, 1452-nm nanofibers) in the presence of 1 mM retinoic acid and 1% fetal bovine serum for 5 days. For the immunofluorescence images, the cells are stained with RIP (oligodendrocyte marker), Tuj-1 (neuronal marker) or nestin (neural progenitor marker) as indicted. Scale bars for SEM images are 10 μm, and for inserts are 2 μm. The arrows in the SEM images indicate cell attachment to nanofibers. Scale bar for all immunofluorescence images with are 100 μm. Circled cells on 283-nm fiber mesh are cells stained double positive for RIP and Tuj1. Reproduced with permission [101]. Copyright 2009, Elsevier.
Figure 4
Figure 4. Nanotopography regulates ESC self-renewal
(a–b) Polymethylglutarimide (PMGI) nanofibrous surfaces serve as a cellular scaffold for maintaining self-renewal of mouse ESCs without MEFs [103]. (a) Bright field (top) and fluorescence images (middle) of R1-Oct4-EGFP mouse ESCs cultured on nanofibers at three different densities (i.e., low, medium and high) and controls. Bottom panels show the density of PMGI nanofibers doped with Rhodamine 6G for visualization. (b) The number of colonies within 5 mm2 after culturing for 3 days on various substrates. Data are presented as mean ± SD of three independent experiments. (*p < 0.001, **p < 0.01, n>3). Reproduced with permission [103]. Copyright 2012 Springer. (c–d) Nanotopographical surface formed from silica colloidal crystal microspheres (SCC) maintain the expression of mouse ESC self-renewal in comparison to flat glass [57]. (c) SEM images of SCC substrates with particles of 124 ± 4 nm, 430 ± 4 nm, and 602 ± 12 nm diameter, respectively, showing their ordered face-centered cubic packing. Quantitative PCR showing (d) Nanog, a stem cell marker was less down-regulated on the SCC substrates than on glass cover slips; N= 3. Reproduced with permission [57]. (e–f) Smooth vitronectin-coated glass surfaces supported cell adhesion, rapid cell proliferation, and long-term self-renewal of human ESCs without using mouse MEF feeder cells [80]. (e) Representative SEM images of glass surfaces (top) and immunofluorescence images of human ESCs (bottom) plated on glass surfaces with their root-mean-square (rms) nanoroughness Rq indicated. In the immunofluorescence images, the cells were co-stained for Oct3/4 (red) and nuclei (DAPI; blue). (f) Percentage of Oct3/4+ human ESCs on the glass substrates with different levels of nanoroughness as indicated, after culture for 7 days. Error bars represent (standard error of the mean (SE, n = 3). ns (> 0.05) and ** (p < 0.01) (Student’s t-test). Adapted from [80].
Figure 5
Figure 5. Nanotopography regulates ESCs toward neural lineage
(a–c) The differentiation of mouse ESCs on electrospun nanofibrous surfaces into neural lineages [100]. (a) SEM images of aligned (top) and randomly oriented (bottom) PCL nanofibers prepared by electrospinning. (b) Representative immunofluorescence images of differentiated mouse ESCs on aligned (left) and random (right) PCL nanofibers for 14 days. The mouse ESCs expressed GFP in green color (top) and stained in red color with neuron marker Tuj1 (middle), the bottom images show and superimposed image of the top and middle images in the same region. (c) Cell phenotype analysis of mouse EBs cultured on PCL nanofibrous scaffolds for 14 days. The markers examined were SSEA-1 (stage specific embryonic antigen, for undifferentiated mouse ES cells), nestin (for neural precursors), Tuj1 (β-tubulin III, for neurons), O4 (for oligodendrocytes), and GFAP (glia fibrillary acidic protein, for astrocytes). # indicates p < 0.05 for markers compared with embryonic stem cells. + indicates p < 0.05 for markers compared with embryoid bodies. * Indicates p < 0.05 for markers compared with random PCL fibers. Reproduced with permission [100]. Copyright 2009, Elsevier. (d) Direct human ESC neural differentiation on collagen/CNT matrix [167]. AFM characterization of the surface structures, cell morphology, and nestin expression of human ESCs after cultured in the medium of spontaneous differentiation for three days on gelatin (top), collagen (middle) and collagen/CNT (bottom) matrices. Inset Image size in the AFM images: inset 2×2 μm2. The yellow arrows in the staining images indicate the coarse alignments of the cells. Reproduced with permission [167]. Copyright 2009, Elsevier. (e) Direct differentiation of human ESCs into selective neurons on nanoscale ridge/groove pattern arrays [168]. The left column are representative SEM images of a bird’s eyes view (left top) and a cross-section (left middle) of 350-nm ridge/groove pattern arrays (spacing of 350 nm, height of 500 nm) and a SEM image showing human ESCs on the 350-nm nanoscale ridge/groove pattern arrays (left bottom). The right column are representative immunofluorescence images of human ESCs stained with nuclei, neural and glial markers as indicated after cultured for 10 days on the 350-nm ridge/groove pattern arrays. Differentiated hESCs stained positively for HuC/D (human neuronal protein: RNA-binding protein) and MAP2 (mature neuronal marker: microtubule-associated protein 2), but were not for GFAP (intermediate filament proteins of mature astrocytes: glial fibrillary acidic protein). This suggests that hESCs differentiated into mature neurons without differentiation into a glial lineage such as astrocytes. Reproduced with permission [168]. Copyright 2010, Elsevier.
Figure 6
Figure 6. Nanotopography regulates ESCs toward osteogenic lineage
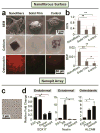
(a–b) Enhancing osteogenic differentiation of mouse ESCs by nanofibers matrix [114]. (a) SEM micrographs (top) of mouse ESCs after 12 hrs under differentiation conditions, calcium staining (middle) and immunofluorescence staining (bottom) images of late bone differentiation (Osteocalcin) marker expression after 26 days under osteogenic differentiation conditions on nanofibrous matrix, solid films, and gelatin-coated tissue culture plastic (Control). Quantitative PCR of osteogenic markers (b) osteocalcin (top) and bone sialoprotein (BSP; bottom) RNAs isolated from cells on nanofibrous matrix, solid films, and gelatin-coated tissue culture plastic (Control) after 26 days of culture under osteogenic differentiation conditions. Reproduced with permission [114]. Copyright 2009, Mary Ann Liebert, Inc. (c–d) Nanopit surfaces augment mesenchymal differentiation of Human ESCs [162]. (c) SEM image of polycarbonate nanopit substrate. Nanopits of 120 nm diameter and 100 nm depth are arranged in a near square geometry with centre-centre spacing 300 nm ± 50 nm. (d) Expression of endodermal (SOX17), ectodermal (Nestin) and osteogenic progenitor (ALCAM) markers was assessed by qPCR for self-renewing human ESCs, EBs and human ESCs seeded onto planar or nanopit substrates in basal media for 14 days (n = 6). Nanopit substrates do not direct endodermal or ectodermal differentiation, but significantly enhanced osteoblastic differentiation. * indicates p < 0.05, ** indicates p < 0.01. Reproduced with permission [162]. Copyright 2013, Wiley-VCH (Germany).
Figure 7
Figure 7. Sensitivity of integrin clustering and FA morphogenesis to nanotopography
(a) (Top panel) Immunofluorescence images showing that TiO2 nanotube arrays of tube diameter 15 nm promoted the growth of large FAs and prominent F-actin stress fibers in MSCs; while larger tube diameter (100 nm) strongly inhibited FA maturation and resulted in diffusive actin staining. (Middle and bottom panels) SEM immunogold staining images showing that the density of FAs (middle) and β1 integrin clustering was much higher on nanotube arrays of 15 nm diameter TiO2 nanotubes. Reproduced with permission [14]. Copyright 2007, American Chemical Society. (b) Immunofluorescence images showing decreased FA sizes in human ESCs cultured on nanotopographical surfaces of 100 nm roughness features. Adapted with permission from [80]. Copyright 2012, American Society of Chemistry. (c) (Top panel) SEM images of nanopit arrays of disorder and ordered arrangements. (Bottom panel) Immunofluorescence images showing that larger and more elongated FAs formed on disordered nanopit arrays. Adapted from [186]. Copyright 2014, Wiley.
Figure 8
Figure 8. Potential mechanotransduction mechanisms in cellular responsiveness to nanotopographical biomaterials
(left) On pro-integrin clustering surfaces, which could be either smooth or composed of certain nanotopographical features, integrins could undergo free lateral recruitment and ligation with ECM proteins, and thus cluster and form mature, stable FAs together with the unhindered recruitment of FA adaptor proteins. This process initiates signals from plasma membrane, enhancing FAK/ERK signaling, as well as RhoA activity, which further promoting CSK contractility (through RhoA/ROCK) as well as stress fiber formation. CSK contractility, as an important mediator of mechanotransduction, could provide positive feedback to the FAs. In addition, CSK force could also induce phosphorylation of emerin, a nuclear envelope-located protein, and thus initiate nuclear mechanotransduction through enhanced nuclear actin polymerization and subsequent nuclear translocation of MAL, a transcription cofactor of SRF. In the meantime, prominent stress fibers formed in cells on smooth surfaces could promote the nuclear translocation of YAP/TAZ, a transcription co-factor of TEAD. Nuclear shuttling of SMAD 2/3 (R-SMAD), the transcription factor downstream of TGFβ signaling, is also controlled by YAP/TAZ translocation. (right) On surfaces containing anti-integrin clustering nanotopographical cues, although integrins could still freely diffuse laterally, the nanoscale surface features restrict the ligation of additional integrins to the ECM proteins, which further restrict successful recruitment and clustering of integrins and other FA proteins, resulting in smaller, less stable FAs. Such process disrupts the activation of RhoA and therefore limits the formation of stress fibers and might induce high cytoplasmic G-actin level, which inhibits the nuclear translocation of MAL and thus SRF signaling. Unlike nanotopographical surfaces that promote integrin clustering, anti-integrin clustering surfaces containing different types of nanoscale structures could not sustain FAK activation and downstream signaling. Last but not the least, compromised stress fibers and FAs on nanotopographical substrates could potentially intersect with Hippo/YAP pathway by enhancing YAP/TAZ phosphorylation via either Lats-dependent or –independent mechanisms, resulting in cytoplasmic retention of YAP/TAZ.

Similar articles

Cited by

References

    1. Daley GQ, Scadden DT. Cell. 2008;132:544–548. - PubMed
    1. Nishikawa SI, Jakt LM, Era T. Nat Rev Mol Cell Biol. 2007;8:502–507. - PubMed
    1. Jopling C, Boue S, Belmonte JCI. Nat Rev Mol Cell Biol. 2011;12:79–89. - PubMed
    1. Singec I, Jandial R, Crain A, Nikkhah G, Snyder EY. Annu Rev Cell Dev Biol. 2007;58:313–328. - PubMed
    1. O’Brien LE, Bilder D. Annu Rev Cell Dev Biol. 2013;29:107–136. - PMC - PubMed