

Survey of protein-DNA interactions in Aspergillus oryzae on a genomic scale
- PMID: 25883143
- PMCID: PMC4482085
- DOI: 10.1093/nar/gkv334
Survey of protein-DNA interactions in Aspergillus oryzae on a genomic scale
Abstract
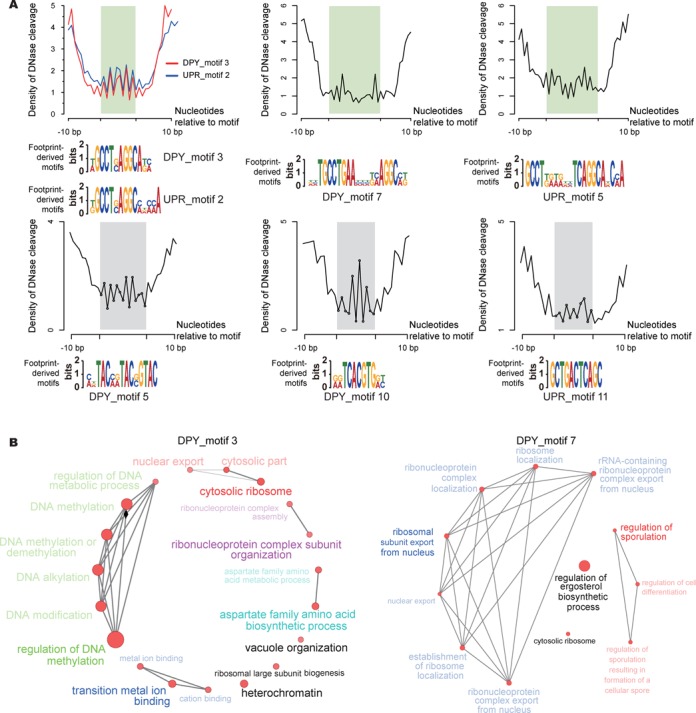
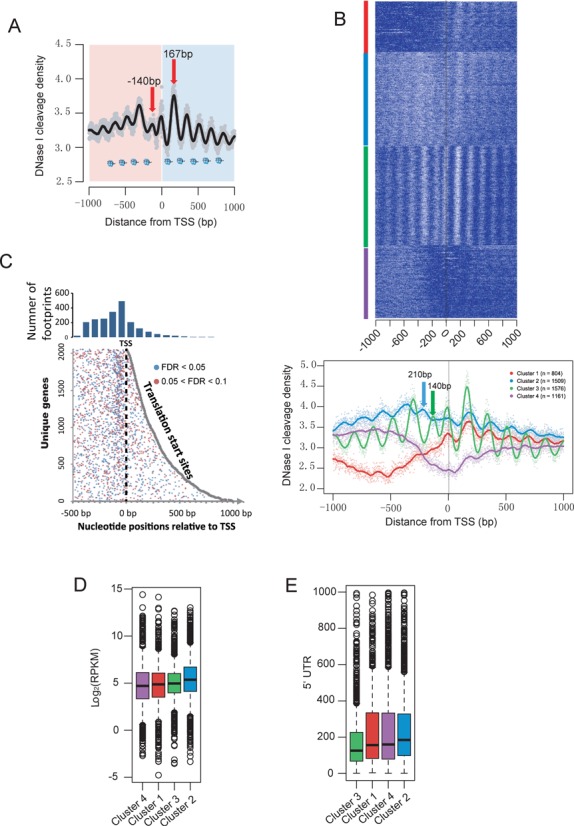
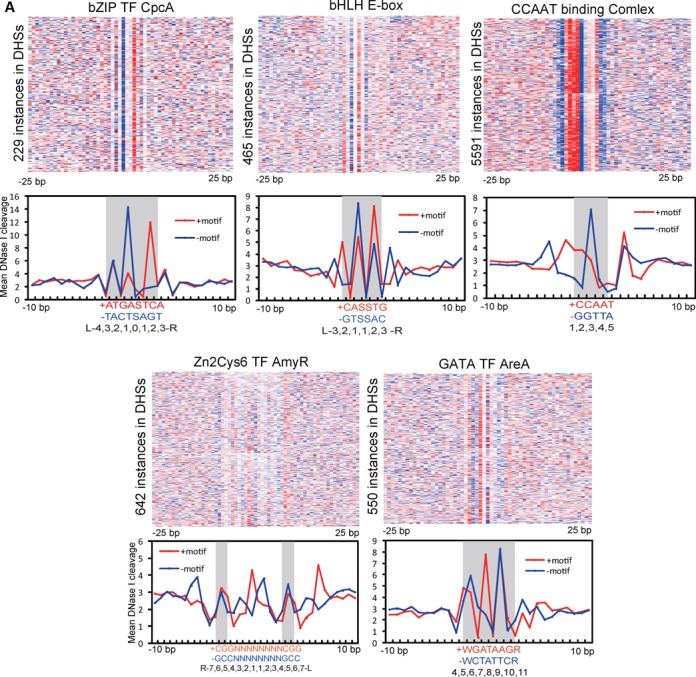
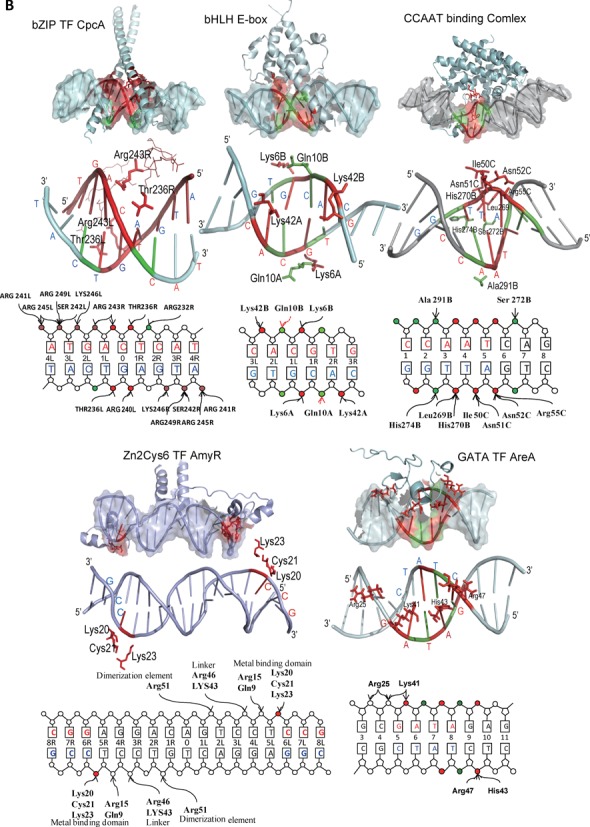
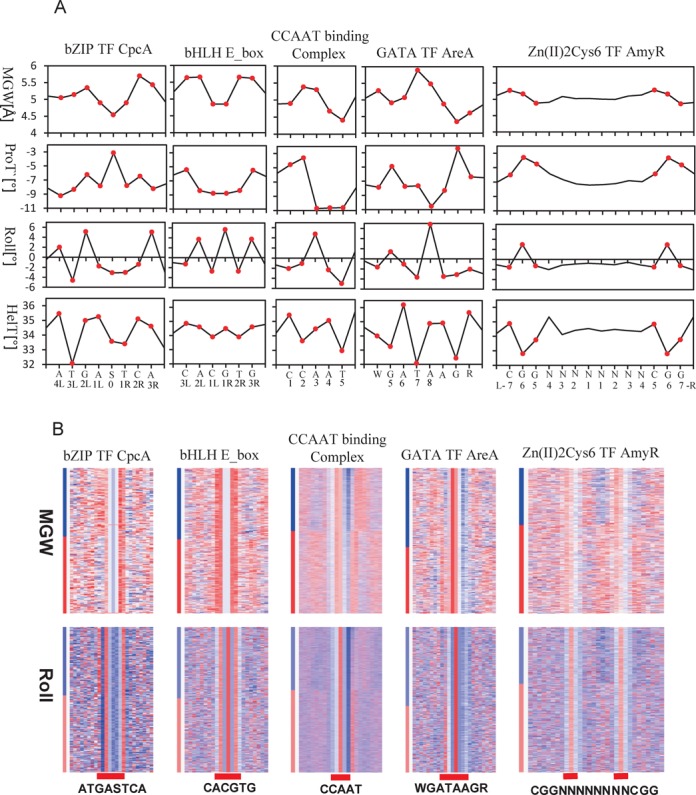
The genome-scale delineation of in vivo protein-DNA interactions is key to understanding genome function. Only ∼5% of transcription factors (TFs) in the Aspergillus genus have been identified using traditional methods. Although the Aspergillus oryzae genome contains >600 TFs, knowledge of the in vivo genome-wide TF-binding sites (TFBSs) in aspergilli remains limited because of the lack of high-quality antibodies. We investigated the landscape of in vivo protein-DNA interactions across the A. oryzae genome through coupling the DNase I digestion of intact nuclei with massively parallel sequencing and the analysis of cleavage patterns in protein-DNA interactions at single-nucleotide resolution. The resulting map identified overrepresented de novo TF-binding motifs from genomic footprints, and provided the detailed chromatin remodeling patterns and the distribution of digital footprints near transcription start sites. The TFBSs of 19 known Aspergillus TFs were also identified based on DNase I digestion data surrounding potential binding sites in conjunction with TF binding specificity information. We observed that the cleavage patterns of TFBSs were dependent on the orientation of TF motifs and independent of strand orientation, consistent with the DNA shape features of binding motifs with flanking sequences.
© The Author(s) 2015. Published by Oxford University Press on behalf of Nucleic Acids Research.
Figures
Similar articles
-
Construction of transcript regulation mechanism prediction models based on binding motif environment of transcription factor AoXlnR in Aspergillus oryzae.J Bioinform Comput Biol. 2024 Jun;22(3):2450017. doi: 10.1142/S0219720024500173. J Bioinform Comput Biol. 2024. PMID: 39051143
-
Contribution of Sequence Motif, Chromatin State, and DNA Structure Features to Predictive Models of Transcription Factor Binding in Yeast.PLoS Comput Biol. 2015 Aug 20;11(8):e1004418. doi: 10.1371/journal.pcbi.1004418. eCollection 2015 Aug. PLoS Comput Biol. 2015. PMID: 26291518 Free PMC article.
-
High-resolution mapping of in vivo genomic transcription factor binding sites using in situ DNase I footprinting and ChIP-seq.DNA Res. 2013 Aug;20(4):325-38. doi: 10.1093/dnares/dst013. Epub 2013 Apr 11. DNA Res. 2013. PMID: 23580539 Free PMC article.
-
Genomics of Aspergillus oryzae.Biosci Biotechnol Biochem. 2007 Mar;71(3):646-70. doi: 10.1271/bbb.60550. Epub 2007 Mar 7. Biosci Biotechnol Biochem. 2007. PMID: 17341818 Review.
-
[Genome sequencing of Aspergillus oryzae].Tanpakushitsu Kakusan Koso. 2006 May;51(5):452-6. Tanpakushitsu Kakusan Koso. 2006. PMID: 16686348 Review. Japanese. No abstract available.
Cited by
-
qNABpredict: Quick, accurate, and taxonomy-aware sequence-based prediction of content of nucleic acid binding amino acids.Protein Sci. 2023 Jan;32(1):e4544. doi: 10.1002/pro.4544. Protein Sci. 2023. PMID: 36519304 Free PMC article.
-
Profiling of chromatin accessibility identifies transcription factor binding sites across the genome of Aspergillus species.BMC Biol. 2021 Sep 6;19(1):189. doi: 10.1186/s12915-021-01114-0. BMC Biol. 2021. PMID: 34488759 Free PMC article.
-
Comprehensive investigation of the gene expression system regulated by an Aspergillus oryzae transcription factor XlnR using integrated mining of gSELEX-Seq and microarray data.BMC Genomics. 2019 Jan 8;20(1):16. doi: 10.1186/s12864-018-5375-5. BMC Genomics. 2019. PMID: 30621576 Free PMC article.
-
Identification and Characterization of a Novel Basic Helix-Loop-Helix Transcription Factor of Phospholipid Synthesis Regulation in Aspergillus niger.Front Microbiol. 2020 Jan 9;10:2985. doi: 10.3389/fmicb.2019.02985. eCollection 2019. Front Microbiol. 2020. PMID: 31993030 Free PMC article.
References
-
- Kobayashi T., Abe K., Asai K., Gomi K., Juvvadi P.R., Kato M., Kitamoto K., Takeuchi M., Machida M. Genomics of Aspergillus oryzae. Biosci. Biotechnol. Biochem. 2007;71:646–670. - PubMed
-
- Machida M., Asai K., Sano M., Tanaka T., Kumagai T., Terai G., Kusumoto K., Arima T., Akita O., Kashiwagi Y., et al. Genome sequencing and analysis of Aspergillus oryzae. Nature. 2005;438:1157–1161. - PubMed
-
- Tamano K., Sano M., Yamane N., Terabayashi Y., Toda T., Sunagawa M., Koike H., Hatamoto O., Umitsuki G., Takahashi T., et al. Transcriptional regulation of genes on the non-syntenic blocks of Aspergillus oryzae and its functional relationship to solid-state cultivation. Fungal Genet. Biol. 2008;45:139–151. - PubMed
Publication types
MeSH terms
Substances
LinkOut - more resources
Full Text Sources
Other Literature Sources
Miscellaneous
