. 2015 Apr 16;10(4):e0123938.
doi: 10.1371/journal.pone.0123938. eCollection 2015.

Graves' disease is associated with a defective expression of the immune regulatory molecule galectin-9 in antigen-presenting dendritic cells

Affiliations

Graves' disease is associated with a defective expression of the immune regulatory molecule galectin-9 in antigen-presenting dendritic cells

Susanna Leskela et al. PLoS One. .

Abstract

Introduction: Patients with autoimmune thyroid disease (AITD) show defects in their immune-regulatory mechanisms. Herein we assessed the expression and function of galectin-1 and galectin-9 (Gal-1, Gal-9) in dendritic cells (DCs) from patients with AITD.

Materials and methods: Peripheral blood samples from 25 patients with Graves' disease (GD), 11 Hashimoto's thyroiditis (HT), and 24 healthy subjects were studied. Thyroid tissue samples from 44 patients with AITD and 22 patients with goiter were also analyzed. Expression and function of Gal-1 and Gal-9 was assessed by quantitative RT-PCR, immunofluorescence and flow cytometry.

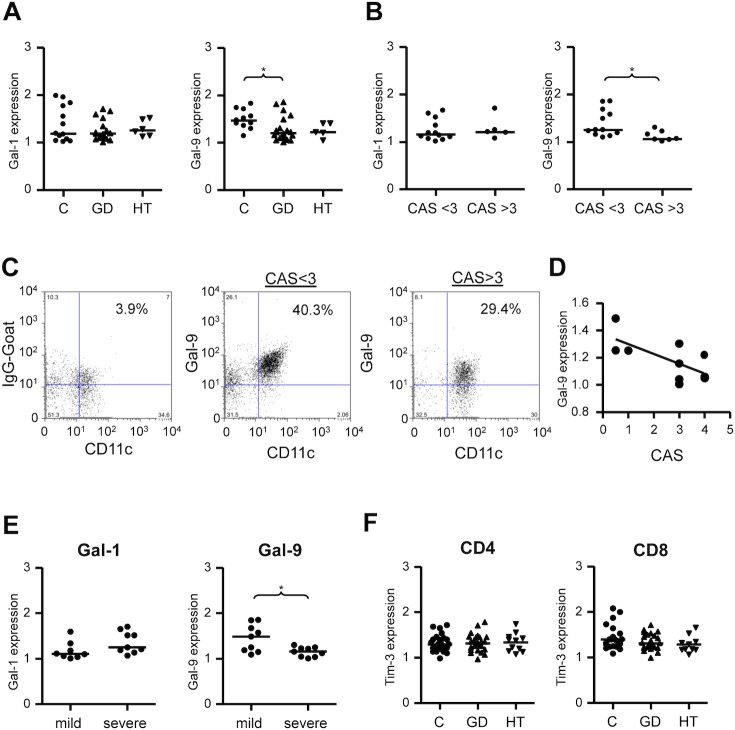
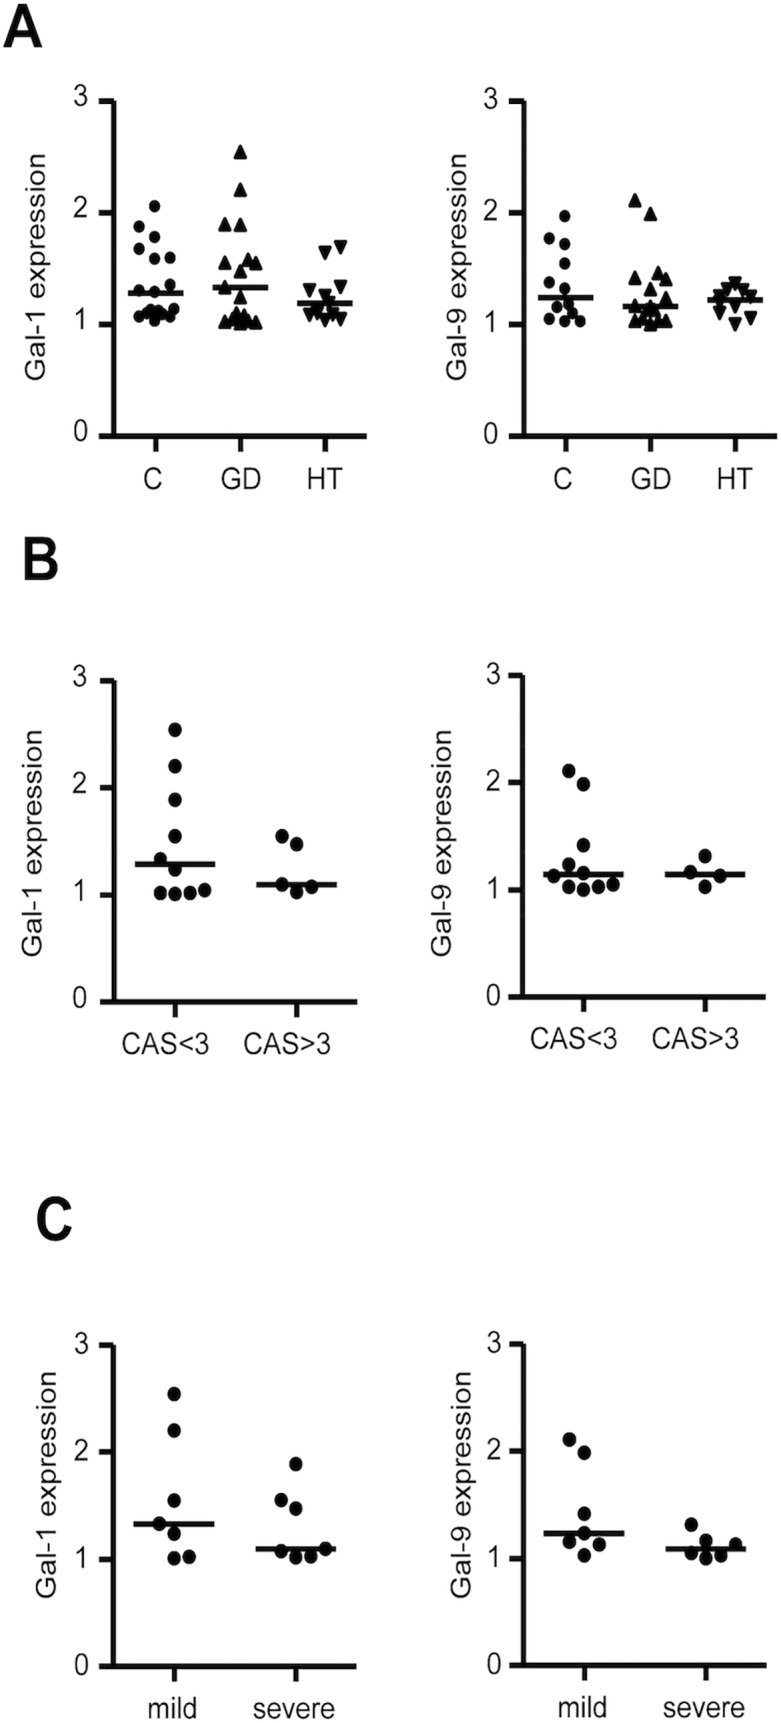
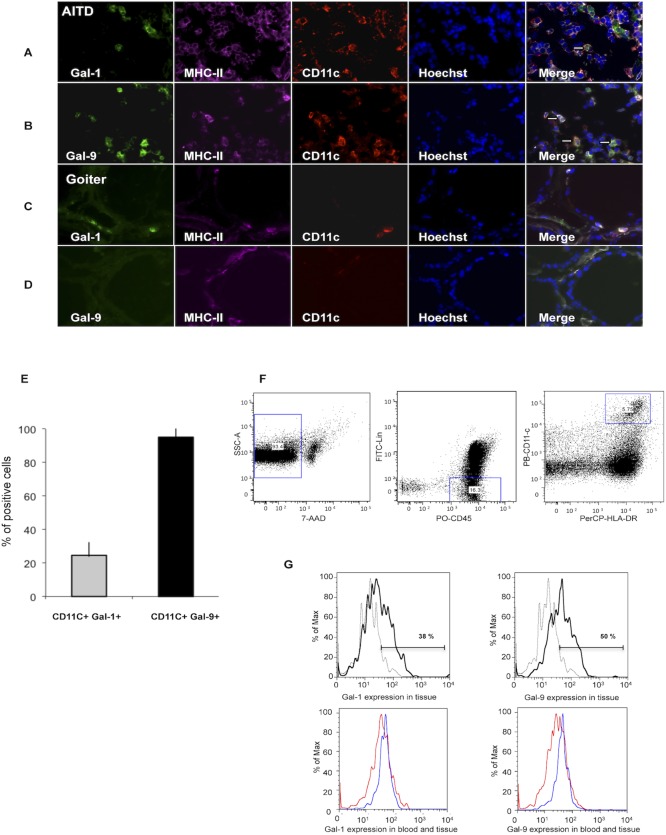
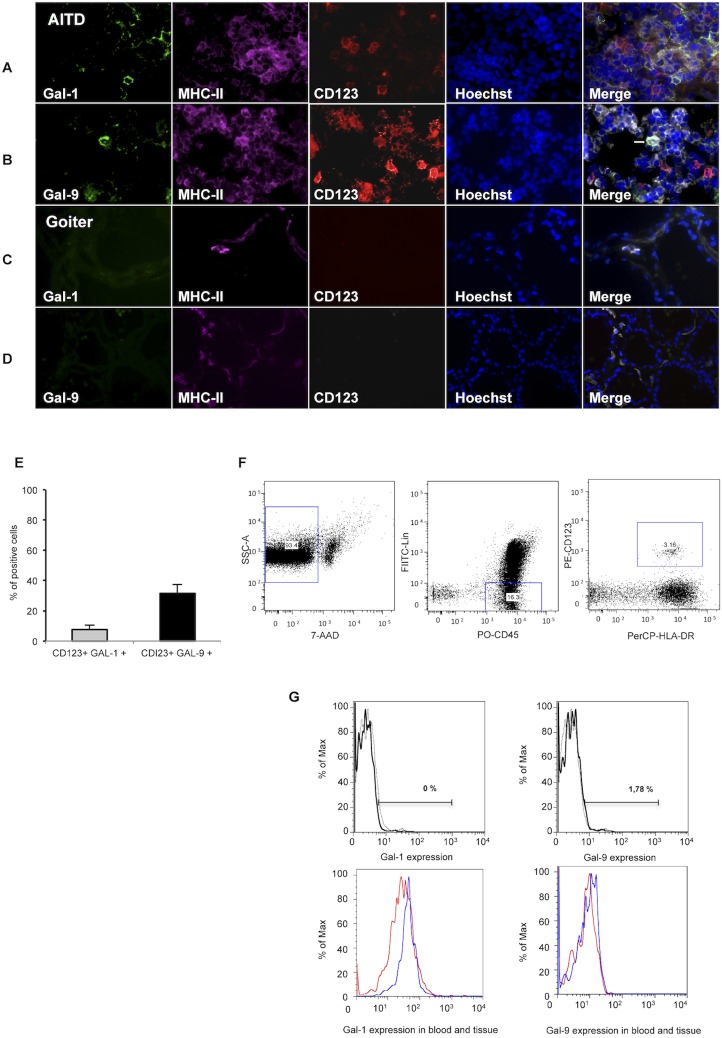
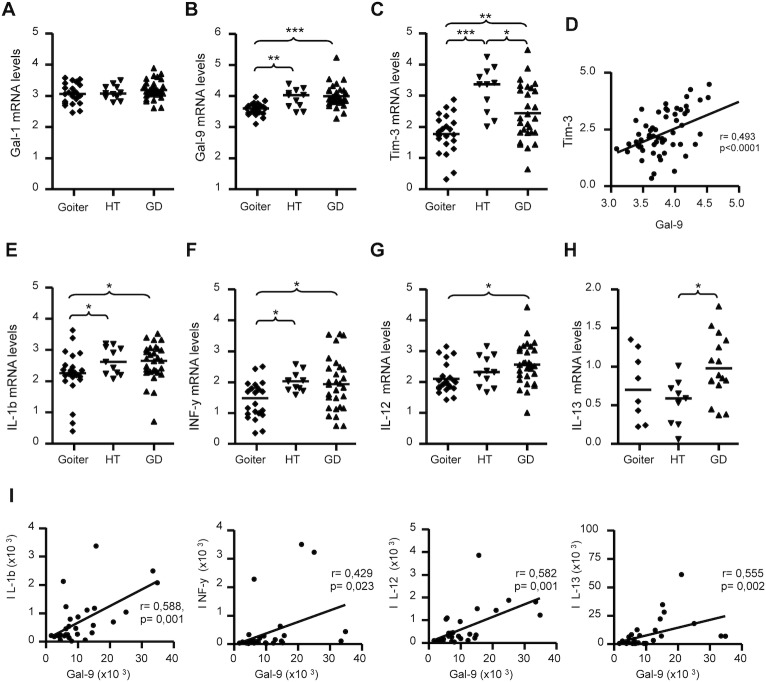
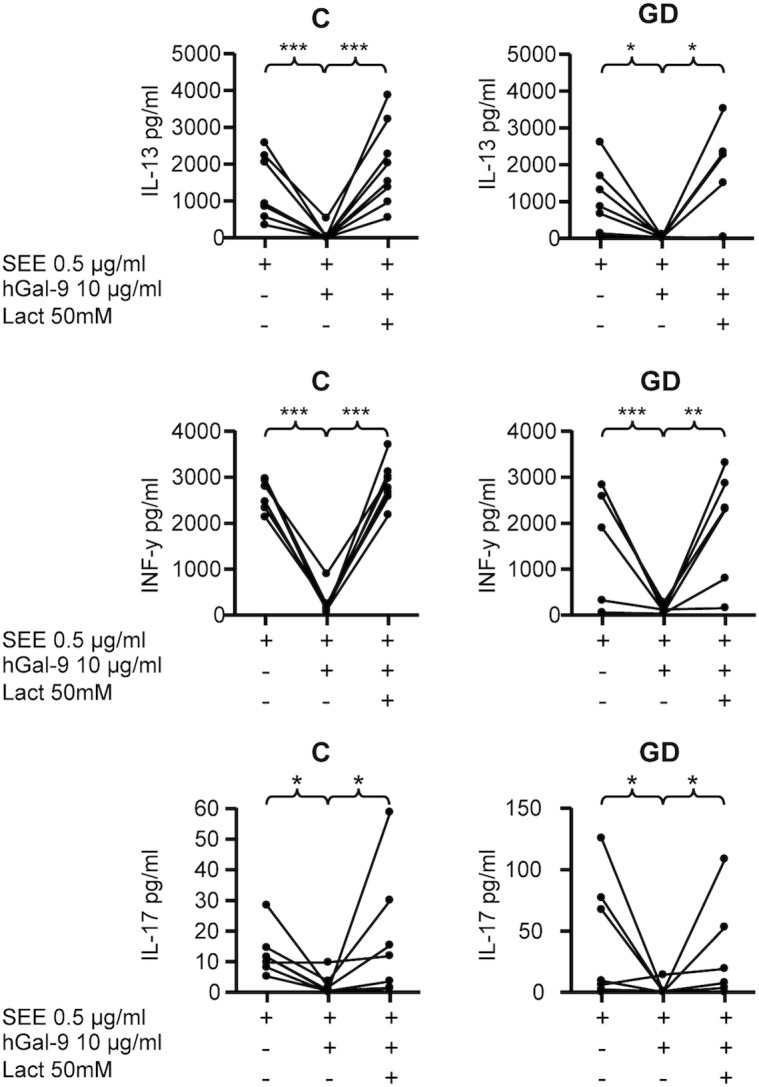
Results: A diminished expression of Gal-9, but not of Gal-1, by peripheral blood DCs was observed in GD patients, mainly in those with Graves´ ophthalmopathy, and a significant negative association between disease severity and Gal-9 expression was detected. In addition, the mRNA levels of Gal-9 and its ligand TIM-3 were increased in thyroid tissue from AITD patients and its expression was associated with the levels of Th1/Th12/Th17 cytokines. Immunofluorescence studies proved that intrathyroidal Gal-9 expression was confined to DCs and macrophages. Finally, in vitro functional assays showed that exogenous Gal-9 had a suppressive effect on the release of Th1/Th2/Th17 cytokines by DC/lymphocyte autologous co-cultures from both AITD patients and healthy controls.

Conclusions: The altered pattern of expression of Gal-9 in peripheral blood DCs from GD patients, its correlation with disease severity as well as its ability to suppress cytokine release suggest that Gal-9 could be involved in the pathogenesis of AITD.


Conflict of interest statement

Competing Interests: The authors have declared that no competing interests exist.

Figures

Fig 1
Fig 1. Expression of Gal-1 and Gal-9 by peripheral blood cDCs in patients with AITD.
Blood samples were obtained from patients with HT, GD, and healthy controls (C), and Gal-1 and Gal-9 expression by DCs was analyzed by multiparametric flow cytometry, as described in Materials and Methods. A) Mean fluorescence intensity (MFI) of Gal-1 and Gal-9 expression in cDCS from GD and HT patients and healthy controls. B) MFI of Gal-1 and Gal-9 expression in cDCs from patients with GD, classified according to the presence or absence of active ophthalmopathy (CAS > 3 and CAS < 3 respectively). Galectins expression corresponds to normalized values (MFI Gal/MFI IgG goat) as described in Material and Methods.C) Representative flow cytometry dot plots of Gal-9 expression by cDCs from two GD patients, with CAS>3 and CAS<3 respectively. D) Linear correlation analysis of Gal-9 expression by cDCs from patients with GD and corresponding CAS. E) Levels of Gal-1 and Gal-9 expression by cDCs from GD patients classified according to disease severity. F) Expression of the Gal-9 ligand Tim-3 by CD4+ and CD8+ cells in HT, GD and healthy controls. Differences were evaluated by Kruskal-Wallis and post hoc analyses (Dunnett’s test) or the Mann-Whitney U test. *p<0.05, **p<0.01, ***p<0.001.
Fig 2
Fig 2. Analysis of Gal-1 and Gal-9 expression in peripheral blood pDCs from AITD patients according to disease category and activity.
Peripheral blood samples were obtained from patients with HT, GD, and healthy controls, and analyzed for Gal-1 and Gal-9 expression by multiparametric flow cytometry, as described in Materials and Methods. A) Mean fluorescence intensity (MFI) of Gal-1 and Gal-9 expression by pDCs in patients with HT and GD and healthy controls. B) MFI of Gal-1 and Gal-9 expression in pDCs from patients with GD, classified according to ophthalmopathy activity. C) Levels of Gal-1 and Gal-9 expression in pDCs from patients with GD, classified according to disease severity. Galectins expression corresponds to normalized values (MFI Gal/ MFI IgG goat) as described in Material and Methods.
Fig 3
Fig 3. Gal-1 and Gal-9 are expressed by cDCs in thyroid tissue from patients with AITD.
Triple immunofluorescence microscopy analysis of thyroid tissue from a representative AITD patient (A,B) and goiter(C,D) for the expression of Gal-1 or Gal-9 (green), HLA-DR (purple) and CD11c (red); nuclei were counterstained with Hoechst (blue); arrowheads marks some of the triple-positive cells. E) Percent of conventional dendritic cells expressing Gal-1 or Gal-9, a minimum of 100 cells (CD11c+) per slide were analyzed.F, G. Flow cytometry analysis of Gal-1 and Gal-9 expression in cDCs. F) Dot plot strategy to select cDCs; lineage negative cells (CD3, CD14, CD16, CD19 and CD20), CD45+, HLA-DR+, CD11c+. G) Representative histogram of Gal-1 and Gal-9 expression in cDCs from the thyroid gland. The percentage of Gal-1 and Gal-9 positive cells in cDCs in a representative GD patient (blue line) compared to the negative control (gray line) is shown. The apparent discrepancy between IHC and flow cytometry studies is very likely due to the different strategy to select cDCs. The Gal-1 and Gal-9 positive intrathyroidal cDCs (blue line) are compared to peripheral blood expression in the same GD patient (red line).
Fig 4
Fig 4. Gal-1 and Gal-9 expression by thyroid infiltrating pDCs in thyroid tissue from patients with AITD.
A-D) Triple immunofluorescence microscopy analysis of thyroid gland sections from a representative patient with AITD (A, B) and goiter (C,D) for the expression of Gal-1 or Gal-9 (green), HLA-DR (purple) and CD123 (red); nuclei were counterstained with Hoechst (blue); arrowheads marks some of the triple-positive cells. E) Percent of plasmacytoid dendritic cells expressing Gal-1 or Gal-9, a minimum of 50 cells (CD123+) per slide were analyzed. F,G. Flow cytometry analysis of Gal-1 and Gal-9 expression in pDCs. F) Dot plot strategy to select pDCs; lineage negative cells (CD3, CD14, CD16, CD19 and CD20), CD45+, HLA-DR+, CD123+. G) Representative histogram of Gal-1 and Gal-9 expression in pDCs from the thyroid gland. The percentage of Gal-1 and Gal-9 positive cells in CD123+ intrathyroidal pDCs in a representative GD patient (blue line) compared to the negative control (gray line), is shown. The apparent discrepancy between the results between IHC and flow cytometry studies is very likely due to the different strategy to select intrathyroidal pDCs. The Gal-1 and Gal-9 positive intrathyroidal CD123+ pDCs (blue line) are compared to peripheral blood expression in the same GD patient (red line).
Fig 5
Fig 5. Analysis of mRNA levels of Gal-1, Gal-9 and Th1/Th2 cytokines in thyroid glands from AITD patients.
Levels of mRNA of Gal-1, Gal-9, Tim-3 and the indicated Th1/Th2 cytokines were determined by qRT-PCR analysis in thyroid samples from 40 AITD patients and 22 patients with goiter. A-C) mRNA levels of Gal-1, Gal-9 and its ligand Tim-3 in thyroid tissue from patients with goiter, HT and GD. D) Correlation analysis between Tim-3 and Gal-9 mRNA levels in thyroid tissue samples from patients with GD. E-H) mRNA levels of the indicated Th1 and Th2 cytokines in thyroid tissue from patients with goiter, HT and GD. I) Correlation analysis between mRNA levels of Gal-9 and the indicated cytokines in thyroid tissue samples from patients with GD. mRNA levels were normalized using HPRT and β-actin as internal controls. Differences among groups were analysed by the ANOVA and Bonferroni tests, *p<0.05, **p<0.01, ***p<0.001. Correlation analysis was performed by Pearson or Spearman tests.
Fig 6
Fig 6. Inhibitory effect of Gal-9 on cytokine release in co-cultures of autologous moDCs with PBLs from patients with AITD and healthy controls.
PBLs were co-cultured with autologous moDCs preloaded with the superantigen SEE (0,5μg/ml), in the presence or absence of 10μg/ml hGal-9 and 50 mM lactose (Lact), as stated in Materials and Methods. Then, the concentrations of the indicated cytokines in cell culture supernatants were determined by bead-based immunoassay and analysed by flow cytometry. C, healthy controls; GD, Graves’ disease.*p<0.05, **p<0.01, ***p<0.001.

Similar articles

Cited by

References

    1. Weetman AP (2004) Cellular immune responses in autoimmune thyroid disease. Clin Endocrinol (Oxf) 61: 405–413. - PubMed
    1. Wiersinga WM (2011) Autoimmunity in Graves' ophthalmopathy: the result of an unfortunate marriage between TSH receptors and IGF-1 receptors?. J Clin Endocrinol Metab 96: 2386–2394. 10.1210/jc.2011-0307 - DOI - PubMed
    1. Prabhakar BS, Bahn RS, Smith TJ (2003) Current perspective on the pathogenesis of Graves' disease and ophthalmopathy. Endocr Rev 24: 802–835. - PubMed
    1. Rabinovich GA, Toscano MA (2009) Turning 'sweet' on immunity: galectin-glycan interactions in immune tolerance and inflammation. Nat Rev Immunol 9: 338–352. 10.1038/nri2536 - DOI - PubMed
    1. de la Fuente H, Cibrian D, Sanchez-Madrid F (2012) Immunoregulatory molecules are master regulators of inflammation during the immune response. FEBS Lett 586: 2897–2905. 10.1016/j.febslet.2012.07.032 - DOI - PMC - PubMed

Publication types

MeSH terms

Grants and funding

This work was supported by grants from the Fondo de Investigaciones Sanitarias (FISS) PI10/02521 and S2010/BMD-2328 TIRONET (Comunidad de Madrid), Spain (to MM) and the Fondo de Cooperación Internacional en Ciencia y Tecnología (FONCICYT) 95395, European Union-México (to RGA). The funders had no role in study design, data collection and analysis, decision to publish, or preparation of the manuscript.