Review
. 2015 Apr;5(2):761-90.
doi: 10.1002/cphy.c140062.

Channelopathies of skeletal muscle excitability

Affiliations
Review

Channelopathies of skeletal muscle excitability

Stephen C Cannon. Compr Physiol. 2015 Apr.

Abstract

Familial disorders of skeletal muscle excitability were initially described early in the last century and are now known to be caused by mutations of voltage-gated ion channels. The clinical manifestations are often striking, with an inability to relax after voluntary contraction (myotonia) or transient attacks of severe weakness (periodic paralysis). An essential feature of these disorders is fluctuation of symptoms that are strongly impacted by environmental triggers such as exercise, temperature, or serum K(+) levels. These phenomena have intrigued physiologists for decades, and in the past 25 years the molecular lesions underlying these disorders have been identified and mechanistic studies are providing insights for therapeutic strategies of disease modification. These familial disorders of muscle fiber excitability are "channelopathies" caused by mutations of a chloride channel (ClC-1), sodium channel (NaV1.4), calcium channel (CaV1.1), and several potassium channels (Kir2.1, Kir2.6, and Kir3.4). This review provides a synthesis of the mechanistic connections between functional defects of mutant ion channels, their impact on muscle excitability, how these changes cause clinical phenotypes, and approaches toward therapeutics.


Figures

Figure 1
Figure 1
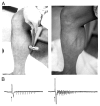
Percussion myotonia in a patient with myotonia congenita. (A) The calf muscles are hypertrophied, and a direct tap with the reflex hammer elicits a sustained dimpling of the muscle. (B) The needle electromyogram shows myotonic discharges from a single fiber in response to a light tap (left) and from multiple fibers with a stronger tap (right). [Adapted, with permission from reference (99). Originally published in Muscle and Nerve 47:632–648, 2013.]
Figure 2
Figure 2
Transient muscle weakness in severe myotonia congenita. The top trace shows the surface electromyogram and the bottom trace shows grip force recorded with forceful voluntary effort, after a period of rest. The maximum force decreases markedly after the second contraction, and at the same time the force between contractions does not return to baseline. The transient loss of force is accompanied by a marked decrease in muscle electrical activity. [Adapted, with permission, from reference (199). Originally published in J. Neurol. 218:253–262, 1978.]
Figure 3
Figure 3
Electrical myotonia recorded by needle EMG. (A) Burst of myotonic discharges elicited by needle movement shows the waxing and waning of amplitude and frequency. (B) A myotonic burst of discharges may be prolonged, as shown in this continuous EMG recording from the M1592V mouse model of hyperkalemic periodic paralysis. [(A) Reproduced with permission from (121). (b) Adapted with permission from (97). Originally published in J. Clin Invest 4:1437–1449, 2008.]
Figure 4
Figure 4
Action potentials recorded with intracellular microelectrodes from intercostal fibers of wild type (WT) and congenitally myotonic goats. (A–C) Progressively increasing stimulus current in WT fibers elicits passive electrotonic responses until the action potential threshold of 87 nA. (D) Myotonic fibers have a lower threshold of 19 nA and a prolonged electronic approach toward threshold (open arrow). The electronic depolarization is about two-fold larger for myotonic fibers (D) compared to WT fibers with the same current intensity (A), thereby demonstrating an increased input resistance in the former. (E) Stimulus current of 2.5 times threshold elicits multiple spikes and after-discharges that persist beyond the stimulus duration. Notice the progressive depolarized shift in the membrane potential at the end of each spike. This shift reflects cumulative trapping of K+ in the T-tubules. (F) Myotonic discharges are produced by WT fibers in a Cl free bath. [Adapted with permission from (1). Originally published in J. Physiol. 240: 505–515, 1974.]
Figure 5
Figure 5
Spectrum of ion channelopathies of skeletal muscle. The clinical presentation includes myotonia (left), periodic paralysis (right) or a combination of both (middle). The chloride channel disorder myotonia congentia may be dominant or recessive; all others have dominant inheritance. Symptoms are limited to skeletal muscle except for the systemic effects of thyrotoxicosis and Andersen-Tawil Syndrome which also affects heart and bone.
Figure 6
Figure 6
Loss of function gating defects for ClC-1 G190S associated with dominant myotonia congenita. Chloride currents were recorded from HEK cells transfected with WT ClC-1 (A) or G190S (B). Inward currents were smaller than reported for many other studies of ClC-1 because the pipette (internal) solution contained a normal physiological concentration of 4 mM Cl . The instantaneous current elicited by a voltage jump from −95 mV was smaller for G190S (C), and the current deactivated much faster than WT upon hyperpolarization to −105 mV (compare tail currents in panels A and B). (D) The steady-state current –voltage relationship for G190S was shifted to depolarized potentials and had a greatly reduced slope conductance in the voltage range for Vrest in muscle. (E) The voltage dependence of the apparent open probability, computed from the initial peak of the tail currents, shows a dramatic right shift for G190S. [Redrawn with permission from (53). Originally published in Exp. Neurol. 248:530–540, 2013.]
Figure 7
Figure 7
Fast-inactivation defects for NaV1.4 mutations associated with myotonia and HyperPP. (A) Cell-attached patch recordings from HEK cells expressing WT or HyperPP mutant NaV1.4 (T704M, M1592V) reveal re-openings and prolonged openings (downward deflections) that in the ensemble average produce an abnormal persistent open probability (bottom traces). (B) Whole-cell recordings from HEK cells expressing WT or the SCM mutant NaV1.4 F1705I show two-fold slower rate of inactivation for mutant channels. (C) A two-pulse recovery protocol reveals an accelerated rate of recovery from inactivation for the PMC mutant channel NaV1.4 T1313M. [(A) adapted from (33), originally published in Neuron 2:317–326, 1993. (B) adapted from (279), originally published in J. Physiol. 565:371–380, 2005. (C) adapted from (95), originally published in J. Gen. Physiol. 107:559–576, 1995.]
Figure 8
Figure 8
Gating pore currents resulting from R/X mutations in S4 voltage sensors. (A) Schematic representation for mutations of NaV1.4 associated with periodic paralysis (left) and for mutations of CaV1.1 associated with HypoPP (right). The mutations linked to HypoPP in either channel are found predominantly at arginine residues at the outer end of S4 voltage sensors. (B) Currents recorded from oocytes expressing the HypoPP mutant R669H NaV1.4 demonstrate inward rectification compared to WT. Recordings performed in 1 μM TTX to block the pore of NaV1.4; no leak subtraction performed. (C) Steady-state current voltage relation shows inward rectification for test potentials < −40 mV. (D) Conceptual model for the voltage-dependence of the gating pore current. Ion conduction occurs at hyperpolarized potentials that bias the S4 sensor to the inward position, which places the mutation at the narrow constriction of the gating pore and allows anomalous conduction. [(B and C) adapted, with permission, from (241). Originally published in J. Gen. Physiol. 130:11–20, 2007.]
Figure 9
Figure 9
Model simulation of myotonia and periodic paralysis resulting from NaV1.4 mutations. Simulated NaV1.4 currents using a Hodgkin-Huxley model (31) are illustrated in the top row. The WT response (black) is superimposed on simulations of SCM and HyperPP mutant channels (blue) to emphasize the changes in kinetics and steady-state behavior, respectively. These simulated NaV1.4 currents were used in a model of muscle excitability (31) to compute the voltage response to a 100 msec current pulse (bottom row). Normally, a single action potential is elicited and the fiber accommodates for the remainder of the stimulus (left). The SCM mutation slows inactivation (middle) which results in susceptibility to myotonic bursts of discharges. The progressive depolarized shift between spikes (0–100 msec) is caused by K+ accumulation in the simulated T-tubule. The persistent current associated with incomplete inactivation for HyperPP mutations (right) produces susceptibility to a stable depolarized potential from which point the fiber is refractory for generating subsequent spikes in response to a current pulse (200 msec).
Figure 10
Figure 10
Overview of NaV1.4 gating defects associated with clinical syndromes for skeletal muscle channelopathies. The Venn diagram illustrates the overlap of functional defects that produce the spectrum of allelic disorders of skeletal muscle caused by missense mutations of NaV1.4. Abbreviations: SCM – sodium channel myotonia, PMC – paramyotonia congenita, HyperPP – hyperkalemic periodic paralysis, HypoPP – hypokalemic periodic paralysis, CMS – congenital myasthenic syndrome.
Figure 11
Figure 11
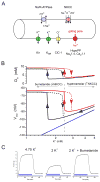
Mechanistic model for paradoxical depolarization during attacks of HypoPP. (A) Schematic representation of the pumps and transporters (top) and conductances (bottom) that contribute to Vrest in skeletal muscle. The arrows indicate the net direction of ion flux at Vrest. The gating pore conductance is anomalous and may arise from R/X mutations in S4 of NaV1.4 or CaV1.1. The diagram illustrates the case for mutations that create a non-selective gating pore and for which the major charge carrier is an influx of Na+. (B) Simulations of a model fiber containing the elements in (A) show a hysteresis loop for the paradoxical depolarization of Vrest as the external K+ is reduced. For simulated WT fibers (black traces), the paradoxical depolarization occurs at a K+ of 1.7 mM, an extremely low value which would not occur under normal physiological conditions. This depolarized shift results from a failure of Kir to maintain Vrest in exceptionally low K+. Consequently, the fiber depolarizes until KDR is sufficiently activated at −65 mV to maintain Vrest. At this depolarized potential, internal Cl equilibrates at 8.5 mM, two-fold higher than normal. As the K+ is then increased, the high internal Cl state keeps Vrest depolarized until K+ is about 2.4 mM, creating a bistable Vrest in the K+ range from 1.7 – 2.4 mM. In HypoPP fibers (red), the gating pore conductance produces a rightward shift of the K+ concentration at which paradoxical depolarization may occur, thereby resulting in susceptibility to attacks of depolarization-induced periodic paralysis in the low-normal range of external K+. Inhibition of the NKCC transporter with bumetanide favors the low internal Cl state and thereby shifts the hysteresis loop leftward to lower K+ values and reduces the likelihood of an attack of weakness in HypoPP. Conversely, up-regulation of NKCC transport by hyperosmolar conditions shifts the hysteresis loop to the right and increases the risk of HypoPP attacks. (C) In vitro tetanic contractions of the soleus muscle from NaV1.4-R669H mice showing the loss of force in a low-K+ challenge (middle) and the recovery of force by the addition of 1 μM bumetanide while remaining in low K+. [(B) adapted from (242). Originally published in Muscle & Nerve 37:326–337, 2008. (C) reproduced with permission from (277). Originally published in Neurology 80:1110–1116, 2013.]

Similar articles

Cited by

References

    1. Adrian RH, Bryant SH. On the repetitive discharge in myotonic muscle fibres. Journal of Physiology. 1974;240(2):505–515. - PMC - PubMed
    1. Adrian RH, Costantin LL, Peachey LD. Radial spread of contraction in frog muscle fibres. J Physiol. 1969;204(1):231–257. - PMC - PubMed
    1. Adrian RH, Marshall MW. Action potentials reconstructed in normal and myotonic muscle fibres. Journal of Physiology. 1976;258(1):125–143. - PMC - PubMed
    1. Adrian RH, Peachey LD. Reconstruction of the action potential of frog sartorius muscle. Journal of Physiology. 1973;235(1):103–131. - PMC - PubMed
    1. Aickin CC, Betz WJ, Harris GL. Intracellular chloride and the mechanism for its accumulation in rat lumbrical muscle. J Physiol. 1989;411:437–455. - PMC - PubMed

Publication types