. 2015 Feb 15:13:60.
doi: 10.1186/s12967-015-0392-5.

A human immune data-informed vaccine concept elicits strong and broad T-cell specificities associated with HIV-1 control in mice and macaques

Affiliations

A human immune data-informed vaccine concept elicits strong and broad T-cell specificities associated with HIV-1 control in mice and macaques

Beatriz Mothe et al. J Transl Med. .

Abstract

Background: None of the HIV T-cell vaccine candidates that have reached advanced clinical testing have been able to induce protective T cell immunity. A major reason for these failures may have been suboptimal T cell immunogen designs.

Methods: To overcome this problem, we used a novel immunogen design approach that is based on functional T cell response data from more than 1,000 HIV-1 clade B and C infected individuals and which aims to direct the T cell response to the most vulnerable sites of HIV-1.

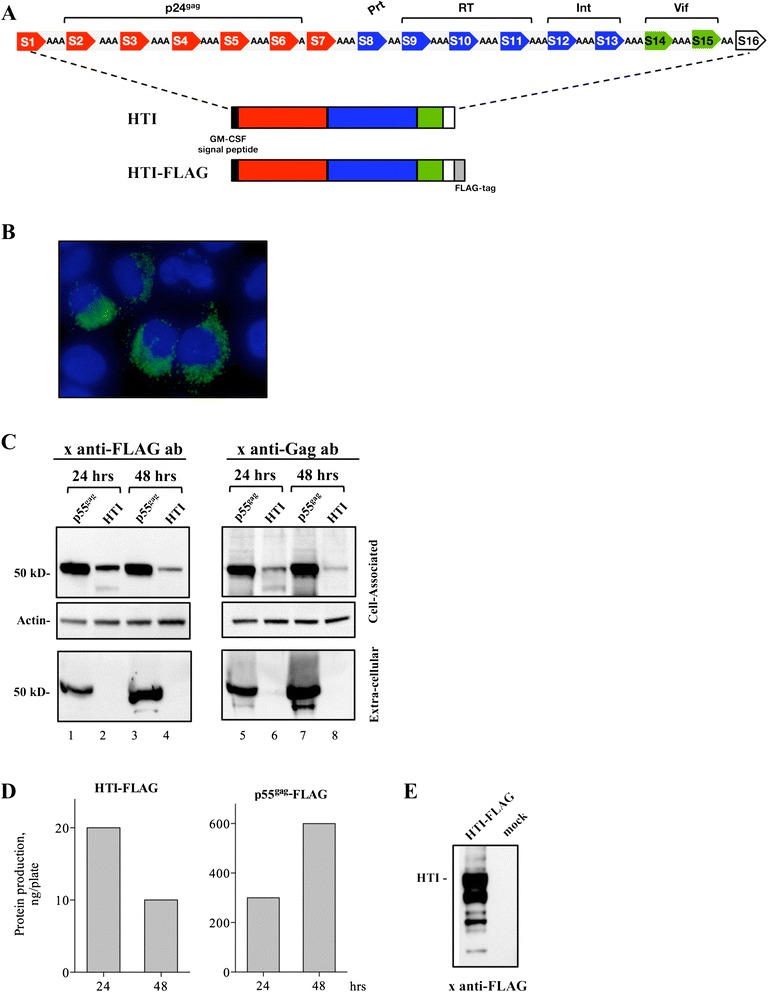
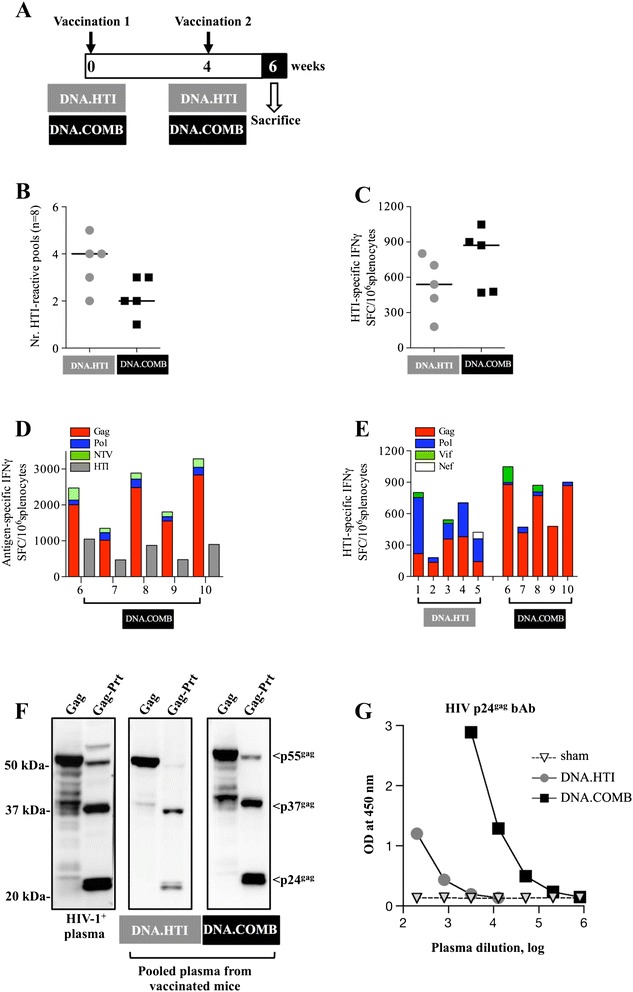
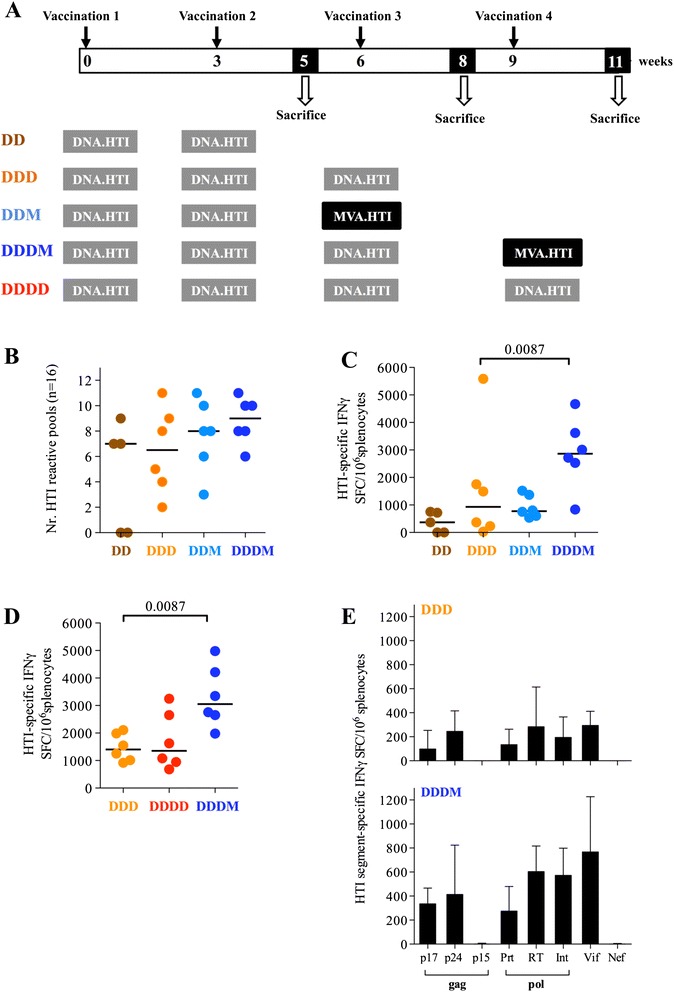
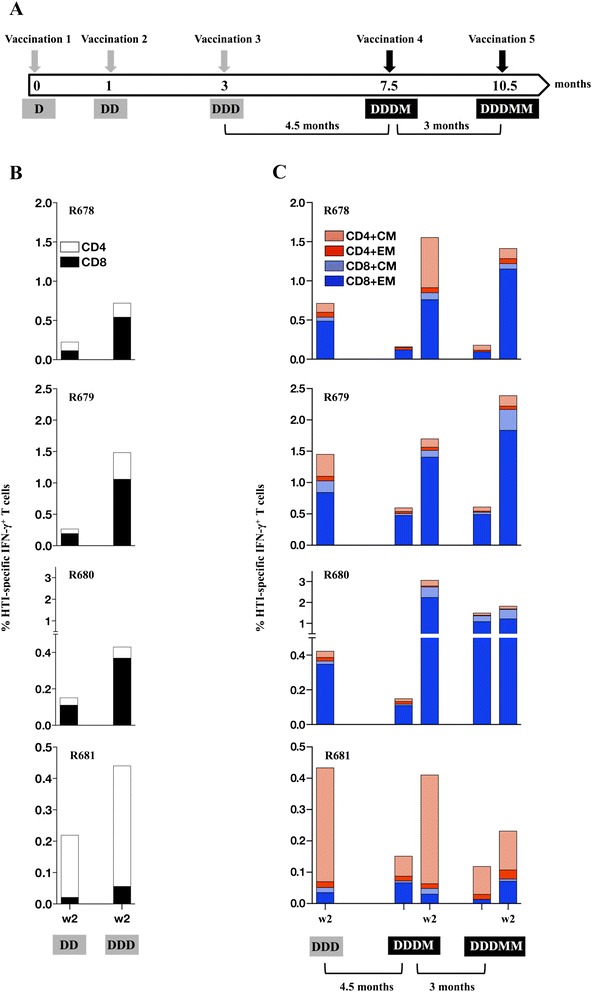
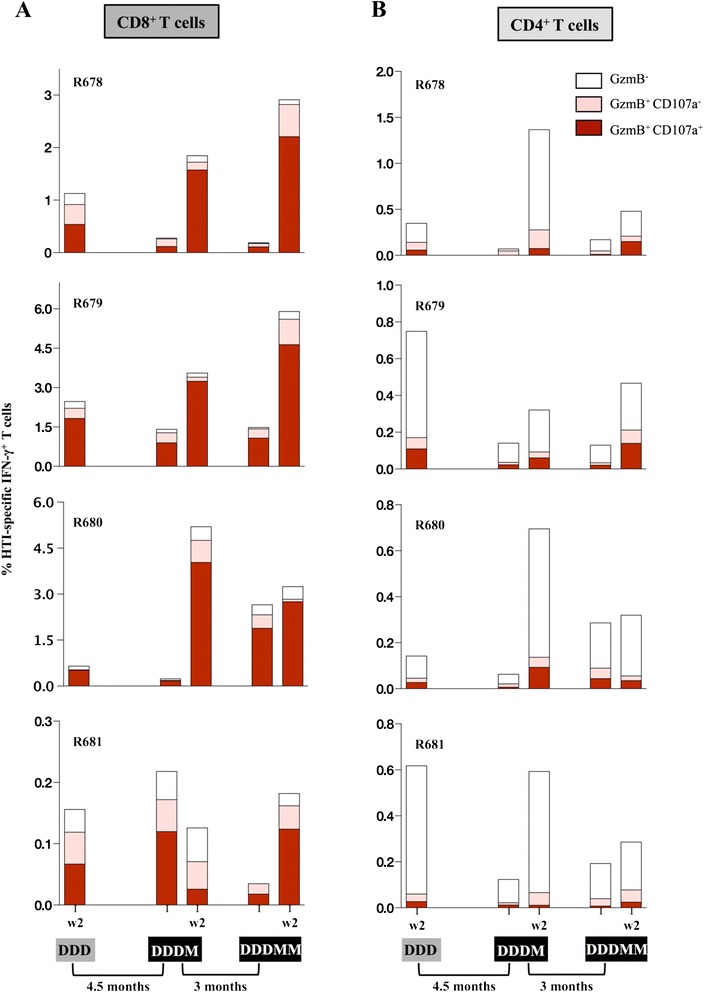
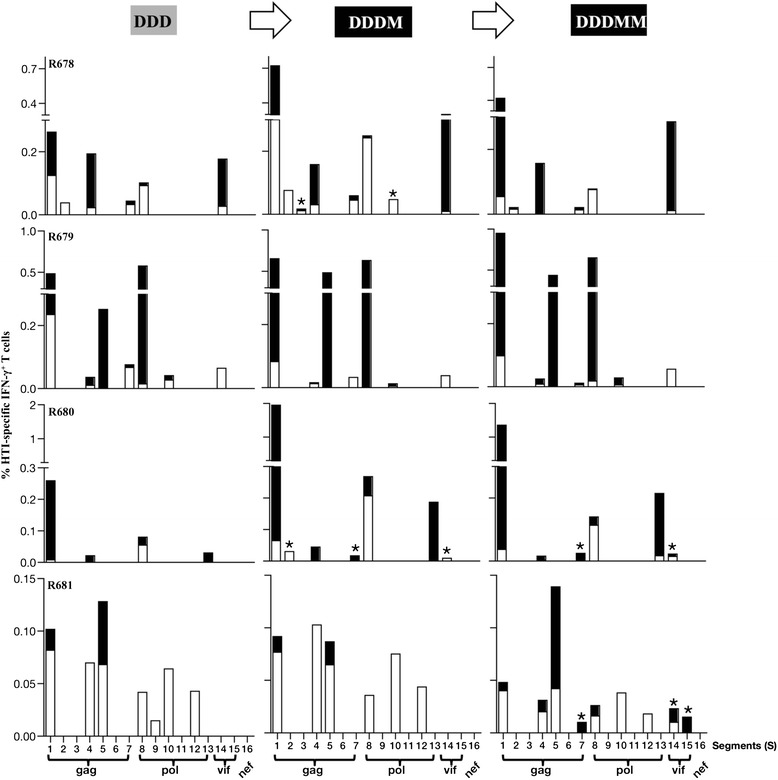
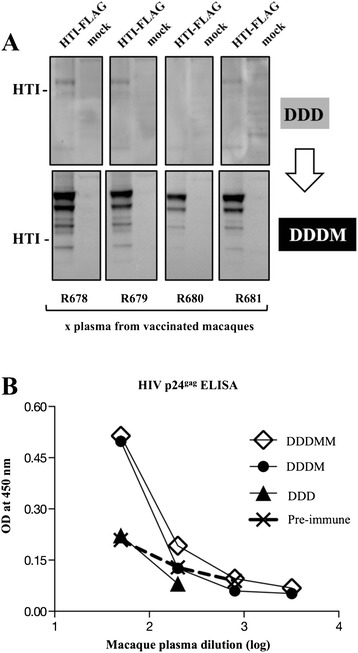
Results: Our approach identified 16 regions in Gag, Pol, Vif and Nef that were relatively conserved and predominantly targeted by individuals with reduced viral loads. These regions formed the basis of the HIVACAT T-cell Immunogen (HTI) sequence which is 529 amino acids in length, includes more than 50 optimally defined CD4(+) and CD8(+) T-cell epitopes restricted by a wide range of HLA class I and II molecules and covers viral sites where mutations led to a dramatic reduction in viral replicative fitness. In both, C57BL/6 mice and Indian rhesus macaques immunized with an HTI-expressing DNA plasmid (DNA.HTI) induced broad and balanced T-cell responses to several segments within Gag, Pol, and Vif. DNA.HTI induced robust CD4(+) and CD8(+) T cell responses that were increased by a booster vaccination using modified virus Ankara (MVA.HTI), expanding the DNA.HTI induced response to up to 3.2% IFN-γ T-cells in macaques. HTI-specific T cells showed a central and effector memory phenotype with a significant fraction of the IFN-γ(+) CD8(+) T cells being Granzyme B(+) and able to degranulate (CD107a(+)).

Conclusions: These data demonstrate the immunogenicity of a novel HIV-1 T cell vaccine concept that induced broadly balanced responses to vulnerable sites of HIV-1 while avoiding the induction of responses to potential decoy targets that may divert effective T-cell responses towards variable and less protective viral determinants.


Figures

Figure 1
Figure 1
Design of HTI, HLA coverage and translation into HIV-1 control. (A) HLA supertype coverage of all the optimal defined epitopes included in HTI immunogen [52]. Colors are based on the allele’s reported relative hazard to develop AIDS (grey, neutral; black, neutral/rapid progression; white, beneficial) [57,58]. (B) The relative dominance of the responses induced by OLP covering the HTI sequence (n = 52) to the complete HIV-1 proteome (n = 410) is shown in elite controllers (EC, n = 38), viremic controllers (VC, n = 27) and non-controllers (NC, n = 30). (C) Total IFN-γ ELISPOT responses (magnitude) against the complete HIV-1 proteome elicited by consensus B overlapping 18-mer peptide sets (n = 410).
Figure 2
Figure 2
Expression of DNA.HTI. (A) The HTI protein is composed of 16 individual segments arranged linearly and linked via 1–3 alanine amino acid linkers and contains the GM-CSF signal peptide for better secretion. Total length of HTI protein is 529 aa, including alanine linkers. (B) Subcellular localization of HTI protein is shown in HeLa-derived HLtat cells transfected with DNA.HTI-FLAG and fixed. The HTI-FLAG protein was visualized with anti-FLAG primary antibody followed by Alexa-Fluor 488 conjugated secondary antibody and the nuclei were visualized with DAPI and a merged image is shown. (C) Plasmid DNA (250 ng) expressing HTI or p55gag with or without FLAG were transfected in HEK293 cells. The cultures were harvested after 24 hrs and 48 hrs and proteins in cell-associated (top panel: 1/100) and extra-cellular (bottom panel: 1/150) fractions were resolved on a 12% NuPAGE Bis-Tris gel. Western immunoblots were analyzed using an anti-FLAG-HRP antibody (lanes 1–4) or a goat anti-p24gag antiserum followed by anti-goat IgG-HRP labeled antibody (lanes 5–8) and were visualized using enhanced ECL. The membranes were probed with an anti-beta actin antibody to control for equal loading of the cell-associated fractions. (D) The serially diluted extracts with cell-associated and extra-cellular fractions for p55gag-FLAG and cell-associated fraction of HTI-FLAG proteins were analyzed together with FLAG-tagged p55gag protein standard. The HTI-FLAG and p55gag proteins were quantified by fitting standard curve using standard p55gag-FLAG protein. (E) Analysis of a 20-fold concentrated sample (compared to panel C) containing HTI-FLAG by Western immunoblot using anti-FLAG antibody.
Figure 3
Figure 3
Balanced immunogenicity upon vaccination with DNA.HTI in mice. (A) Vaccination schedule. Groups of mice (n = 5) were vaccinated twice by IM injection followed by in vivo electroporation (EP) using 20 μg DNA.HTI and a mixture of 3 plasmids encoding for full-length p55gag, Pol and a Nef-Tat-Vif fusion protein (DNA.COMB). Cellular immune responses were measured from thawed splenocytes by IFN-γ ELISPOT 2 weeks after the 2nd vaccination using 8 peptide pools covering the HTI sequence. (B) The number of HTI positive responses (reactive pools) in mice immunized with 20 μg DNA.HTI or DNA-COMB is shown. (C) Total magnitude of the HTI-specific IFN-γ responses is depicted from the mice shown in panel B. (D) Comparison of the IFN-γ responses in mice vaccinated with DNA.COMB targeting the regions included in the HTI (grey bars) and the total IFN-γ specific response to peptide pools spanning the complete Gag, Pol, NTV. (E) Distribution of HTI-specific induced IFN-γ responses against Gag, Pol, Vif and Nef in mice from panel B is shown (DNA.HTI in mice 1–5; DNA.COMB in mice 6–10) using peptide pools spanning the protein sequences included in HTI. (F) Binding antibodies to Gag were detected by Western immunoblot. The membranes contain Gag proteins from HEK293 cells transfected with 1 μg of p55gag plasmid producing the unprocessed p55gag protein or transfected with a Gag-Prt plasmid expressing p55gag, the processing intermediate p37gag (p24gag and p17gag) and processed p24gag proteins. Membranes were probed with human sera from an HIV-infected individual or pooled plasma from mice immunized with 20 μg of DNA.HTI and DNA.COMB (at a 1:100 dilution). (G) Anti-HIV-1 p24gag antibodies were measured in pooled plasma from DNA.HTI and DNA.COMB vaccinated C57BL/6 mice by a standard clade B p24gag ELISA. The graph shows absorbance (optical density, OD).
Figure 4
Figure 4
HTI responses are boosted by MVA.HTI vaccination. (A) Vaccination schedule of mice (n = 6/group) vaccinated with different prime/boost regimens including: 2xDNA (DD), 3xDNA (DDD), 4xDNA (DDDD); DNA prime followed by MVA boost (DDM and DDDM). 147 peptides (15-mers, overlapping by 11 residues) spanning the entire HTI sequence (including the leader sequence and linkers regions) were used in an IFN-γ ELISPOT assay to assess immunogenicity of the different regimens. Data from 1 animal in the DD group was not evaluated due to high background result in the ELISPOT assay. Breadth (B) and magnitude (C-E) of induced HTI-specific IFN-γ responses in different groups of mice to a set of 16 peptide pools spanning the different protein segments is shown either as total HTI-specific responses (C, D) or as response to individual proteins (E). Bars represent median values. Median with interquartile range is shown in panel E. Panel D is an independent mouse experiment conducted to compare responses after DDD, DDDD and DDDM vaccination.
Figure 5
Figure 5
HTI vaccine induces robust memory T cell responses in rhesus macaques. (A) Vaccination schedule. Four macaques (R678, R679, R680, R681) were vaccinated 3x (0, 1, 3 months) with DNA.HTI and IL-12 DNA and subsequently with two MVA.HTI boosts. Cellular immune responses were measured by intracellular cytokine staining after the different vaccinations as indicated. (B) The frequency of HTI-specific IFN-γ+ T cells was measured after the DNA vaccinations using peptide pools covering the complete HTI sequence. The HTI-specific CD4+ (open bars) and CD8+ (filled bars) T cells are shown for each animal as number of reactive peptide pools. (C) The frequencies of HTI-specific IFN-γ+ T cells with central memory (CM; CD28+CD95+) and effector memory (EM; CD28CD95+) phenotype are shown over the course of the study.
Figure 6
Figure 6
HTI vaccine induces T cell responses with cytotoxic potential. HTI-specific IFN-γ+ CD8+ (A) and CD4+ (B) subsets of T cells harboring granzyme B (GzmB) and/or expressing CD107a are shown for each animal.
Figure 7
Figure 7
Breadth of HTI-specific T cell responses in vaccinated macaques. Mapping of HTI-specific T cell responses after the 3rd DNA prime and 1st and 2nd MVA boost using peptide pools covering each segment (S1-S16). The percentage of IFN-γ+ CD4+ (open bars) and CD8+ (filled bars) T cells specific for each segment is shown. For a summary of data see Table 7. Asterisk denotes new responses emerging after MVA boost vaccination.
Figure 8
Figure 8
Humoral responses in HTI vaccinated macaques. (A) Binding antibodies to HTI were detected by Western immunoblot. The membranes contain enriched HTI-FLAG proteins from HEK293 cells. The membranes were probed with plasma (at a 1:100 dilution) from individual macaques collected at 2 weeks after 3rd DNA.HTI (DDD) and 1st MVA.HTI (M) boost. (B) Anti-HIV-1 p24gag antibodies were measured in different plasma samples, including pre-immune, after DNA.HTI and after MVA.HTI vaccinations of macaque R678 by a standard p24gag ELISA. The graph shows absorbance (optical density, OD).

Similar articles

Cited by

References

    1. Brander C, Frahm N, Walker BD. The challenges of host and viral diversity in HIV vaccine design. Curr Opin Immunol. 2006;18:430–7. doi: 10.1016/j.coi.2006.05.012. - DOI - PubMed
    1. Zuñiga R, Lucchetti A, Galvan P, Sanchez S, Sanchez C, Hernandez A, et al. Relative dominance of Gag p24-specific cytotoxic T lymphocytes is associated with human immunodeficiency virus control. J Virol. 2006;80:3122–5. doi: 10.1128/JVI.80.6.3122-3125.2006. - DOI - PMC - PubMed
    1. Frahm N, Kiepiela P, Adams S, Linde CH, Hewitt HS, Sango K, et al. Control of human immunodeficiency virus replication by cytotoxic T lymphocytes targeting subdominant epitopes. Nat Immunol. 2006;7:173–8. doi: 10.1038/ni1281. - DOI - PubMed
    1. Kiepiela P, Ngumbela K, Thobakgale C, Ramduth D, Honeyborne I, Moodley E, et al. CD8+ T-cell responses to different HIV proteins have discordant associations with viral load. Nat Med. 2007;13:46–53. doi: 10.1038/nm1520. - DOI - PubMed
    1. Janes H, Friedrich DP, Krambrink A, Smith RJ, Kallas EG, Horton H, et al. Vaccine-induced gag-specific T cells are associated with reduced viremia after HIV-1 infection. J Infect Dis. 2013;208:1231–9. doi: 10.1093/infdis/jit322. - DOI - PMC - PubMed

Publication types

MeSH terms