

Proteome mapping of epidermal growth factor induced hepatocellular carcinomas identifies novel cell metabolism targets and mitogen activated protein kinase signalling events
- PMID: 25872475
- PMCID: PMC4357185
- DOI: 10.1186/s12864-015-1312-z
Proteome mapping of epidermal growth factor induced hepatocellular carcinomas identifies novel cell metabolism targets and mitogen activated protein kinase signalling events
Abstract
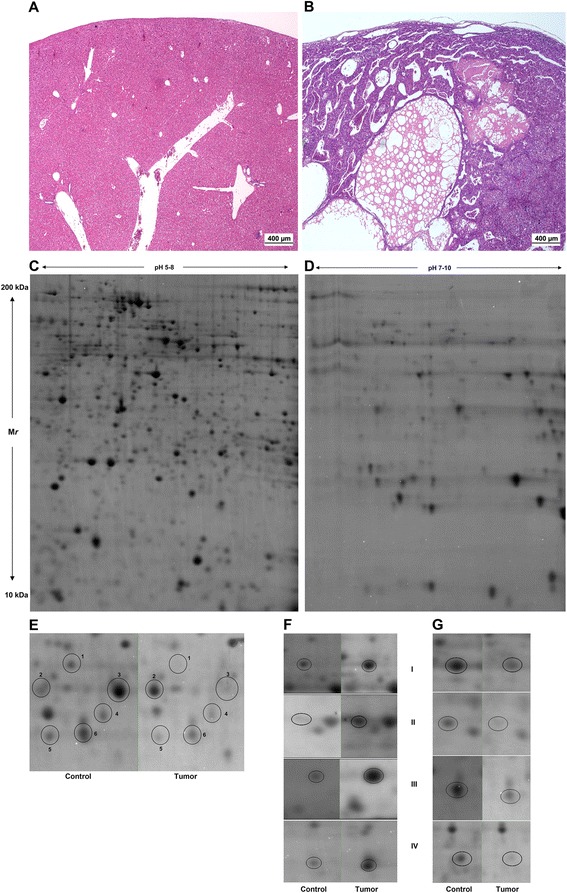
Background: Hepatocellular carcinoma (HCC) is on the rise and the sixth most common cancer worldwide. To combat HCC effectively research is directed towards its early detection and the development of targeted therapies. Given the fact that epidermal growth factor (EGF) is an important mitogen for hepatocytes we searched for disease regulated proteins to improve an understanding of the molecular pathogenesis of EGF induced HCC. Disease regulated proteins were studied by 2DE MALDI-TOF/TOF and a transcriptomic approach, by immunohistochemistry and advanced bioinformatics.
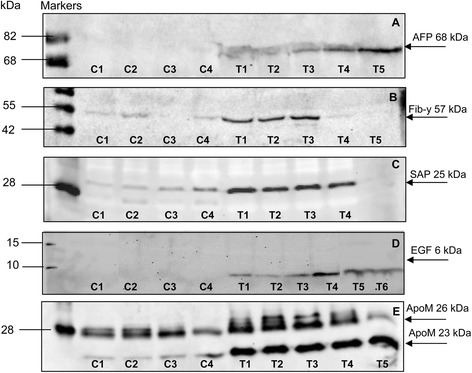
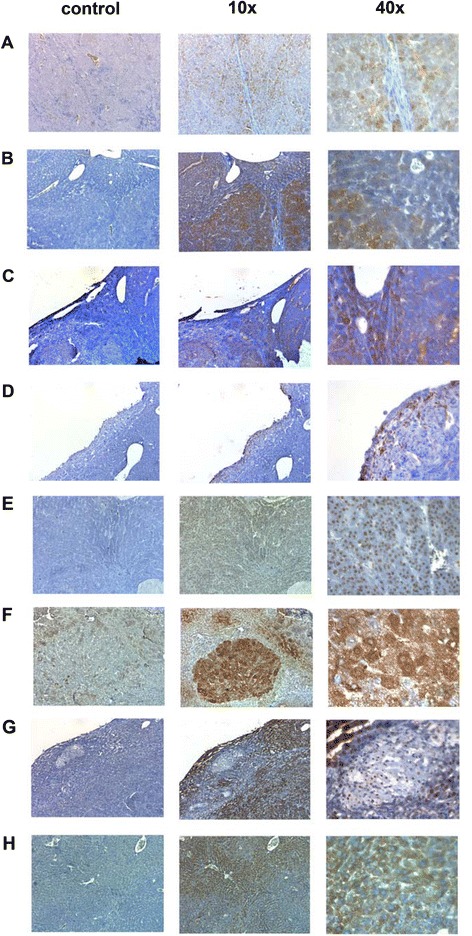
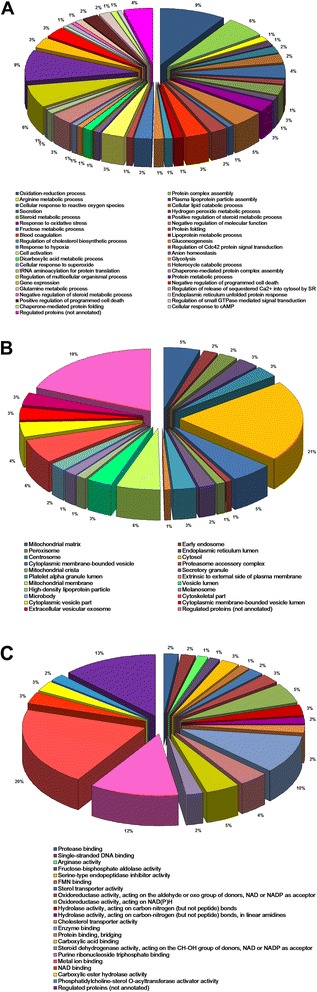
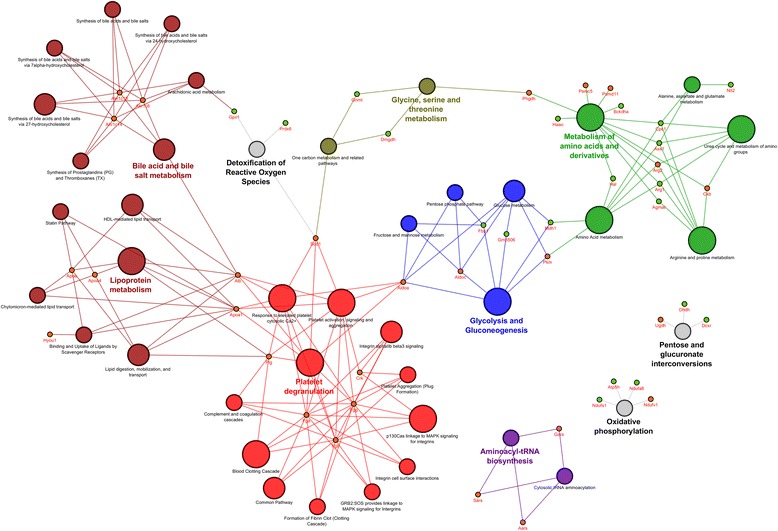
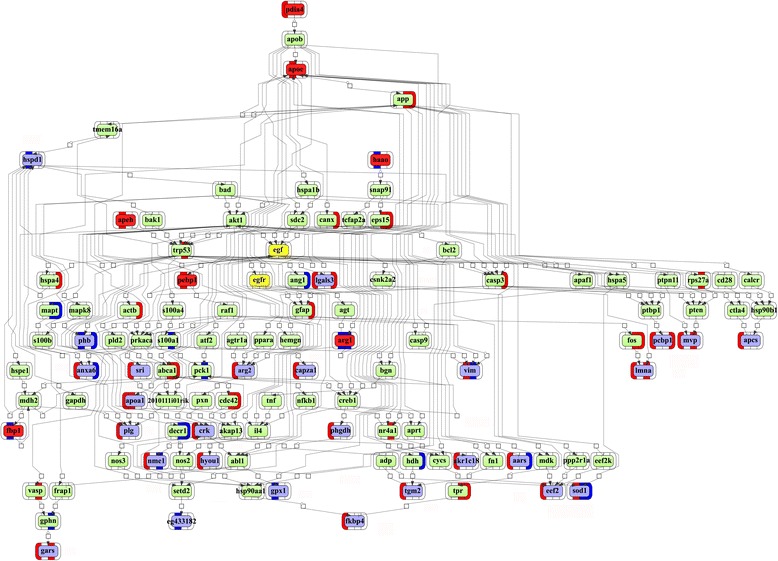
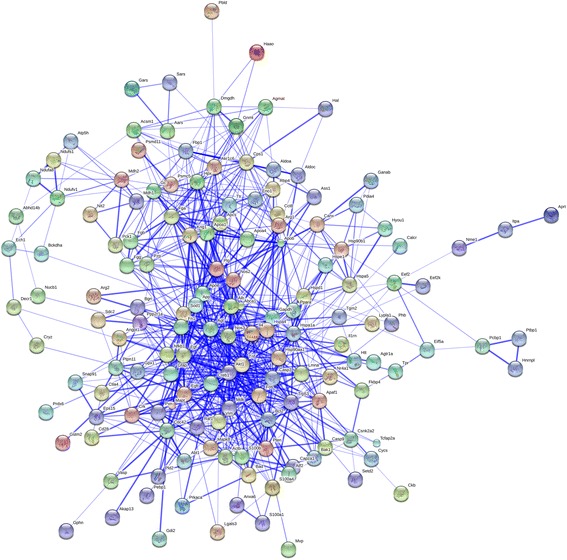
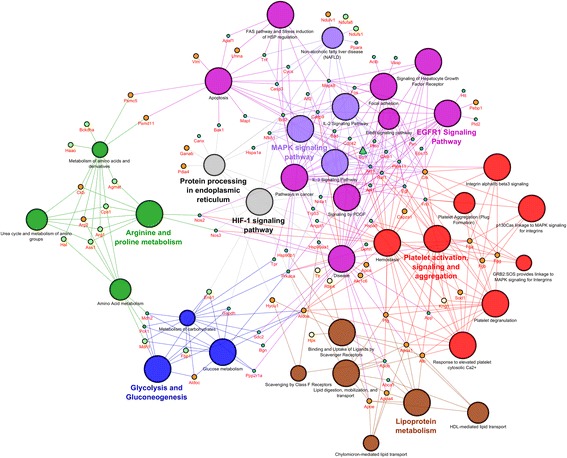
Results: Mapping of EGF induced liver cancer in a transgenic mouse model identified n = 96 (p < 0.05) significantly regulated proteins of which n = 54 were tumour-specific. To unravel molecular circuits linked to aberrant EGFR signalling diverse computational approaches were employed and this defined n = 7 key nodes using n = 82 disease regulated proteins for network construction. STRING analysis revealed protein-protein interactions of > 70% disease regulated proteins with individual proteins being validated by immunohistochemistry. The disease regulated network proteins were mapped to distinct pathways and bioinformatics provided novel insight into molecular circuits associated with significant changes in either glycolysis and gluconeogenesis, argine and proline metabolism, protein processing in endoplasmic reticulum, Hif- and MAPK signalling, lipoprotein metabolism, platelet activation and hemostatic control as a result of aberrant EGF signalling. The biological significance of the findings was corroborated with gene expression data derived from tumour tissues to evntually define a rationale by which tumours embark on intriguing changes in metabolism that is of utility for an understanding of tumour growth. Moreover, among the EGF tumour specific proteins n = 11 were likewise uniquely expressed in human HCC and for n = 49 proteins regulation in human HCC was confirmed using the publically available Human Protein Atlas depository, therefore demonstrating clinical significance.
Conclusion: Novel insight into the molecular pathogenesis of EGF induced liver cancer was obtained and among the 37 newly identified proteins several are likely candidates for the development of molecularly targeted therapies and include the nucleoside diphosphate kinase A, bifunctional ATP-dependent dihydroyacetone kinase and phosphatidylethanolamine-binding protein1, the latter being an inhibitor of the Raf-1 kinase.
Figures

Similar articles
-
Combined serum and tissue proteomic study applied to a c-Myc transgenic mouse model of hepatocellular carcinoma identified novel disease regulated proteins suitable for diagnosis and therapeutic intervention strategies.J Proteome Res. 2011 Jul 1;10(7):3012-30. doi: 10.1021/pr101207t. Epub 2011 Jun 6. J Proteome Res. 2011. PMID: 21644509
-
EGF is highly expressed in hepatocellular carcinoma (HCC) and promotes motility of HCC cells via fibronectin.J Cell Biochem. 2018 May;119(5):4170-4183. doi: 10.1002/jcb.26625. Epub 2018 Jan 23. J Cell Biochem. 2018. PMID: 29315755
-
Epidermal growth factor-induced hepatocellular carcinoma: gene expression profiles in precursor lesions, early stage and solitary tumours.Oncogene. 2005 Mar 10;24(11):1809-19. doi: 10.1038/sj.onc.1208196. Oncogene. 2005. PMID: 15674348
-
Pleiotropic effects of methionine adenosyltransferases deregulation as determinants of liver cancer progression and prognosis.J Hepatol. 2013 Oct;59(4):830-41. doi: 10.1016/j.jhep.2013.04.031. Epub 2013 May 7. J Hepatol. 2013. PMID: 23665184 Review.
-
Focal Adhesion Kinase: Insight into Molecular Roles and Functions in Hepatocellular Carcinoma.Int J Mol Sci. 2017 Jan 5;18(1):99. doi: 10.3390/ijms18010099. Int J Mol Sci. 2017. PMID: 28067792 Free PMC article. Review.
Cited by
-
Differentially expressed serum host proteins in hepatitis B and C viral infections.Virusdisease. 2018 Dec;29(4):468-477. doi: 10.1007/s13337-018-0484-y. Epub 2018 Sep 1. Virusdisease. 2018. PMID: 30539049 Free PMC article.
-
Metabolic profiling of triple-negative breast cancer cells reveals metabolic vulnerabilities.Cancer Metab. 2017 Aug 22;5:6. doi: 10.1186/s40170-017-0168-x. eCollection 2017. Cancer Metab. 2017. PMID: 28852500 Free PMC article.
-
Identification of a multienzyme complex for glucose metabolism in living cells.J Biol Chem. 2017 Jun 2;292(22):9191-9203. doi: 10.1074/jbc.M117.783050. Epub 2017 Apr 19. J Biol Chem. 2017. PMID: 28424264 Free PMC article.
-
Butein Inhibited In Vitro Hexokinase-2-Mediated Tumor Glycolysis in Hepatocellular Carcinoma by Blocking Epidermal Growth Factor Receptor (EGFR).Med Sci Monit. 2018 May 19;24:3283-3292. doi: 10.12659/MSM.906528. Med Sci Monit. 2018. PMID: 29777095 Free PMC article.
-
Peptide-tiling screens of cancer drivers reveal oncogenic protein domains and associated peptide inhibitors.Cell Syst. 2021 Jul 21;12(7):716-732.e7. doi: 10.1016/j.cels.2021.05.002. Epub 2021 May 28. Cell Syst. 2021. PMID: 34051140 Free PMC article.
References
-
- Cha C, DeMatteo RP, Blumgart LH. Surgery and ablative therapy for hepatocellular carcinoma. J Clin Gastroenterol. 2002;35:S130–7. - PubMed
-
- Gazzana G, Borlak J. Improved method for proteome mapping of the liver by 2-DE MALDI-TOF MS. J Proteome Res. 2007;6:3143–51. - PubMed
-
- Melle C, Ernst G, Scheibner O, Kaufmann R, Schimmel B, Bleul A, et al. Identification of specific protein markers in microdissected hepatocellular carcinoma. J Proteome Res. 2007;6:306–15. - PubMed
-
- Izzo F, Cremona F, Delrio P, Leonardi E, Castello G, Pignata S, et al. Soluble interleukin-2 receptor levels in hepatocellular cancer: a more sensitive marker than alfa fetoprotein. Ann Surg Oncol. 1999;6:178–85. - PubMed
-
- Wilhelm S, Carter C, Lynch M, Lowinger T, Dumas J, Smith RA, et al. Discovery and development of sorafenib: a multikinase inhibitor for treating cancer. Nat Rev Drug Discov. 2006;5:835–44. - PubMed
Publication types
MeSH terms
Substances
LinkOut - more resources
Full Text Sources
Other Literature Sources
Medical
Research Materials
Miscellaneous
