

Macrophage Polarization during Murine Lyme Borreliosis
- PMID: 25870230
- PMCID: PMC4468556
- DOI: 10.1128/IAI.00369-15
Macrophage Polarization during Murine Lyme Borreliosis
Abstract
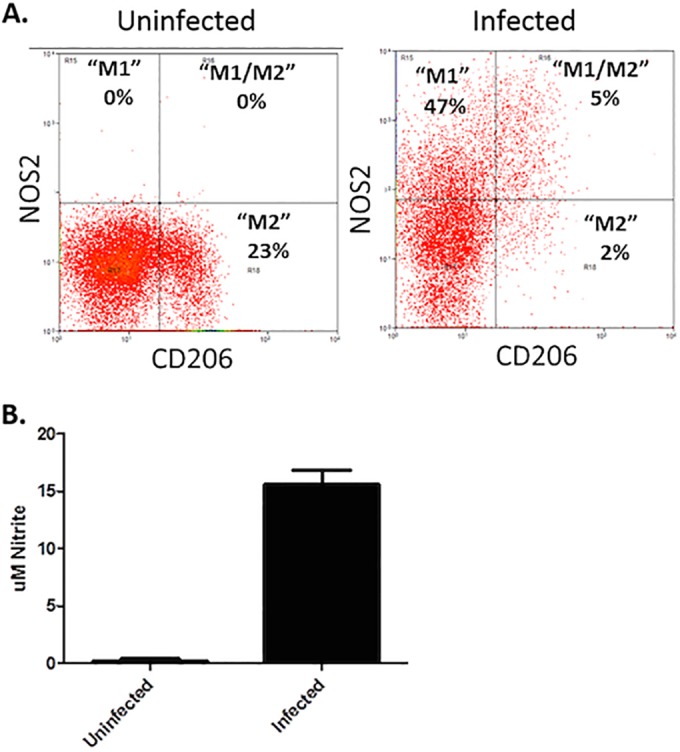
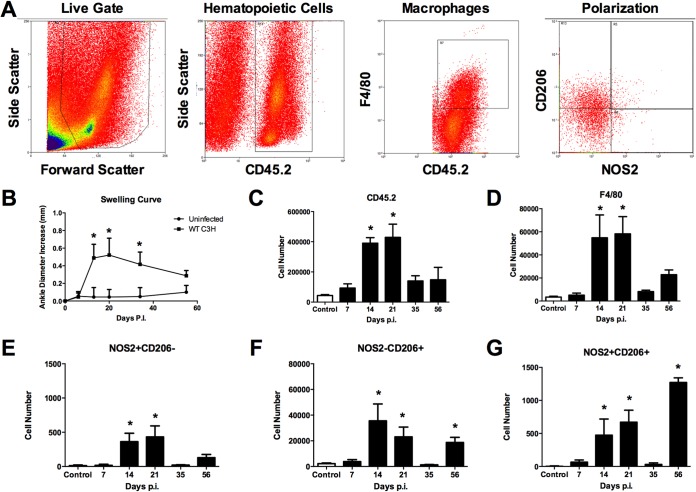
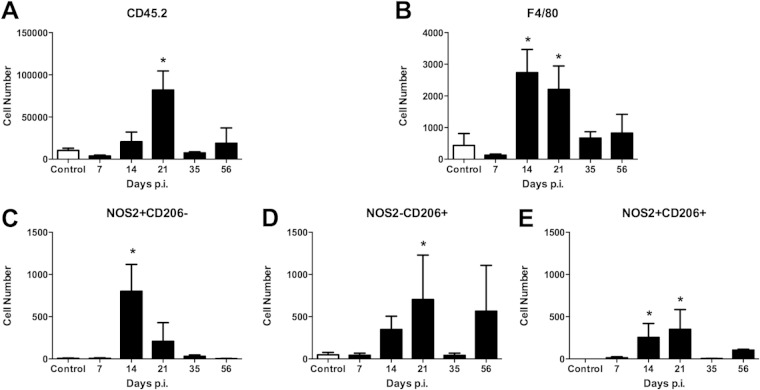
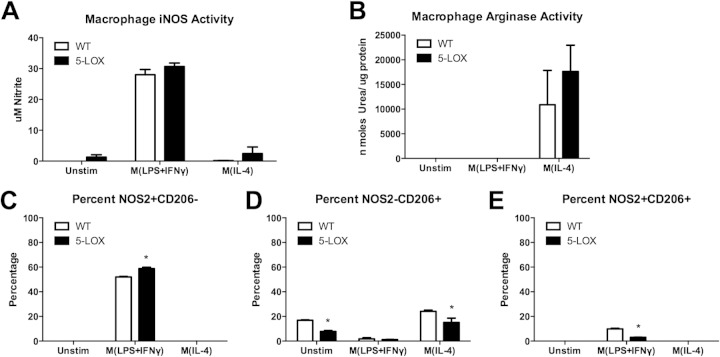
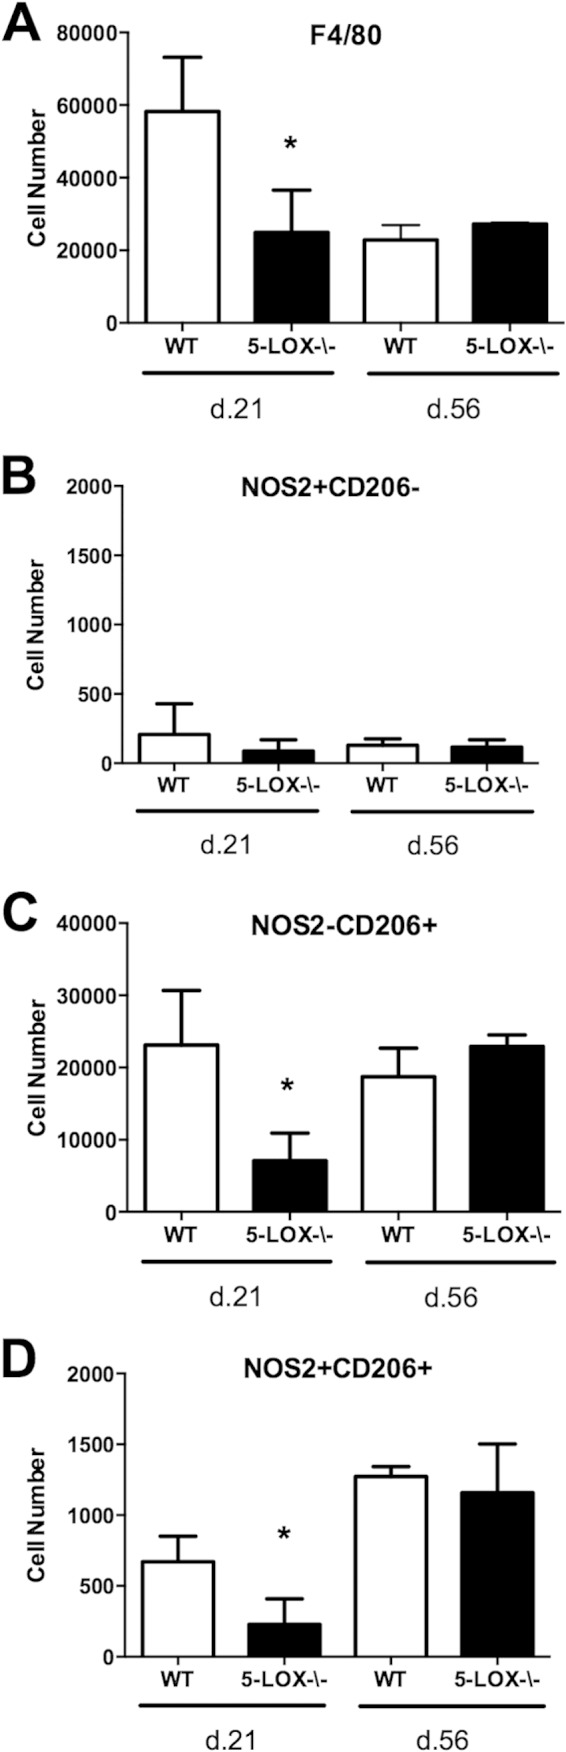
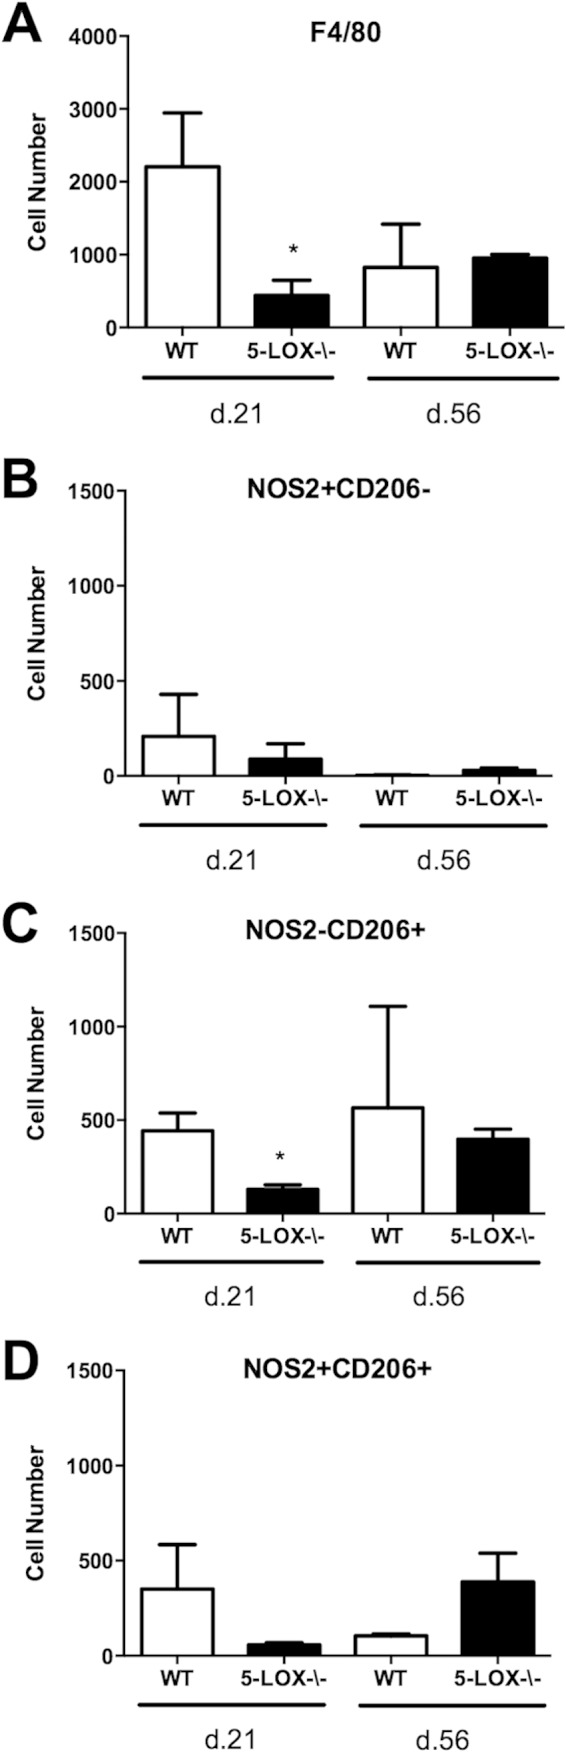
Infection of C3H mice with Borrelia burgdorferi, the causative agent of Lyme disease, reliably produces an infectious arthritis and carditis that peak around 3 weeks postinfection and then spontaneously resolve. Macrophage polarization has been suggested to drive inflammation, the clearance of bacteria, and tissue repair and resolution in a variety of infectious disease models. During Lyme disease it is clear that macrophages are capable of clearing Borrelia spirochetes and exhausted neutrophils; however, the role of macrophage phenotype in disease development or resolution has not been studied. Using classical (NOS2) and alternative (CD206) macrophage subset-specific markers, we determined the phenotype of F4/80(+) macrophages within the joints and heart throughout the infection time course. Within the joint, CD206(+) macrophages dominated throughout the course of infection, and NOS2(+) macrophage numbers became elevated only during the peak of inflammation. We also found dual NOS2(+) CD206(+) macrophages which increased during resolution. In contrast to findings for the ankle joints, numbers of NOS2(+) and CD206(+) macrophages in the heart were similar at the peak of inflammation. 5-Lipoxygenase-deficient (5-LOX(-/-)) mice, which display a failure of Lyme arthritis resolution, recruited fewer F4/80(+) cells to the infected joints and heart, but macrophage subset populations were unchanged. These results highlight differences in the inflammatory infiltrates during Lyme arthritis and carditis and demonstrate the coexistence of multiple macrophage subsets within a single inflammatory site.
Copyright © 2015, American Society for Microbiology. All Rights Reserved.
Figures
Similar articles
-
Recruitment of macrophages and polymorphonuclear leukocytes in Lyme carditis.Infect Immun. 2007 Feb;75(2):613-20. doi: 10.1128/IAI.00685-06. Epub 2006 Nov 13. Infect Immun. 2007. PMID: 17101663 Free PMC article.
-
5-Lipoxygenase-deficient mice infected with Borrelia burgdorferi develop persistent arthritis.J Immunol. 2011 Mar 1;186(5):3076-84. doi: 10.4049/jimmunol.1003473. Epub 2011 Jan 26. J Immunol. 2011. PMID: 21270404 Free PMC article.
-
Infection of Interleukin 17 Receptor A-Deficient C3H Mice with Borrelia burgdorferi Does Not Affect Their Development of Lyme Arthritis and Carditis.Infect Immun. 2015 Jul;83(7):2882-8. doi: 10.1128/IAI.00533-15. Epub 2015 May 4. Infect Immun. 2015. PMID: 25939508 Free PMC article.
-
Hamster and murine models of severe destructive Lyme arthritis.Clin Dev Immunol. 2012;2012:504215. doi: 10.1155/2012/504215. Epub 2012 Feb 22. Clin Dev Immunol. 2012. PMID: 22461836 Free PMC article. Review.
-
Mechanisms of Borrelia burgdorferi internalization and intracellular innate immune signaling.Front Cell Infect Microbiol. 2014 Dec 15;4:175. doi: 10.3389/fcimb.2014.00175. eCollection 2014. Front Cell Infect Microbiol. 2014. PMID: 25566512 Free PMC article. Review.
Cited by
-
Hacking the host: exploitation of macrophage polarization by intracellular bacterial pathogens.Pathog Dis. 2020 Feb 1;78(1):ftaa009. doi: 10.1093/femspd/ftaa009. Pathog Dis. 2020. PMID: 32068828 Free PMC article. Review.
-
Immune Response to Borrelia: Lessons from Lyme Disease Spirochetes.Curr Issues Mol Biol. 2021;42:145-190. doi: 10.21775/cimb.042.145. Epub 2020 Dec 8. Curr Issues Mol Biol. 2021. PMID: 33289684 Free PMC article.
-
Clinical Characterization of Host Response to Simian Hemorrhagic Fever Virus Infection in Permissive and Refractory Hosts: A Model for Determining Mechanisms of VHF Pathogenesis.Viruses. 2019 Jan 15;11(1):67. doi: 10.3390/v11010067. Viruses. 2019. PMID: 30650570 Free PMC article.
-
Azlocillin can be the potential drug candidate against drug-tolerant Borrelia burgdorferi sensu stricto JLB31.Sci Rep. 2020 Mar 2;10(1):3798. doi: 10.1038/s41598-020-59600-4. Sci Rep. 2020. PMID: 32123189 Free PMC article.
-
Inositol hexaphosphate modulates the behavior of macrophages through alteration of gene expression involved in pathways of pro- and anti-inflammatory responses, and resolution of inflammation pathways.Food Sci Nutr. 2021 Apr 10;9(6):3240-3249. doi: 10.1002/fsn3.2286. eCollection 2021 Jun. Food Sci Nutr. 2021. PMID: 34136188 Free PMC article.
References
-
- Murray PJ, Allen JE, Biswas SK, Fisher EA, Gilroy DW, Goerdt S, Gordon S, Hamilton JA, Ivashkiv LB, Lawrence T, Locati M, Mantovani A, Martinez FO, Mege JL, Mosser DM, Natoli G, Saeij JP, Schultze JL, Shirey KA, Sica A, Suttles J, Udalova I, van Ginderachter JA, Vogel SN, Wynn TA. 2014. Macrophage activation and polarization: nomenclature and experimental guidelines. Immunity 41:14–20. doi:10.1016/j.immuni.2014.06.008. - DOI - PMC - PubMed
-
- Erwig L-P, Kluth DC, Walsh GM, Rees AJ. 1998. Initial cytokine exposure determines function of macrophages and renders them unresponsive to other cytokines. J Immunol 161:1983–1988. - PubMed
Publication types
MeSH terms
Substances
LinkOut - more resources
Full Text Sources
Medical
Molecular Biology Databases
