. 2015 Apr 13;209(1):47-58.
doi: 10.1083/jcb.201409087.

Microtubule minus end motors kinesin-14 and dynein drive nuclear congression in parallel pathways

Affiliations

Microtubule minus end motors kinesin-14 and dynein drive nuclear congression in parallel pathways

Kathleen Scheffler et al. J Cell Biol. .

Abstract

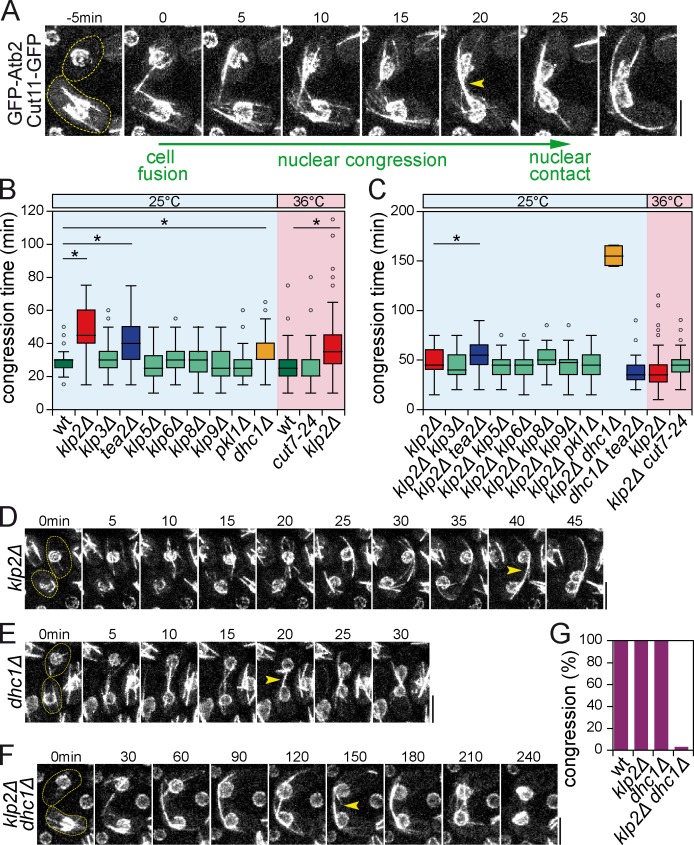
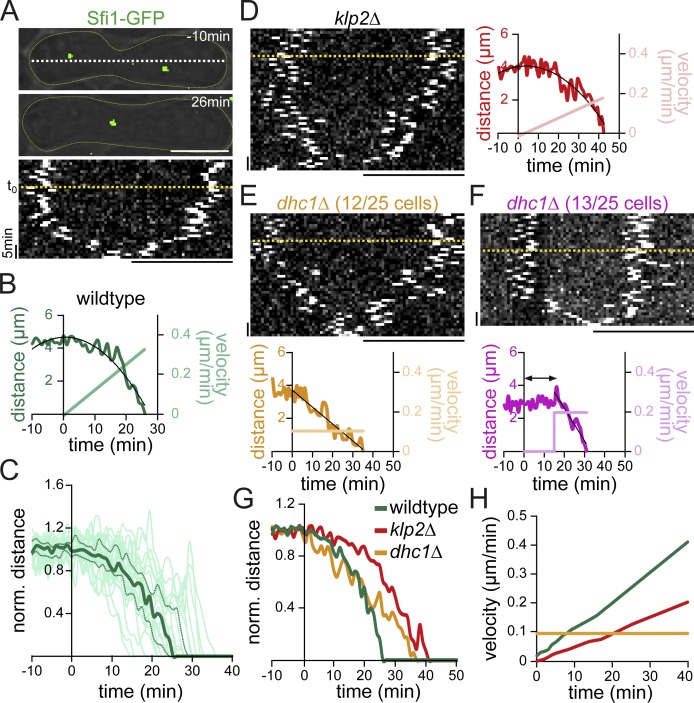
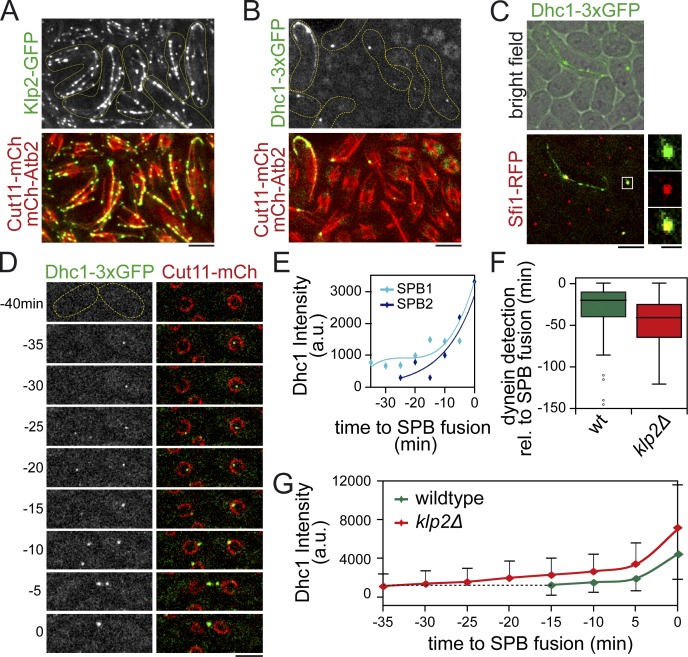
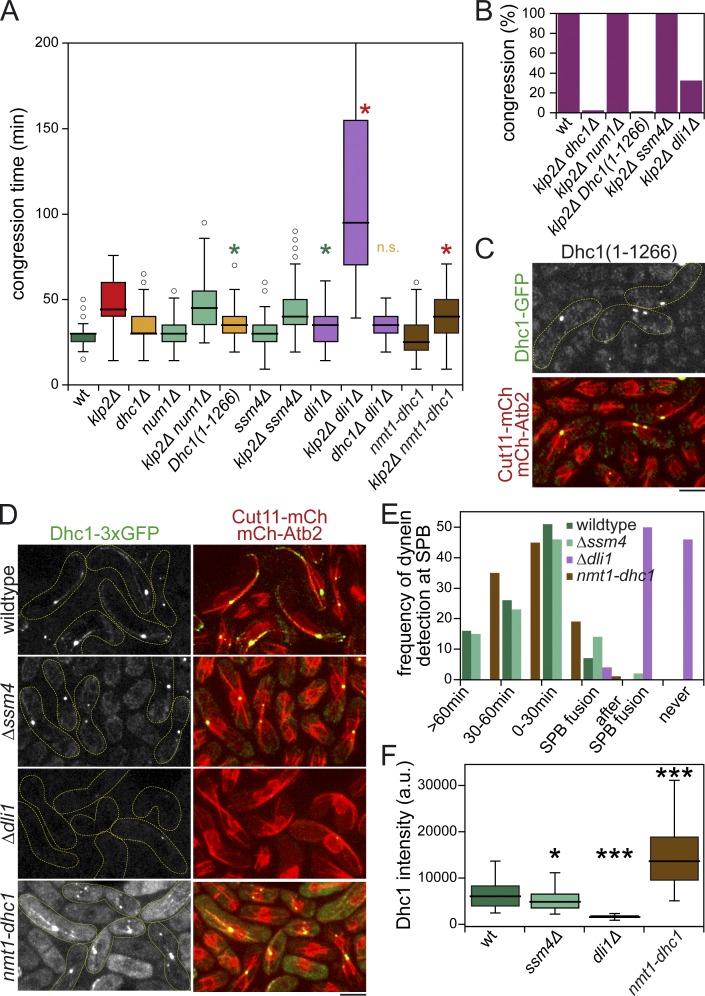
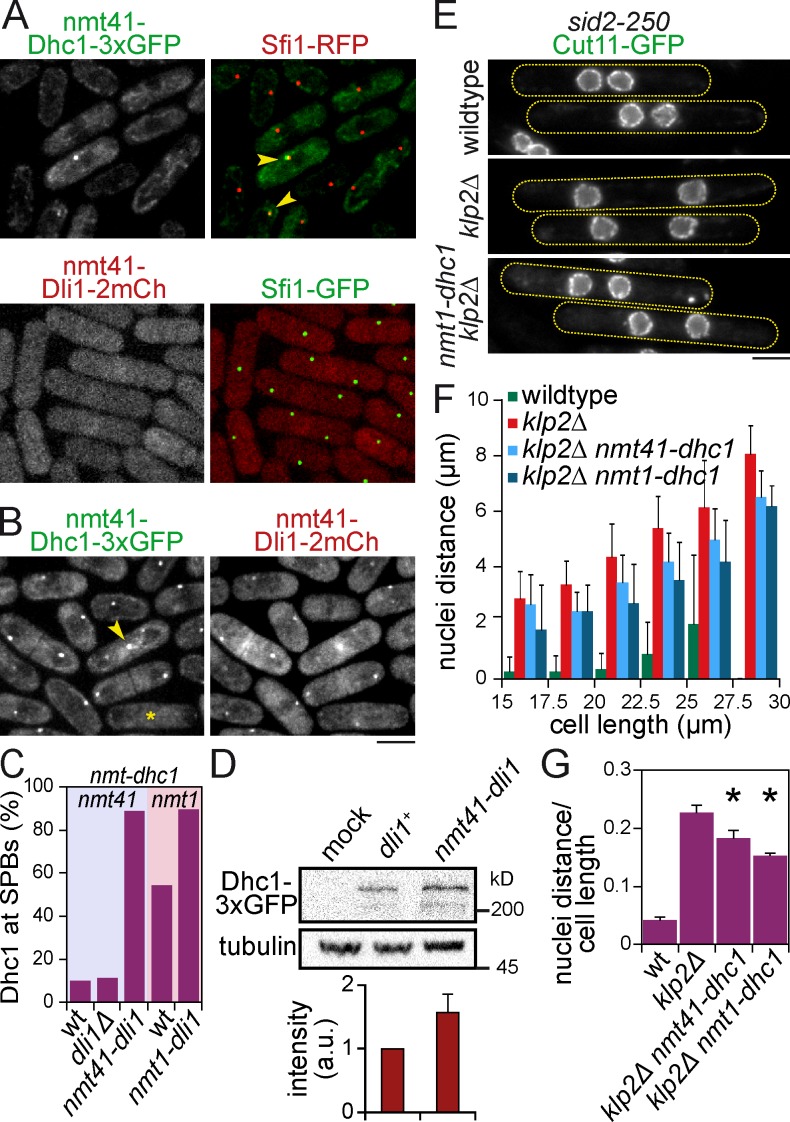
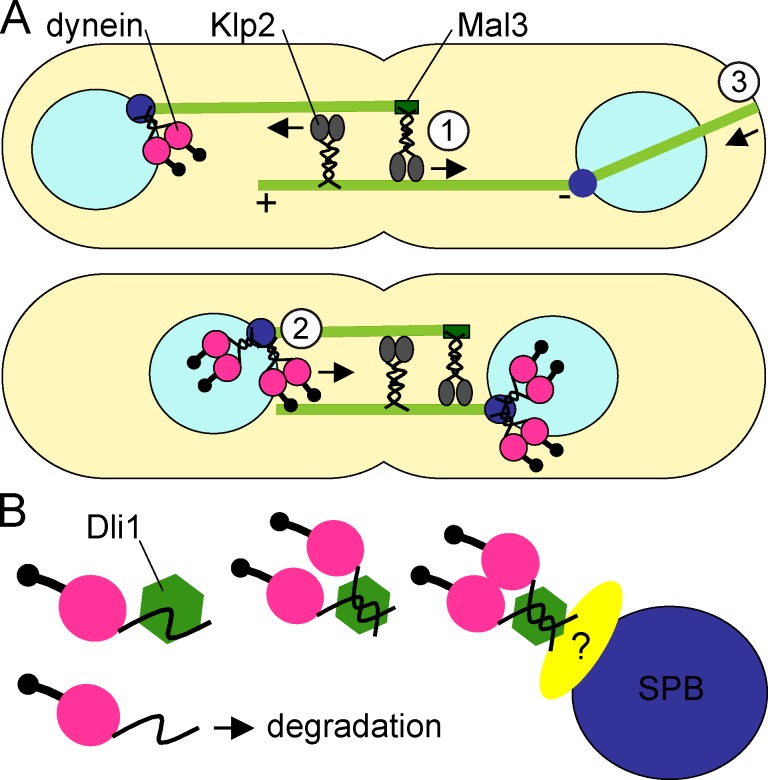
Microtubules (MTs) and associated motors play a central role in nuclear migration, which is crucial for diverse biological functions including cell division, polarity, and sexual reproduction. In this paper, we report a dual mechanism underlying nuclear congression during fission yeast karyogamy upon mating of haploid cells. Using microfluidic chambers for long-term imaging, we captured the precise timing of nuclear congression and identified two minus end-directed motors operating in parallel in this process. Kinesin-14 Klp2 associated with MTs may cross-link and slide antiparallel MTs emanating from the two nuclei, whereas dynein accumulating at spindle pole bodies (SPBs) may pull MTs nucleated from the opposite SPB. Klp2-dependent nuclear congression proceeds at constant speed, whereas dynein accumulation results in an increase of nuclear velocity over time. Surprisingly, the light intermediate chain Dli1, but not dynactin, is required for this previously unknown function of dynein. We conclude that efficient nuclear congression depends on the cooperation of two minus end-directed motors.


Figures

Figure 1.
Figure 1.
Klp2 and dynein perform nuclear congression in a parallel manner. (A) Time-lapse images recorded by spinning-disk confocal microscopy of cells expressing Cut11-GFP (nuclear envelope) and unilaterally GFP-Atb2 (MTs) in wild-type cells at 25°C undergoing nuclear congression. Images are presented as maximum projections of 3D stacks. Dotted lines represent cell outlines. Yellow arrowheads highlight the MT bundle formed between two nuclei. Nuclear congression was defined as the duration between cell fusion (t0) and contact between nuclei. (B) Box plot shows the time of nuclear congression in wild type and single motor mutants at 25°C or 36°C. Mean values for strains tested at 25°C: wild type (wt; 29 ± 7 min, n = 104), klp2Δ (48 ± 13 min, P < 10−22, n = 84), klp3Δ (31 ± 10 min, P = 0.06, n = 76), tea2Δ (42 ± 15 min, P < 10−11, n = 94), klp5Δ (28 ± 9 min, P = 0.38, n = 84), klp6Δ (29 ± 8 min, P = 0.63, n = 78), klp8Δ (29 ± 9 min, P = 0.89, n = 60), klp9Δ (27 ± 9 min, P = 0.39, n = 69), pkl1Δ (27 ± 8 min, P = 0.24, n = 75), and dhc1Δ (34 ± 9 min, P < 10−4, n = 87). Mean values for strains tested at 36°C: wild type (26 ± 11 min, n = 54), cut7-24 (24 ± 10 min, P = 0.29, n = 89), and klp2Δ (42 ± 22 min, P < 10−4, n = 44). (C) Box plot shows the time of nuclear congression klp2Δ double motor mutants at 25°C or 36°C. Mean values for strains tested at 25°C (p-value against klp2Δ): klp2Δ klp3Δ (45 ± 13 min, P = 2, n = 75), klp2Δ tea2Δ (54 ± 16 min, P = 0.015, n = 49), klp2Δ klp5Δ (44 ± 10 min, P = 0.07, n = 73), klp2Δ klp6Δ (44 ± 13 min, P = 0.07, n = 69), klp2Δ klp8Δ (50 ± 12 min, P = 0.26, n = 58), klp2Δ klp9Δ (47 ± 13 min, P = 0.68, n = 74), klp2Δ pkl1Δ (46 ± 13 min, P = 0.31, n = 74), klp2Δ dhc1Δ (155 ± 14 min, n = 2), and dhc1Δ tea2Δ (38 ± 14 min, n = 67). Mean values for strains tested at 36°C: klp2Δ cut7-24 (46 ± 14 min, P = 0.33, n = 60). For the box plots, each box encloses 50% of the data with the median values displayed as lines. The top and bottom of each box mark the minimum and maximum values within the dataset that fall within an acceptable range. Any value outside of this range, called an outlier, is displayed as an individual point. (D–F) Time-lapse images of mating cells expressing Cut11-GFP and unilaterally GFP-Atb2 in klp2Δ (D), dhc1Δ (E), or klp2Δ dhc1Δ (F) strains at 25°C. (G) Percentage of zygotes completing nuclear congression in wild type (100%, n = 104), klp2Δ (100%, n = 84), dhc1Δ (100%, n = 87), and klp2Δ dhc1Δ (2%, n = 85). Bars, 5 µm. *, P < 0.01. n were collected from 2–3 independent experiments.
Figure 2.
Figure 2.
Klp2 constantly generates pulling forces, whereas dynein contribution increases during nuclear congression. (A, top) Overlay of differential interference contrast and fluorescence images of the SPB marker Sfi1-GFP shown for an individual zygote at 10 min before cell fusion (defined by cytoplasmic diffusion of mCherry-Atb2) until completion of nuclear congression at 26 min after cell fusion. Sfi1-GFP images were taken as 3D stacks at 1-min intervals. Dotted lines represent cell outlines. Dotted white line represents the line used to make the kymograph. (bottom) Kymograph representing Sfi1-GFP dynamics from −10 min until SPBs are juxtaposed. Yellow dotted lines indicate moment of cell fusion (t0). (B) SPB distance and velocity over time from individual example shown in A. Velocity obtained from a differential function of a second degree polynomial (black line) of SPB distances. (C) SPB distances over time normalized for each cell to mean SPB distance before cell fusion calculated from first 10 time points. Individual cells are depicted as light green trajectories (n = 25). Median is represented as a thick line, and upper and lower quartiles are shown as dotted lines. (D, left) Kymograph of Sfi1-GFP dynamics in an individual klp2Δ zygote. (right) SPB distances and velocity over time. Black line represents second degree polynomial function as approximation for SPB distance. (E) Sfi1-GFP dynamics in a subset of dhc1Δ zygotes (12/25 cells) depicted as kymograph (top) or as a function over time (bottom). Velocity obtained from a differential function of a linear regression (black line) of SPB distances. (F) Sfi1-GFP dynamics in a second subset of dhc1Δ zygotes (13/25 cells). Initial period without directed nuclear movement is highlighted. Velocity obtained from a differential function of a linear regression (black line) of SPB distances after initial period. (G and H) Median curves of normalized SPB distances (G) or velocities (H) over time in wild-type, klp2Δ, and a subset of dhc1Δ zygotes. Bars, 5 µm. n were collected from two independent experiments.
Figure 3.
Figure 3.
Distinct localization pattern of Klp2 and dynein during nuclear congression. (A) Cellular distribution of Klp2-GFP in mating cells coexpressing Cut11-mCherry and mCherry-Atb2 at 25°C. Images are represented as maximum z projection of 3D stacks. Dotted lines represent outlines of cells in different stages of meiotic prophase. (B) Cellular distribution of dynein (Dhc1-3×GFP) in mating cells coexpressing Cut11-mCherry and mCherry-Atb2 at 25°C. (C) Colocalization of Dhc1-3×GFP and Sfi1-RFP. Insets show magnified regions of the boxed area. (D) Time-lapse images of Dhc1-3×GFP in mating cells coexpressing Cut11-mCherry spanning time point of initial detection of dynein (−35 min) in one cell until SPB fusion (t = 0). (E) SPB intensities of Dhc1-3×GFP in individual cells depicted in D over time until completion of nuclear congression (SPB fusion; t0). Line represents the moving average best fit to the data points. (F) Box plot shows median time of initial detection of dynein in mating cells before SPB fusion in wild-type and klp2Δ zygotes. Mean values for wild type (wt; 31 ± 29 min) and klp2Δ (49 ± 28 min, P < 10−5) for n = 100 SPBs. For the box plots, each box encloses 50% of the data with the median values displayed as lines. The top and bottom of each box mark the minimum and maximum values within the dataset that fall within an acceptable range. Any value outside of this range, called an outlier, is displayed as an individual point. (G) Mean SPB intensities of Dhc1-3×GFP averaged for a cell population (n = 100 SPBs) from 15 min (for wild type) or 35 min (for klp2Δ) before SPB fusion. Error bars: SD. Dotted line highlights similar dynein level between wild-type and klp2Δ zygotes. n were collected from three independent experiments. a.u., arbitrary unit. Bars: (main images) 5 µm; (insets) 1 µm.
Figure 4.
Figure 4.
Dynein functions at the SPB during nuclear congression independent of the dynactin complex. (A) Box plot shows time of nuclear congression in wild-type and dynein-related single and klp2Δ double mutants at 25°C. Mean values (p-values against wild type or klp2Δ, respectively): wild type (29 ± 7 min, n = 104), klp2Δ (48 ± 13 min, P < 10−22, n = 84), dhc1Δ (34 ± 9 min, P < 10−4, n = 87), num1Δ (31 ± 9 min, P = 0.09, n = 58), klp2Δ num1Δ (48 ± 16 min, P = 0.85, n = 42), dhc1(1–1,266) (35 ± 10 min, P < 10−4, n = 56), ssm4Δ (29 ± 9 min, P = 0.78, n = 65), klp2Δ ssm4Δ (45 ± 14 min, P = 0.12, n = 96), dli1Δ (33 ± 11 min, P = 0.003, n = 60), klp2Δ dli1Δ (119 ± 65 min, P < 10−6, n = 33/101), dhc1Δ dli1Δ (35 ± 7 min, n = 64), nmt1-dhc1 (28 ± 10 min, P = 0.74, n = 71), and klp2Δ nmt1-dhc1 (40 ± 12 min, P < 10−3, n = 74). (*, P < 0.01, colors indicate strain for comparison.) Note that the highest value of klp2Δ dli1Δ strain is 265 min, beyond the range of the plot. (B) Percentage of zygotes completing nuclear congression in wild type (100%, n = 104), klp2Δ dhc1Δ (2%, n = 85), klp2Δ num1Δ (100%, n = 42), klp2Δ dhc1(1–1266) (2%, n = 56), klp2Δ ssm4Δ (100%, n = 96), and klp2Δ dli1Δ (21%, n = 101). (C) Cellular distribution of N-terminal part of Dhc1-3×GFP in mating dhc1(1–1,266) cells coexpressing Cut11-mCherry and mCherry-Atb2 at 25°C. Images are represented as maximum z projection of 3D stacks. Dotted lines represent outlines of cells in different stages of meiotic prophase. (D) Cellular distribution of Dhc1-3×GFP in mating wild-type, ssm4Δ, dli1Δ, and nmt1-dhc1 cells coexpressing Cut11-mCherry and mCherry-Atb2. (E) Frequency of time points, at which dynein was detected at SPBs relative to SPB fusion in wild-type, ssm4Δ, dli1Δ, and nmt1-dhc1 zygotes (n = 50 cells). Mean values for dynein detection at SPBs relative to SPB fusion: wild type (−36 ± 33 min), ssm4Δ (−32 ± 31 min), dli1Δ (50 ± 26 min, 27/50 events), and nmt1-dhc1 (−62 ± 47 min). (F) Box plot shows SPB intensities of Dhc1-3×GFP at time point of SPB fusion averaged for a cell population of wild-type, ssm4Δ, dli1Δ, and nmt1-dhc1 zygotes (n = 50 SPBs). Mean values for dynein intensities at SPBs at time point of SPB fusion (arbitrary unit [a.u.]): wild type (4,924 ± 2,757), ssm4Δ (3,746 ± 2,160, P = 0.02), dli1Δ (80 ± 277, P < 10−15), and nmt1-dhc1 (13,939 ± 7,979, P < 10−11). (*, P < 0.05; ***, P < 10−4.) Bars, 5 µm. n were collected from 2–3 independent experiments. wt, wild type. For box plots, each box encloses 50% of the data with the median values displayed as lines. The top and bottom of each box mark the minimum and maximum values within the dataset that fall within an acceptable range. Any value outside of this range, called an outlier, is displayed as an individual point.
Figure 5.
Figure 5.
Dynein promotes nuclear clustering in the klp2Δ sid2-250 mutant. (A) Ectopic expression of Dhc1-3×GFP or Dli1-2×mCherry from the nmt41 promoter in vegetative cells coexpressing Sfi1-RFP or -GFP that were exponentially grown 72 h in minimal medium without thiamine. Arrowheads indicate colocalization of Dhc1 with SPB marker Sfi1. (B) Colocalization of Dhc1-3×GFP and Dli1-2×mCherry at SPBs, when coexpressed from the nmt41 promoter. Asterisk labels mitotic cell, in which Dhc1 is absent from SPBs. Arrowhead highlights punctuate localization of Dhc1 at cell division site. (C) Percentage of cells, in which Dhc1-3×GFP expressed from the nmt41 (shaded in blue) or nmt1 promoter (red) is detected at SPBs. Strains with the indicated genotypes were tested. (n ≥ 300 cells, from a single experiment.) (D, top) Western blot of total extracts prepared from dli1Δ or nmt41-dli1-2×mCherry strains expressing nmt41-Dhc1-3×GFP. Western blot was probed with anti-GFP or TAT1 antibodies (tubulin as a loading control). (bottom) Relative amounts of Dhc1 normalized to dli1+. Bars represent means from three independent experiments. a.u., arbitrary unit. (E) sid2-250 and klp2Δ sid2-250 cells expressing Cut11-GFP to visualize nuclei were exponentially grown in minimal medium without thiamine at 25°C and then shifted to 36°C for 4 h to inactive Sid2. Dhc1-3×GFP was expressed from nmt41 or nmt1 promoter (only nmt1 shown) together with nmt41-Dli1-2×mCherry. Dotted lines represent outlines of cells. Cells were observed after fixation with −20°C methanol. Bar graphs show the means and SD of the means of the three replicate experiments with ≥73 cells per replicate. (F) Mean distances between nuclei were plotted against cell length (Fig. S5, D and E) categorized into 2.5-µm intervals (n ≥ 100 cells). (G) Ratio of mean nuclei distance/mean cell length in cells ranging from 20 to 30 µm (n ≥ 73 cells). Mean values for wild type (0.04 ± 0.01, distance = 0.93 ± 0.15 µm, length = 23.02 ± 0.2 µm), klp2Δ (0.23 ± 0.01, distance = 5.64 ± 0.43 µm, length = 24.84 ± 0.43 µm), klp2Δ nmt41-dhc1 nmt41-dli1 (0.18 ± 0.01, distance = 4.65 ± 0.53 µm, length = 25.47 ± 0.9 µm), and klp2Δ nmt1-dhc1 nmt41-dli1 (0.15 ± 0.004, distance = 3.59 ± 0.14 µm, length = 23.6 ± 0.24 µm; *, P < 0.05 to klp2Δ). Bars represent means from three independent experiments. Error bars: SD. wt, wild type. Bars, 5 µm.
Figure 6.
Figure 6.
Model for nuclear congression in fission yeast. (A) Upon fusion of two haploid cells, MTs dominantly nucleated at SPBs extend into the cytoplasm of the mating partner. (1) Kinesin-14 Klp2 loaded onto MT plus ends via Mal3/EB1 cross-links MTs in an antiparallel fashion. Two models for kinesin-14–dependent generation of pulling forces are proposed: (a) Klp2 slides antiparallel MTs or (b) Klp2 induces depolymerization and cross-links shrinking plus ends. (2) During nuclear congression, dynein accumulates at the SPB resulting in acceleration of nuclear migrations. SPB-bound dynein may exert pulling forces on MTs emanating from the opposite SPB. These parallel mechanisms ensure nuclear congression in fission yeast and illustrate distinct roles for two minus end–directed motor proteins in the same process. (3) Pushing forces generated by growing MTs against the cortex facilitate nuclear congression. (B) Dhc1 molecules or dimers are stabilized by Dli1 resulting in a quantitative increase of dynein at the SPB recruited by an unknown adaptor protein.

Similar articles

Cited by

References

    1. Almonacid M., Celton-Morizur S., Jakubowski J.L., Dingli F., Loew D., Mayeux A., Chen J.S., Gould K.L., Clifford D.M., and Paoletti A.. 2011. Temporal control of contractile ring assembly by Plo1 regulation of myosin II recruitment by Mid1/anillin. Curr. Biol. 21:473–479 10.1016/j.cub.2011.02.003 - DOI - PMC - PubMed
    1. Bähler J., Wu J.Q., Longtine M.S., Shah N.G., McKenzie A. III, Steever A.B., Wach A., Philippsen P., and Pringle J.R.. 1998. Heterologous modules for efficient and versatile PCR-based gene targeting in Schizosaccharomyces pombe. Yeast. 14:943–951 10.1002/(SICI)1097-0061(199807)14:10<943::AID-YEA292>3.0.CO;2-Y - DOI - PubMed
    1. Beinhauer J.D., Hagan I.M., Hegemann J.H., and Fleig U.. 1997. Mal3, the fission yeast homologue of the human APC-interacting protein EB-1 is required for microtubule integrity and the maintenance of cell form. J. Cell Biol. 139:717–728 10.1083/jcb.139.3.717 - DOI - PMC - PubMed
    1. Braun M., Drummond D.R., Cross R.A., and McAinsh A.D.. 2009. The kinesin-14 Klp2 organizes microtubules into parallel bundles by an ATP-dependent sorting mechanism. Nat. Cell Biol. 11:724–730 10.1038/ncb1878 - DOI - PubMed
    1. Brunner D., and Nurse P.. 2000. CLIP170-like tip1p spatially organizes microtubular dynamics in fission yeast. Cell. 102:695–704 10.1016/S0092-8674(00)00091-X - DOI - PubMed

Publication types

MeSH terms

LinkOut - more resources