. 2015 May 22;290(21):13531-40.
doi: 10.1074/jbc.M115.636704. Epub 2015 Apr 13.

Structural Basis for the Inverted Repeat Preferences of mariner Transposases

Affiliations

Structural Basis for the Inverted Repeat Preferences of mariner Transposases

Maryia Trubitsyna et al. J Biol Chem. .

Abstract

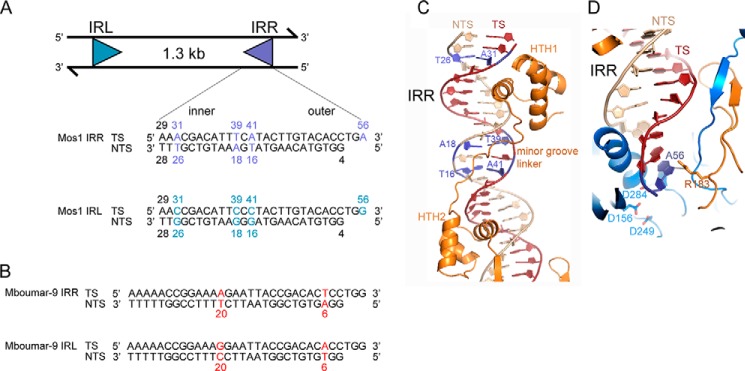
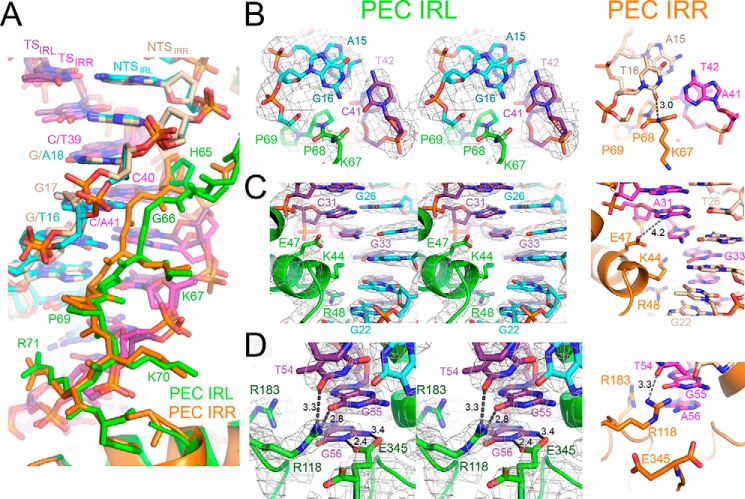
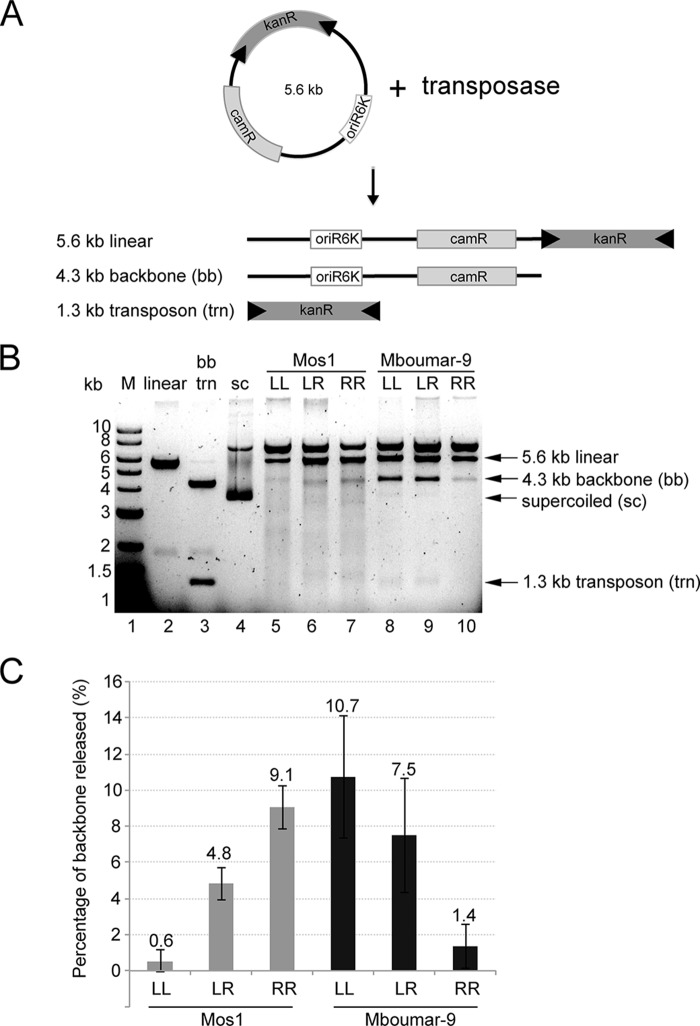
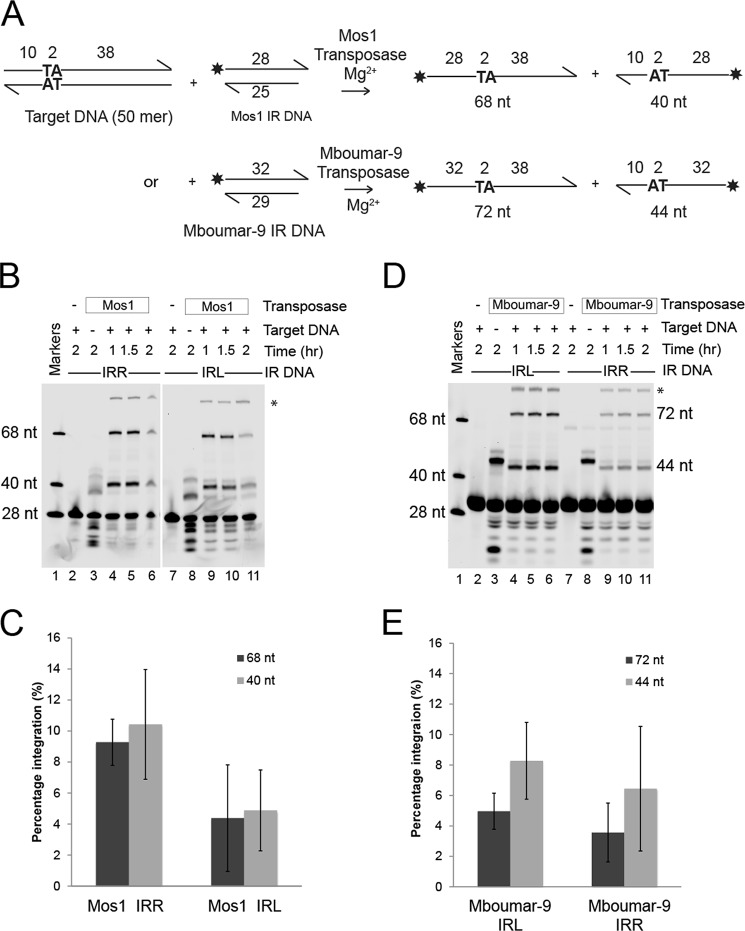
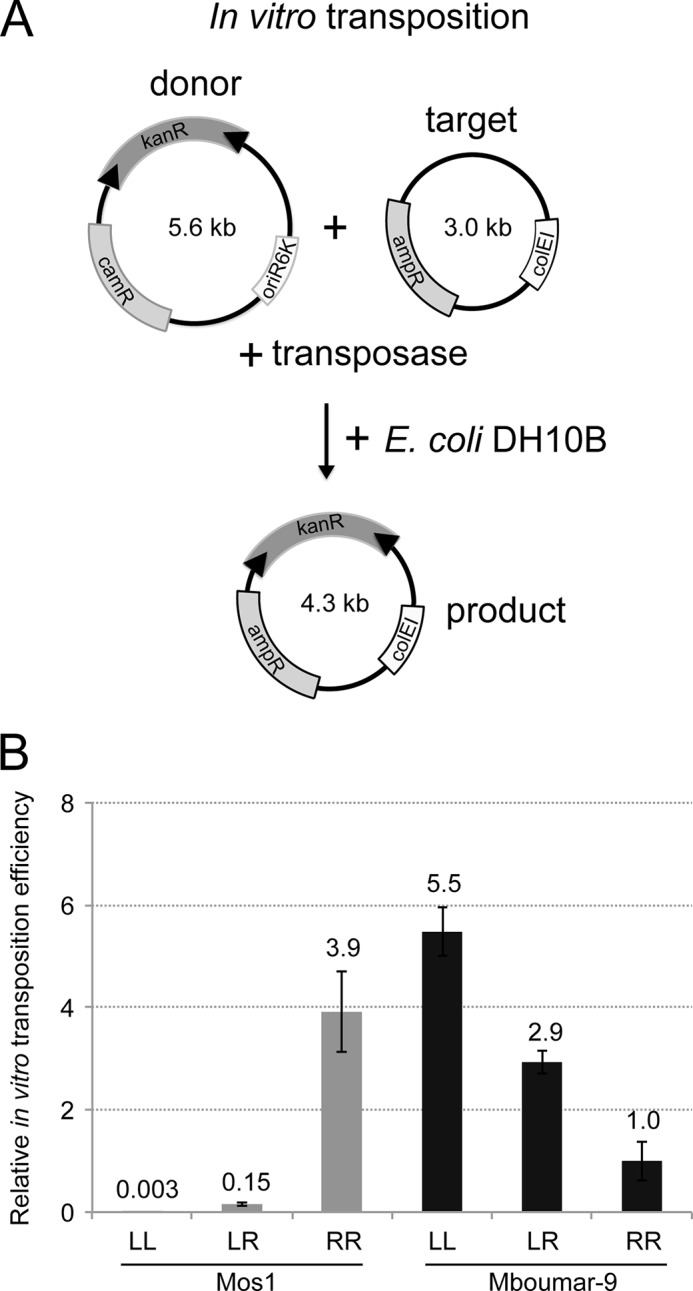
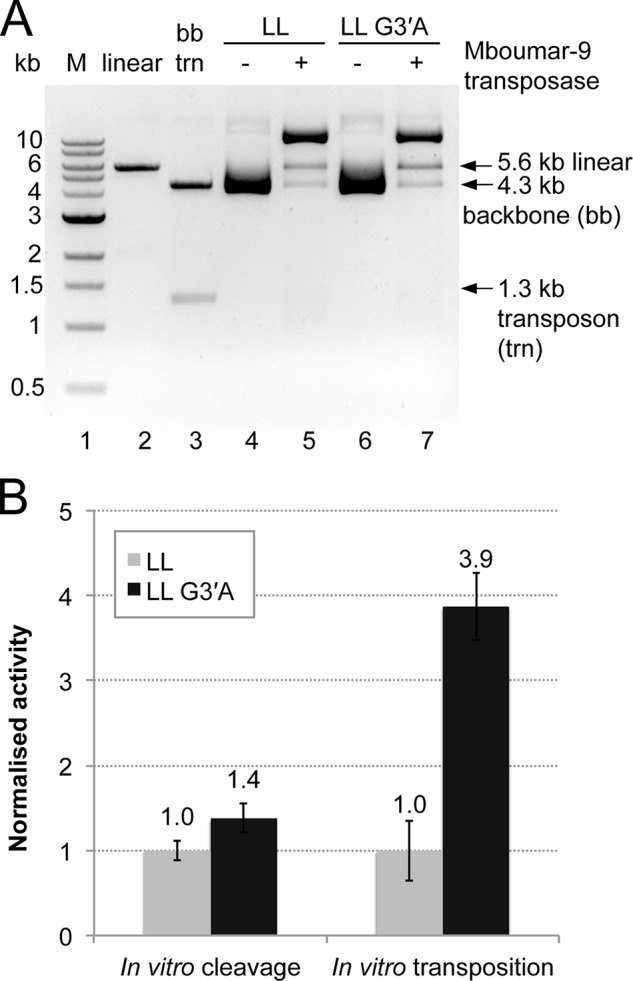
The inverted repeat (IR) sequences delimiting the left and right ends of many naturally active mariner DNA transposons are non-identical and have different affinities for their transposase. We have compared the preferences of two active mariner transposases, Mos1 and Mboumar-9, for their imperfect transposon IRs in each step of transposition: DNA binding, DNA cleavage, and DNA strand transfer. A 3.1 Å resolution crystal structure of the Mos1 paired-end complex containing the pre-cleaved left IR sequences reveals the molecular basis for the reduced affinity of the Mos1 transposase DNA-binding domain for the left IR as compared with the right IR. For both Mos1 and Mboumar-9, in vitro DNA transposition is most efficient when the preferred IR sequence is present at both transposon ends. We find that this is due to the higher efficiency of cleavage and strand transfer of the preferred transposon end. We show that the efficiency of Mboumar-9 transposition is improved almost 4-fold by changing the 3' base of the preferred Mboumar-9 IR from guanine to adenine. This preference for adenine at the reactive 3' end for both Mos1 and Mboumar-9 may be a general feature of mariner transposition.

Keywords: DNA recombination; DNA transposition; DNA-protein interaction; X-ray crystallography; molecular genetics; nucleic acid enzymology; phosphoryl transfer; structural biology.


Figures

FIGURE 1.
FIGURE 1.
Imperfect inverted repeats of two active mariner transposons, Mos1 and Mboumar-9. A, schematic of the Mos1 transposon and the sequences of the imperfect IRR and IRL. The TS and NTS sequences shown are the products of the staggered DNA cleavage reactions, which leaves a single-strand overhang of 3 bases on the 3′ end of the TS. The sequences of the Mos1 IRR and IRL differ at four positions, indicated in purple and cyan, respectively. B, sequences of the imperfect 32-bp inverted repeats of the Mboumar-9 transposon. IRR and IRL of Mboumar-9 transposon differ by two positions: 6 and 20, indicated in red. C, interactions between the Mos1 IRR and the Mos1 transposase DNA-binding domain in the Mos1 IRR PEC structure (PDB ID: 3HOS). The base pairs that differ between IRR and IRL are colored purple. D, interactions between the Mos1 IRR and the transposase catalytic domain.
FIGURE 2.
FIGURE 2.
Transposase-DNA interactions in the crystal structure of the Mos1 IRL PEC and comparison with the IRR PEC structure. A, transposase residues His-65 to Arg-71, linking the HTH1 and HTH2 motifs, bind in the minor groove between bases 15–18 of the NTS. The linker is displaced out of the minor groove in the PEC IRL (green) as compared with the equivalent residues in the PEC IRR (orange). B, cis linker-DNA interactions involving the base pair G16:C41 in the PEC IRL (left panel). A stereo view is shown, and the 2FoFc electron density map, contoured at 2σ, is displayed as a gray mesh. The right panel shows the equivalent interactions in the PEC IRR involving the T16:A41 base pair. C, interactions between HTH1 and the major groove in the inner region of the inverted repeat sequence. D, trans interactions between the catalytic domain and DNA involving the unpaired base G56 in the IRL PEC and A56 in the IRR PEC.
FIGURE 3.
FIGURE 3.
Inverted repeat preferences of Mos1 and Mboumar-9 transposases for in vitro DNA cleavage of transposon-containing plasmids. A, schematic of the in vitro plasmid DNA cleavage assay and the expected products. The donor DNA plasmid contains a transposon comprising a kanamycin resistance gene (kanR) flanked by inverted repeats (black arrows), a chloramphenicol resistance gene (camR), and the oriR6K origin of replication. B, agarose gel of the products of in vitro IR DNA cleavage. Lane 1, 1-kb DNA ladder of markers (M); lane 2, pEPMosLL linearized with XbaI; lane 3, pEPMboLL digested with SacI to excise the transposon; lane 4, supercoiled (sc) plasmid. Lanes 5–7, cleavage of the Mos1 transposon containing two left IRs (LL), one left and one right IR (LR), or two right IRs (RR). Lanes 8–10, cleavage of Mboumar-9 transposons. C, quantification of the percentage of plasmid backbone released (as a proportion of the total intensity of the lane) in each of the reactions in lanes 5–10 above. The error bars indicate the S.D. between 4 independent measurements.
FIGURE 4.
FIGURE 4.
Comparison of in vitro strand transfer of the left and right Mos1 and Mboumar-9 inverted repeats. A, schematic of the assays. The asterisk indicates the position of the fluorescent label. The size of the products of strand transfer depends on which strand of the target DNA has been attacked. B, denaturing polyacrylamide gel of the Mos1 IR DNA strand transfer products. Lane 1 contains fluorescent labeled markers; lanes 2–6 contain labeled Mos1 IRR DNA; and lanes 7–11 contain labeled Mos1 IRL DNA. Lanes 2 and 7, reactions without transposase; lanes 3 and 8, reactions with no target DNA. The products in lanes 3 and 8 result from integration of IR DNA into the two TA dinucleotides contained within the Mos1 IR DNA sequence. The bands marked by the asterisk are most likely a result of the subsequent integration of the most prominent 37-nt product into target DNA. C, quantification of the percentage of total Mos1 strand transfer products (68 and 40 nt) after a 1.5-h incubation. D, denaturing polyacrylamide gel of the Mboumar-9 IR DNA strand transfer products; lane contents are as described in B except that Mboumar-9 transposase, IRR, and IRL DNA were used. The Mboumar-9 IR DNA sequences contain one TA nucleotide into which other IR DNA molecules can integrate, generating 47- and 51-nt products (lanes 3 and 8). Integration of the most abundant 47-nt product into target DNA would generate an 87-nt strand (marked by asterisk). E, quantification of the percentage of total Mboumar-9 strand transfer products (72 and 44 nt) after a 1.5-h incubation. Error bars in panels C and E indicate the S.D. between 2 and 3 experiments, respectively.
FIGURE 5.
FIGURE 5.
In vitro transposition efficiency of Mos1 and Mboumar-9 transposons flanked with different IRR and IRL combinations. A, schematic of the in vitro transposition assay. The donor plasmid is incubated with a target plasmid, containing an ampicillin resistance (ampR) gene and a colE1 origin of replication, and purified transposase. The donor plasmid has a conditional origin of replication (oriR6K) and is unable to replicate in the recipient strain E. coli DH10B. The products of transposition are scored by counting the number of colonies carrying the kanR marker. The transposition efficiency was calculated as the number of kanR colonies per 1 μg of the donor plasmid divided by the transformation efficiency (CFU/μg). B, relative in vitro transposition efficiencies of Mos1 and Mboumar-9 donor plasmids containing different combinations of left and right IRs (as in Fig. 3B). These experiments were performed using MgCl2. For ease of comparison, the in vitro transposition efficiency was normalized to 1.4 × 10⁻⁴, the transposition efficiency of the Mboumar-9 pEPMboRR donor plasmid. Each experiment was conducted 4 times, and the error bars indicate the S.D. between measurements. LL, two left IRs; LR, one left and one right IR; RR, two right IRs.
FIGURE 6.
FIGURE 6.
Comparison of in vitro DNA cleavage and DNA transposition of the donor Mboumar-9 transposons pEPMboLL (with two native IRLs) and pEPMboLL-G3′A (with two mutated IRLs). A, agarose gel of the products of in vitro DNA cleavage. Experiments were performed twice. Lane 1, 1-kb DNA ladder of markers (M); lane 2, pEPMosLL linearized with XbaI; lane 3, pEPMboLL digested with SacI to excise the transposon; lane 4, pEPMboLL plasmid; lane 5, pEPMboLL plasmid incubated with Mboumar-9 transposase; lane 6, pEPMboLL-G3′A plasmid; lane 7, pEPMboLL-G3′A plasmid incubated with Mboumar-9 transposase. LL, two left IRs. B, quantification of in vitro cleavage and transposition of these transposons. Three repeats of the transposition reactions were performed. The percentage of backbone DNA released from the LL and LL-G3′A donor plasmids, as well as the relative efficiency of Mboumar-9 in vitro transposition, is normalized to that of LL. The error bars indicate S.D. between multiple measurements.

Similar articles

Cited by

References

    1. Delaurière L., Chénais B., Hardivillier Y., Gauvry L., Casse N. (2009) Mariner transposons as genetic tools in vertebrate cells. Genetica 137, 9–17 - PubMed
    1. Ammar I., Izsvák Z., Ivics Z. (2012) The Sleeping Beauty transposon toolbox. Methods Mol. Biol. 859, 229–240 - PubMed
    1. Muñoz-López M., García-Pérez J. L. (2010) DNA transposons: nature and applications in genomics. Curr. Genomics 11, 115–128 - PMC - PubMed
    1. Rostovskaya M., Fu J., Obst M., Baer I., Weidlich S., Wang H., Smith A. J., Anastassiadis K., Stewart A. F. (2012) Transposon-mediated BAC transgenesis in human ES cells. Nucleic Acids Res. 40, e150. - PMC - PubMed
    1. Ivics Z., Hackett P. B., Plasterk R. H., Izsvák Z. (1997) Molecular reconstruction of Sleeping Beauty, a Tc1-like transposon from fish, and its transposition in human cells. Cell 91, 501–510 - PubMed

Publication types

MeSH terms

Associated data

LinkOut - more resources