. 2015 Apr 10:6:6789.
doi: 10.1038/ncomms7789.

miR-26a and miR-384-5p are required for LTP maintenance and spine enlargement

Affiliations

miR-26a and miR-384-5p are required for LTP maintenance and spine enlargement

Qin-Hua Gu et al. Nat Commun. .

Abstract

Long-term potentiation (LTP) is a form of synaptic plasticity that results in enhanced synaptic strength. It is associated with the formation and enlargement of dendritic spines-tiny protrusions accommodating excitatory synapses. Both LTP and spine remodelling are crucial for brain development, cognition and the pathophysiology of neurological disorders. The role of microRNAs (miRNAs) in the maintenance of LTP, however, is not well understood. Using next-generation sequencing to profile miRNA transcriptomes, we demonstrate that miR-26a and miR-384-5p specifically affect the maintenance, but not induction, of LTP and different stages of spine enlargement by regulating the expression of RSK3. Using bioinformatics, we also examine the global effects of miRNA transcriptome changes during LTP on gene expression and cellular activities. This study reveals a novel miRNA-mediated mechanism for gene-specific regulation of translation in LTP, identifies two miRNAs required for long-lasting synaptic and spine plasticity and presents a catalogue of candidate 'LTP miRNAs'.


Figures

Figure 1
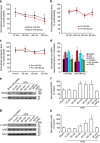
Figure 1. miRNAs differentially expressed in LTP.
(a) The fold change (on log2 scale) of each miRNA is plotted against its normalized read number (on log2 scale). (b) The P value (on a log10 scale) of each miRNA is plotted against its fold change (on a log2 scale). In a and b, each circle represents one miRNA; miRNAs with P values less than 0.05 are illustrated by solid circles. (c) Normalized miRNA expression (n=5 slices from three rats for each condition) in rat hippocampal slices stimulated with high-frequency stimulation. (d) Normalized miRNA expression (n=4–7 experiments for each condition) in cultured rat hippocampal neurons stimulated with TEA. In c and d, data are presented as mean±s.e.m. Student's t-test or Mann–Whitney U-test (determined by the distribution and variance of the data) was used for comparison between control and stimulated samples in c and d; *P<0.05, **P<0.01, ***P<0.001.
Figure 2
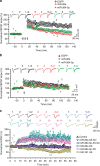
Figure 2. The downregulation of miR-26a and miR-384-5p is required for the maintenance of protein synthesis-dependent LTP.
(a) Protein synthesis-dependent LTP induced by four trains of tetanic stimulation. (b) Protein synthesis-independent LTP induced by a single train of tetanic stimulation. In a and b, the fEPSP slope normalized to the baseline prior to stimulation was plotted as mean±s.e.m.; n=5–12 slices for each condition. (c) The effect of infusing antisense oligonucleotides against miR-26a, miR-384-5p or miR-191, and mutated miR-26a and miR-384-5p anti-miRs (all at 2 μM) on EPSCs; n=7–9 slices for each condition. Data are presented as mean±s.e.m.
Figure 3
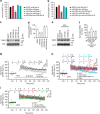
Figure 3. RSK3 mediates the effect of miR-26a and miR-384-5p on LTP.
(a,b) Cultured hippocampal neurons were transfected with designated reporter constructs at DIV14 and fixed for image acquisition at DIV17; n=13–15 neurons for each group; data are presented as mean±s.e.m.; Kruskal–Wallis and Mann–Whitney U-tests are used for statistical analysis; ***P<0.001; scale bar, 20 μm. (cf) Cultured hippocampal slices were transduced with a designated lentivirus, unstimulated (c,d), sham-stimulated (e,f) or stimulated with high-frequency stimulation (HFS; e,f) and immunoblotted for RSK3; data are presented as mean±s.e.m.; n=4–5 slices for each condition; Kruskal–Wallis and Mann–Whitney U-tests are used for statistical analysis; *P<0.05, ***P<0.001. (gi) Cultured hippocampal slices were treated with vehicle or BI-D1870 or transduced with designated lentivirus, and stimulated for LTP induction; the fEPSP slope normalized to the baseline prior to stimulation was plotted as mean±s.e.m.; n=5–7 slices for each condition; one-way analysis of variance and Student's t-test are used for normally distributed data with equal variance, and Kruskal–Wallis and Mann–Whitney U-tests are used for non-normally distributed data with unequal variance for statistical analysis.
Figure 4
Figure 4. Increased rpS6 phosphorylation caused by the expression change to miR-26a, miR-384-5p and RSK3 in LTP.
Primary cortical neurons (DIV4) were transduced with lentivirus-expressing EGFP (as the control), RSK3 siRNA, miR-26a or miR-384-5p. At 2 weeks after transduction, neurons were treated with TEA (25 mM, 15 min) and harvested at 90 min after treatment for immunoblotting. BI-D1870 was added to neural medium at 5 min before TEA treatment. (a) Representative blots. (b) Quantification of a. Data are presented as mean±s.e.m. n=4–5 experiments for each condition. Kruskal–Wallis and Mann–Whitney U-tests are used for statistical analysis. **P<0.01.
Figure 5
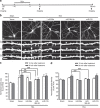
Figure 5. The downregulation of miR-26a and miR-384-5p is required for spine plasticity associated with LTP.
(a) Experimental design. (b) Representative images. (c,d) Quantification of b. n=10–18 neurons for each condition. Data are presented as mean±s.e.m. Kruskal–Wallis and Mann–Whitney U-tests are used for statistical analysis. *P<0.05, *** and ##P<0.01, ###P<0.001. Scale bar, 20 μm for low-magnification images and 5 μm for high-magnification images.
Figure 6
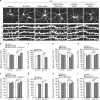
Figure 6. RSK3 mediates the effect of miR-26a on spine plasticity.
(a) Representative images. (bi) Quantification of spine area and spine density. For BI-D1870 treatment, BI-D1870 was added to the medium at 5 min before TEA treatment. n=13–16 neurons for each condition. Data are presented as mean±s.e.m. Kruskal–Wallis and Mann–Whitney U-tests are used for statistical analysis. *P<0.05, **P<0.01, ***P<0.001. Scale bar, 20 μm for low-magnification images and 5 μm for high-magnification images.
Figure 7
Figure 7. miR-26a and miR-384-5p are regulated at post-transcriptional levels by GluN2A in LTP.
LTP was induced in hippocampal slices by stimulating the Schaffer collateral pathway with high-frequency stimulation. The CA1 region was removed at indicated time points after stimulation for miRNA (a,d), pri-miRNA (b), pre-miRNA (c) and protein analyses (eh). n=8–9 slices (qRT–PCR) or 4–5 slices (immunoblot) for each condition. Data are presented as mean±s.e.m. Kruskal–Wallis and Mann–Whitney U-tests are used for statistical analysis between unstimulated (ad) or sham-stimulated (eh) slices and stimulated slices harvested at different post-stimulation time points. *P<0.05, **P<0.01, ***P<0.001. In ac, black asterisks indicate statistically significant differences for mature, pri- and pre-miR-26a, and orange asterisks indicate those for mature, pri- and pre-miR-384-5p.
Figure 8
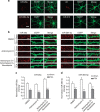
Figure 8. miR-26a and miR-384-5p are regulated locally in dendrites in LTP.
Cultured hippocampal neurons were transfected with the EGFP construct (for visualization of transfected neurons), treated with TEA (25 mM, 15 min) at 3 days after transfection and fixed at 90 min after stimulation for in situ hybridization. (a) The subcellular distribution of miR-26a and miR-384-5p. (bd) The effect of TEA treatment on dendritic miR-26a and miR-384-5p; representative images are in b, quantification of b is in c and d; n=18–24 neurons for each condition. Data are presented as mean±s.e.m. Mann–Whitney U-test is used for statistical analysis. *P<0.05, ***P<0.001.
Figure 9
Figure 9. miR-26a and miR-384-5p in the hippocampus decrease after fear conditioning.
Mice (8–9 weeks of age) were subjected to fear conditioning. The hippocampus was removed at 30 and 90 min after fear conditioning for miRNA analysis by qRT–PCR. The expression levels of miR-26a (a) and miR-384-5p (b) were normalized to those in untreated control mice. Data are presented as mean±s.e.m., n=4 mice for each condition. Mann–Whitney U-test is used for statistical analysis. **P<0.01, ***P<0.001.
Figure 10
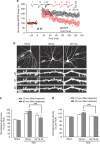
Figure 10. Let-7a is required for spine plasticity associated with LTP.
(a) Cultured hippocampal slices were transduced with lentivirus-expressing let-7a sponge and stimulated with high-frequency stimulation for LTP induction; n=5 slices. The fEPSP slope normalized to the baseline prior to stimulation is plotted as mean±s.e.m. In bd, cultured hippocampal neurons were co-transfected with the let-7a sponge and the venus (for visualization of transfected neurons) construct at DIV14 and stimulated with TEA (25 mM, 15 min) at DIV17. (b) Representative images. (c,d) Quantification of b; n=12–18 neurons for each condition; data are presented as mean±s.e.m. Kruskal–Wallis and Mann–Whitney U-tests are used for statistical analysis. *** and ###P<0.001, **P<0.01. Scale bar, 20 μm for low-magnification images and 5 μm for high-magnification images.

Similar articles

Cited by

References

    1. Abraham W. C. How long will long-term potentiation last? Philos. Trans. R. Soc. Lond. B. Biol. Sci. 358, 735–744 (2003) . - PMC - PubMed
    1. Hofer S. B., Mrsic-Flogel T. D., Bonhoeffer T. & Hubener M. Experience leaves a lasting structural trace in cortical circuits. Nature 457, 313–317 (2009) . - PMC - PubMed
    1. Whitlock J. R., Heynen A. J., Shuler M. G. & Bear M. F. Learning induces long-term potentiation in the hippocampus. Science 313, 1093–1097 (2006) . - PubMed
    1. Pastalkova E. et al. Storage of spatial information by the maintenance mechanism of LTP. Science 313, 1141–1144 (2006) . - PubMed
    1. Kelleher R. J. 3rd, Govindarajan A. & Tonegawa S. Translational regulatory mechanisms in persistent forms of synaptic plasticity. Neuron 44, 59–73 (2004) . - PubMed

Publication types

MeSH terms

Substances

LinkOut - more resources