. 2015 Apr 8;35(14):5823-36.
doi: 10.1523/JNEUROSCI.3904-14.2015.

Tonic firing rate controls dendritic Ca2+ signaling and synaptic gain in substantia nigra dopamine neurons

Affiliations

Tonic firing rate controls dendritic Ca2+ signaling and synaptic gain in substantia nigra dopamine neurons

Travis A Hage et al. J Neurosci. .

Abstract

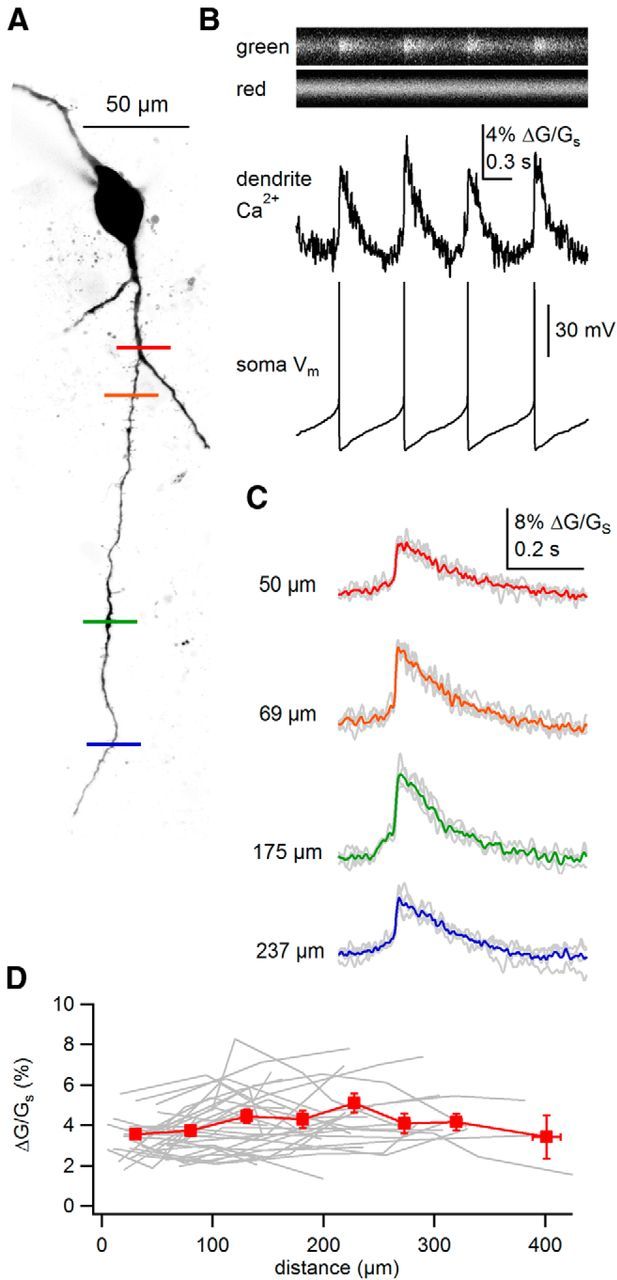
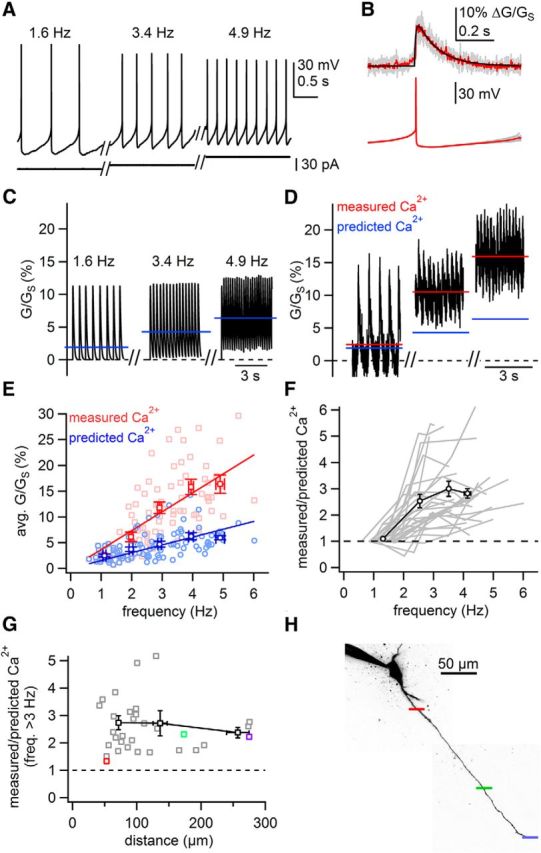
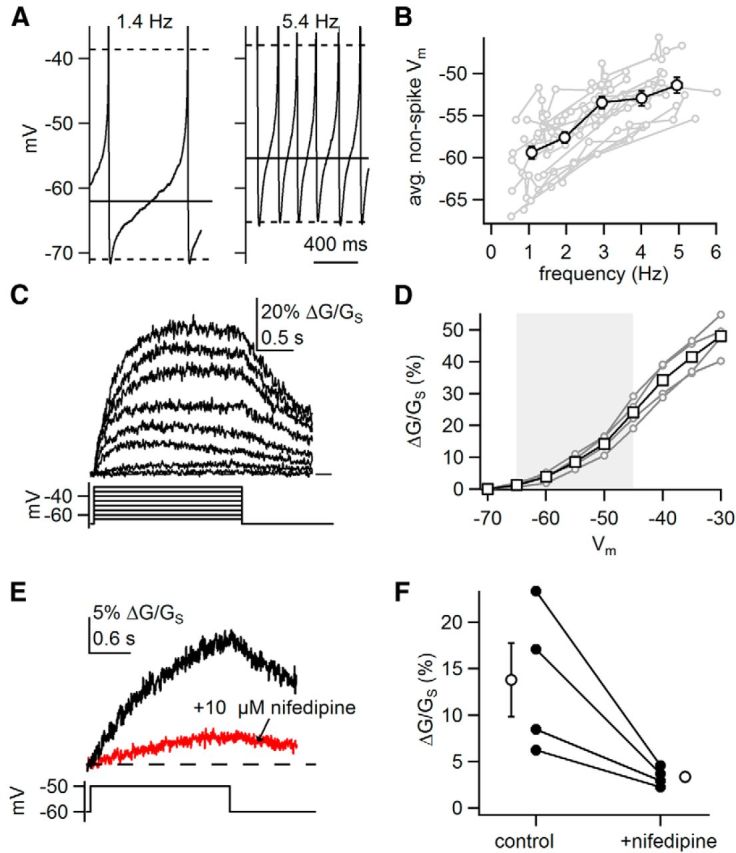
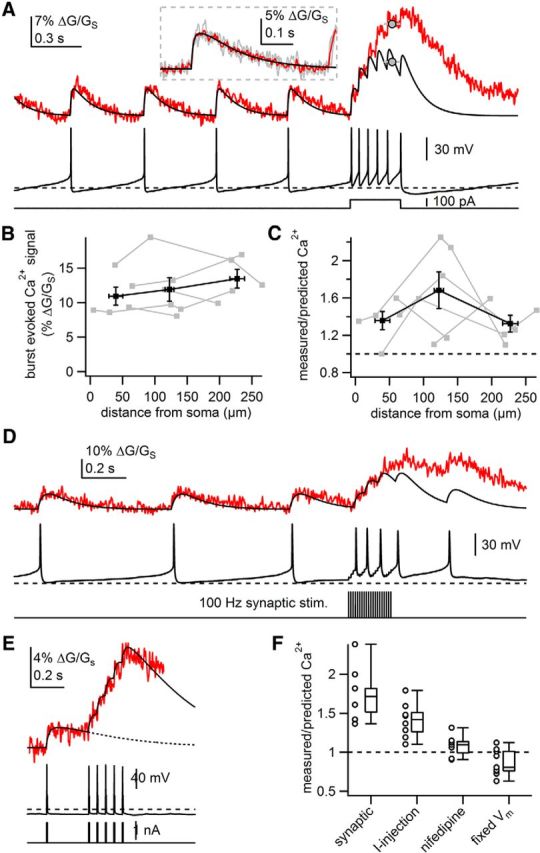
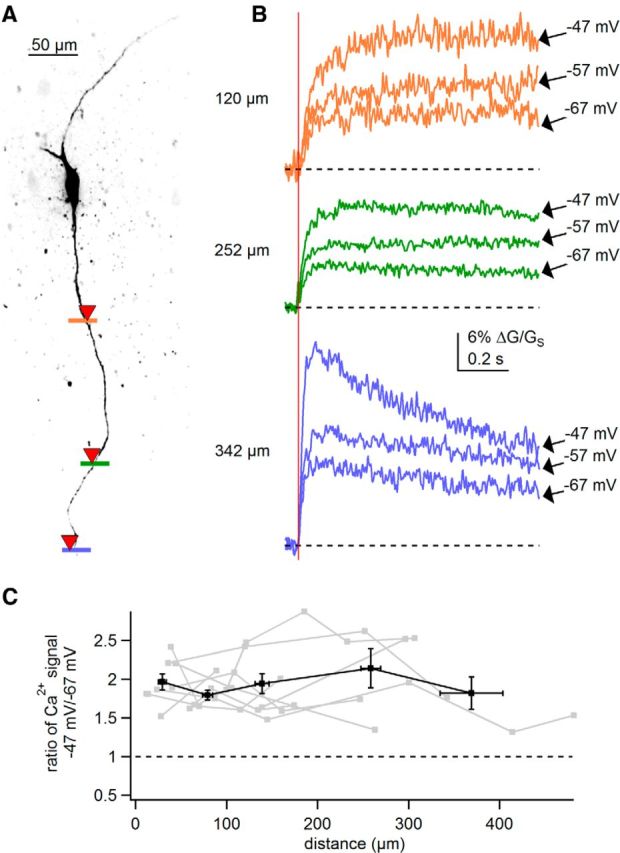
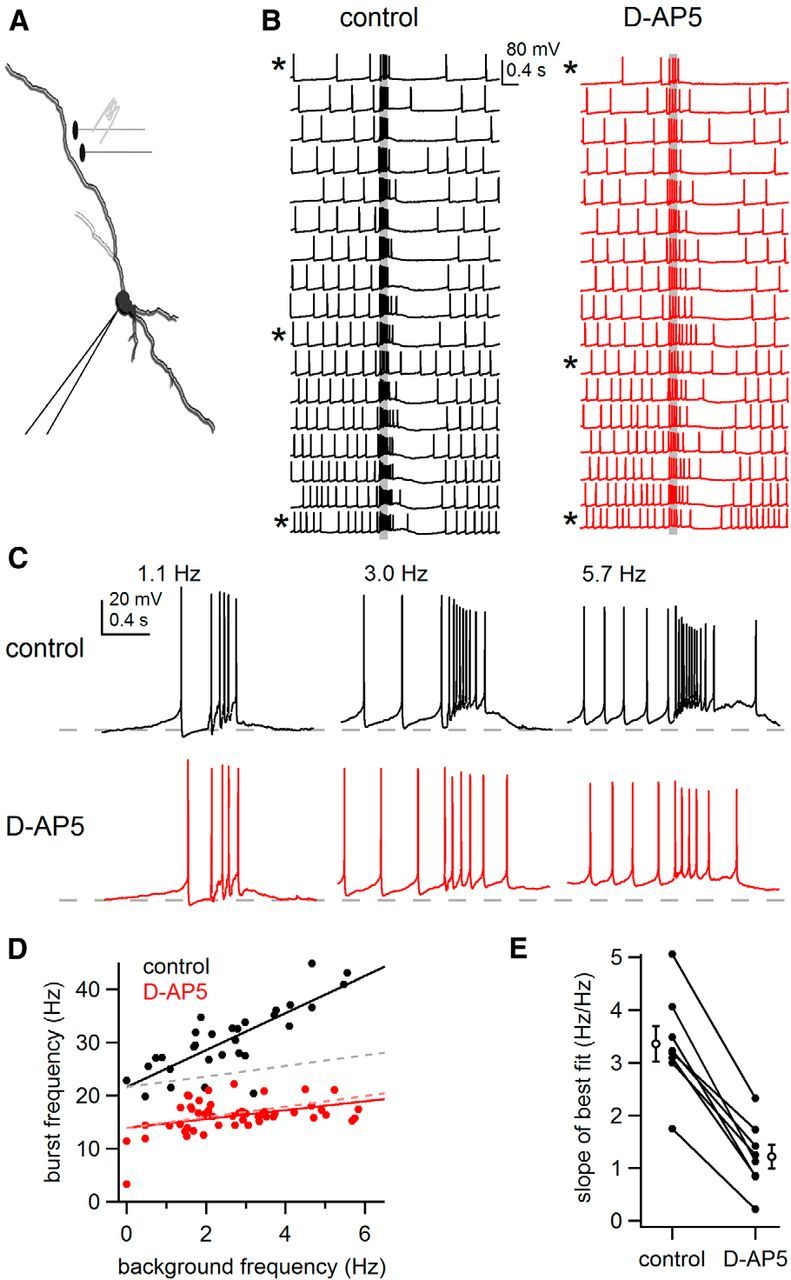
Substantia nigra dopamine neurons fire tonically resulting in action potential backpropagation and dendritic Ca(2+) influx. Using Ca(2+) imaging in acute mouse brain slices, we find a surprisingly steep relationship between tonic firing rate and dendritic Ca(2+). Increasing the tonic rate from 1 to 6 Hz generated Ca(2+) signals up to fivefold greater than predicted by linear summation of single spike-evoked Ca(2+)-transients. This "Ca(2+) supralinearity" was produced largely by depolarization of the interspike voltage leading to activation of subthreshold Ca(2+) channels and was present throughout the proximal and distal dendrites. Two-photon glutamate uncaging experiments show somatic depolarization enhances NMDA receptor-mediated Ca(2+) signals >400 μm distal to the soma, due to unusually tight electrotonic coupling of the soma to distal dendrites. Consequently, we find that fast tonic firing intensifies synaptically driven burst firing output in dopamine neurons. These results show that modulation of background firing rate precisely tunes dendritic Ca(2+) signaling and provides a simple yet powerful mechanism to dynamically regulate the gain of synaptic input.

Keywords: action potential; backpropagation; calcium imaging; dendrite; dopamine; substantia nigra.


Figures

Figure 1.
Figure 1.
Backpropagating action potentials evoke Ca2+ signals throughout the dendrites of SNc dopamine neurons during pacemaking. A, Maximum intensity projection of a typical SNc dopamine neuron visualized using AlexaFluor 594. Sites of linescans are indicated by colored bars across the dendrite. B, Example linescan and dendritic Ca2+ signal measured at location of the red bar in A and simultaneously recorded somatic voltage. C, AP-evoked dendritic Ca2+ transients measured at multiple distances from the soma. Single Ca2+ transients are shown in gray. The average AP-evoked Ca2+ signals are colored according to bars shown in A. D, Plot of amplitudes of AP-evoked Ca2+ transients against distances from the soma. Data for individual dendrites are plotted in gray. Binned averages and SEM are plotted in red.
Figure 2.
Figure 2.
Fast tonic firing evoked by synaptic stimulation results in a supralinear increase in dendritic Ca2+ signals. A, Example neuron imaged by AlexaFluor 594 (red) overlaid with Dodt contrast image to visualize placement of stimulation electrode. B, Somatically recorded firing during pacemaking, and after low and high intensity stimulation at 20 Hz for 6 s. Stimulus artifacts have been digitally removed for clarity. C, Predicted linear Ca2+ signals for firing patterns shown in B. Inset, Average spontaneous AP-evoked Ca2+ transient and fit (black trace) used to generate linear predictions. Blue lines indicate the average values for predicted waveforms. D, “Measured” dendritic Ca2+ signals imaged during firing shown in B. Red lines indicate the average value of measured Ca2+ signal. E, Summary plot of measured (red) and predicted (blue) Ca2+ signals against the frequency of tonic firing. Light symbols are individual points; dark symbols are averages and SEM binned according to frequency. The slope of the line of best fit for measured Ca2+ versus frequency (red line) was 6.2% G/GS per Hz. The slope of the line for predicted Ca2+ versus frequency (blue line) was 1.8% G/GS per Hz. F, Plot of the ratio of measured Ca2+ to predicted Ca2+ against firing rate. Gray lines represent data from individual dendrites. Black symbols represent averaged data for all dendrites binned according to frequency. G, Synaptic Ca2+ influx recorded near the site of stimulation (green) and on a contralateral dendrite (purple) in response to synaptic stimulation of a voltage-clamped cell (−50 mV). Average synaptic currents are shown as black traces. H, Plot of amplitude of synaptic Ca2+ influx versus distance from the stimulation electrode for both ipsilateral (green) and contralateral (purple) dendrites. Gray lines connect points from same cell. Black line is exponential fit for all points; length constant = 20.1 μm.
Figure 3.
Figure 3.
Fast tonic firing evoked by somatic current injection results in a supralinear increase in dendritic Ca2+ signals. A, Example traces of tonic firing. Rates were adjusted with holding current. B, AP-evoked Ca2+ signals (93 μm from soma) during 1.6 Hz tonic firing were averaged and fit with 2 rising and 2 falling exponentials (individual and averaged traces shown in gray and red, fit shown in black). Somatic APs are shown below. C, Predicted Ca2+ signals (black) were generated for the firing rates displayed in A. Blue lines represent the average values of the predicted Ca2+ signals. D, Dendritic Ca2+ signals (black) recorded at the firing rates displayed in A. Red lines indicate the average Ca2+ signal over the course of the scan. E, Summary plot of measured (red) and predicted (blue) Ca2+ signals against the frequency of tonic firing. Light symbols are individual points; dark symbols are averages and SEM binned according to frequency. Lines are lines of best fit to each dataset. The slope of the line of best fit for measured Ca2+ versus frequency was 3.7% G/GS per Hz. The slope of the line for predicted Ca2+ versus frequency was 1.5% G/GS per Hz. Predicted data varies from the line of best fit due to variability in the size and kinetics of the AP-evoked Ca2+ transients between cells. F, Plot of the ratio of measured Ca2+ to predicted Ca2+ against firing rate. Gray lines represent data from individual dendrites. Black line and symbols represent averages and SEM for all dendrites binned according to frequency. G, Plot of the average ratio of measured Ca2+ to predicted Ca2+ for rates >3 Hz against the distance from the soma at which dendritic Ca2+ was measured. Gray points represent individual recordings; black symbols represent averages binned according to distance. H, Example of a cell in which supralinear dendritic Ca2+ signaling was measured at multiple distances from the soma. Colored bars represent sites of linescans and correspond to points plotted in G.
Figure 4.
Figure 4.
Linear dendritic Ca2+ signaling when APs are evoked from a fixed membrane potential. A, Example of measured (red) and predicted (black) dendritic Ca2+ signals (top), somatic voltages (middle), and current injections (bottom) to elicit spiking at 2, 4, and 6 Hz from a fixed membrane potential (−65 mV). Dashed line in Ca2+ recordings indicates baseline Ca2+ level. Dashed line in somatic voltage recordings indicates −60 mV. B, Plot of measured and predicted Ca2+ signals against firing rate. Points represent average and SEM, and lines are of best fit to all individual data points (individual data points not shown for clarity). Black symbols represent average Ca2+ signals measured during tonic firing (replotted from Fig. 3E). Red and blue symbols represent measured and predicted Ca2+ signals when APs were evoked from a fixed membrane potential predictions. The slopes of lines of best fit are as follows: control, 3.7% G/Gs per Hz; fixed Vm measured, 1.4% G/Gs per Hz; fixed Vm predicted, 1.6% G/Gs per Hz. C, Plot of the ratio of measured Ca2+ signals to predicted Ca2+ signals against firing rate. Black points represent averages and SEM for Ca2+ signals measured during tonic firing (replotted from Fig. 3F). Pink lines represent data for individual dendrites when firing was evoked from a fixed membrane voltage. Red points represent averages and SEM at each frequency. D, Plot of the average ratio of measured and predicted Ca2+ signals at firing rates >3 Hz measured in proximal and distal dendrites during tonic firing (gray) or when APs were evoked from fixed voltages (pink). Error bars are SEM.
Figure 5.
Figure 5.
Subthreshold depolarization of somatic Vm increases dendritic Ca2+. A, Example of somatic voltage recordings at a low (1.4 Hz) and high (5.4 Hz) rates of firing. Dashed lines represent average threshold of AP generation and average trough. Solid lines indicate average nonspike membrane voltage. B, Plot of the average nonspike membrane voltage against tonic firing rate for individual cells (gray) and average values ± SEM for all cells binned according to frequency (black). C, Example of dendritic Ca2+ signals (top) recorded in response to somatic voltage steps from −70 mV (bottom). D, Plot of dendritic Ca2+ influx versus voltage for four dendrites (gray) and average signals ± SEM (black). Gray box represents subthreshold voltage range. E, Example of Ca2+ signals recorded in response to a voltage step from −60 to −50 mV before and after application of nifedipine. F, Amplitudes of sustained dendritic Ca2+ signals evoked by a voltage step from −60 to −50 mV before and after application of nifedipine.
Figure 6.
Figure 6.
L-type Ca2+ channels contribute to supralinear dendritic Ca2+ signals. A, The firing rate of dopamine neurons was altered by injection of holding current in the presence of nifedipine. B, AP-evoked Ca2+ signals during 1.3 Hz firing were averaged and fit as in Figure 3B. C, Predicted Ca2+ signals (black) were generated for the firing rates displayed in A. Blue lines represent the average values of the predicted Ca2+ signals. D, Dendritic Ca2+ signals (black) recorded at the firing rates displayed in A. Red lines indicate the average Ca2+ signal over the course of the scan. E, Summary plot of measured (red) and predicted (blue) Ca2+ signals plotted against the rate of tonic firing in the presence of nifedipine, and measured Ca2+ signals in control conditions (black). Light symbols are individual points; dark symbols are binned averages and SEM for all dendrites. Lines are lines of best fit to each dataset. The slopes of the lines of best fit were as follows: control measured data = 3.7% G/Gs per Hz; nifedipine-treated measured data = 2.2% G/Gs per Hz; nifedipine-treated predicted data = 1.3% G/Gs per Hz. Predicted data varies from the line of best fit due to variability in the size and kinetics of the AP-evoked Ca2+ transients between cells. F, Plot of the ratio of measured/predicted Ca2+ signals against firing rate. Pink lines represent data from individual nifedipine-treated dendrites. Red line represents binned averages and SEM for nifedipine data. Black line represents data for control neurons (replotted from Fig. 3F). G, Average ratio of measured/predicted Ca2+ signals for trials during which the frequency of tonic firing >3 Hz. Error bars are SEM. Individual points shown in white. Lines between control and nifedipine points represent paired data. H, Average ratio of measured/predicted Ca2+ signals before and after application CPA. Open symbols represent mean and SEM.
Figure 7.
Figure 7.
Bursts of APs generate supralinear dendritic Ca2+ signals. A, Example of measured dendritic Ca2+ (red) and linear predictions (black) during a burst of APs evoked by a 300 ms, 100 pA current injection into the soma. Dashed line in somatic voltage recording represents −60 mV. The amplitude of the dendritic Ca2+ influx in response to burst firing was measured as the average value between 200 and 300 ms of the somatic current injection, indicated by gray circles. Inset, AP-evoked Ca2+ transients during tonic firing (gray), average AP-evoked Ca2+ transient (red), and line of best fit to the average (black). B, Plot of amplitude of dendritic Ca2+ evoked by a burst of APs against the distance from the soma at which the Ca2+ signal was measured. Individual dendrites displayed in gray; binned averages and SEM displayed in black. C, Plot of the ratio of measured dendritic Ca2+ signal to predicted dendritic Ca2+ signal evoked by a burst against distance from the soma at which the Ca2+ signal was measured. Individual dendrites displayed in gray; binned averages and SEM displayed in black. D, Example of measured (red) and predicted (black) dendritic Ca2+ signals (top) during a burst of action potentials (middle), evoked by synaptic stimulation of a contralateral dendrite (bottom). E, Example of measured and predicted dendritic Ca2+ signals (top) in response to a burst of APs evoked from a fixed voltage (−65 mV, middle) by brief current injections (bottom). Dashed line in the top represents line of best fit to a single AP-evoked Ca2+ transient. F, Box plots of the ratio of measured/predicted Ca2+ signal in response to a burst of APs in indicated conditions. Middle lines represent median value, boxes indicate middle 50% of data, and whiskers indicate maximum and minimum values. Circles represent average ratio calculated for individual dendrites.
Figure 8.
Figure 8.
Depolarization of the soma enhances synaptic strength throughout the dendrites of SNc dopamine neurons. A, Maximum intensity projection of the recorded neuron. Colored bars represent sites of linescan Ca2+ imaging and glutamate uncaging (indicated by red inverted triangles). B, Dendritic Ca2+ signals evoked by two-photon glutamate uncaging (timing of uncaging indicated by red vertical line) at specified somatic voltages. Color of traces corresponds to sites of scans shown in A. Dashed lines represent baseline Ca2+ levels. C, Plot of the ratio of the uncaging-evoked dendritic Ca2+ signal at −47 mV to Ca2+ signal evoked at −67 mV against the distance from the soma. Gray plots represent individual dendrites; black plot represents averages and SEM binned according to distance.
Figure 9.
Figure 9.
Electrotonic coupling of soma and dendrites. A, Examples of dendritic Ca2+ signals (top) in response to somatic voltage steps (bottom) measured 76 and 235 μm from the soma. B, Plot of the amplitude of dendritic Ca2+ signal in response to a voltage step from −60 to −50 mV against the distance from the soma at which dendritic Ca2+ was measured. Individual dendrites plotted in gray. Averages and SEM for six cells binned according to distance plotted in black.
Figure 10.
Figure 10.
Elevation of background firing rate enhances synaptically evoked bursts. A, Schematic of experiment in which background firing rate was altered by tonic current injection at the soma while presynaptic inputs were stimulated (100 Hz, 200 ms) using a bipolar theta glass electrode. B, Example of somatic recordings of burst firing in response to local synaptic stimulation (indicated by gray bars) in control conditions (black traces, left) and after blockade of NMDA receptors (red traces, right). Traces are arranged by increasing background firing rate. Asterisks indicated traces examined in C. C, Examples of burst firing from B at indicated frequencies in control conditions and in the presence of D-AP5. Dashed lines indicate −60 mV. D, Plot of burst frequency versus background frequency in control conditions (black) and in the presence of D-AP5 (red) for the cell in B. Solid lines are lines of best fit to each condition. Dashed lines are theoretical plots in which every 1 Hz increase in background firing rate leads to a 1 Hz increase in burst firing rate. E, Summary plot of the slopes of the lines of best fit as in D for eight neurons, in control conditions and after application of D-AP5. Empty circles are mean ± SEM.

Similar articles

Cited by

References

    1. Beckstead MJ, Grandy DK, Wickman K, Williams JT. Vesicular dopamine release elicits an inhibitory postsynaptic current in midbrain dopamine neurons. Neuron. 2004;42:939–946. doi: 10.1016/j.neuron.2004.05.019. - DOI - PubMed
    1. Bischofberger J, Jonas P. Action potential propagation into the presynaptic dendrites of rat mitral cells. J Physiol. 1997;504:359–365. doi: 10.1111/j.1469-7793.1997.359be.x. - DOI - PMC - PubMed
    1. Blythe SN, Wokosin D, Atherton JF, Bevan MD. Cellular mechanisms underlying burst firing in substantia nigra dopamine neurons. J Neurosci. 2009;29:15531–15541. doi: 10.1523/JNEUROSCI.2961-09.2009. - DOI - PMC - PubMed
    1. Brenowitz SD, Regehr WG. Reliability and heterogeneity of calcium signaling at single presynaptic boutons of cerebellar granule cells. J Neurosci. 2007;27:7888–7898. doi: 10.1523/JNEUROSCI.1064-07.2007. - DOI - PMC - PubMed
    1. Chan CS, Guzman JN, Ilijic E, Mercer JN, Rick C, Tkatch T, Meredith GE, Surmeier DJ. “Rejuvenation” protects neurons in mouse models of Parkinson's disease. Nature. 2007;447:1081–1086. doi: 10.1038/nature05865. - DOI - PubMed

Publication types

LinkOut - more resources