Comparative Study
. 2015 Jun 4;125(23):3627-36.
doi: 10.1182/blood-2014-08-593053. Epub 2015 Apr 7.

Comparative analysis of human ex vivo-generated platelets vs megakaryocyte-generated platelets in mice: a cautionary tale

Affiliations
Comparative Study

Comparative analysis of human ex vivo-generated platelets vs megakaryocyte-generated platelets in mice: a cautionary tale

Yuhuan Wang et al. Blood. .

Abstract

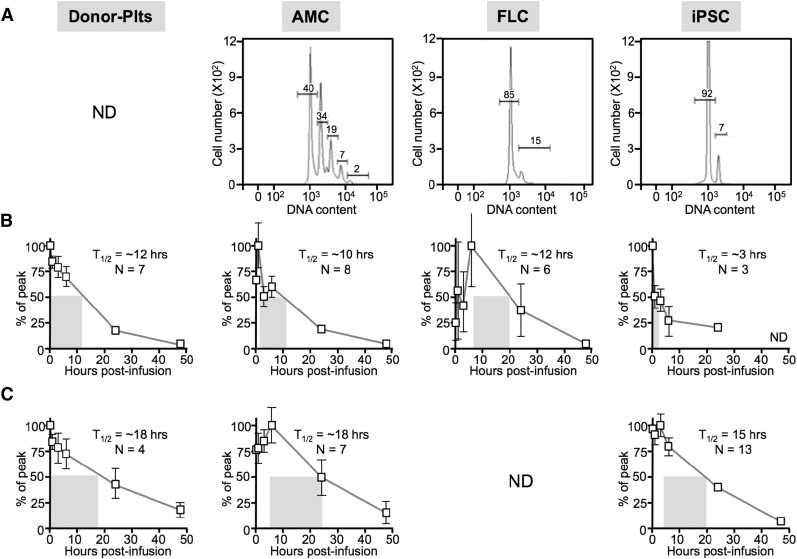
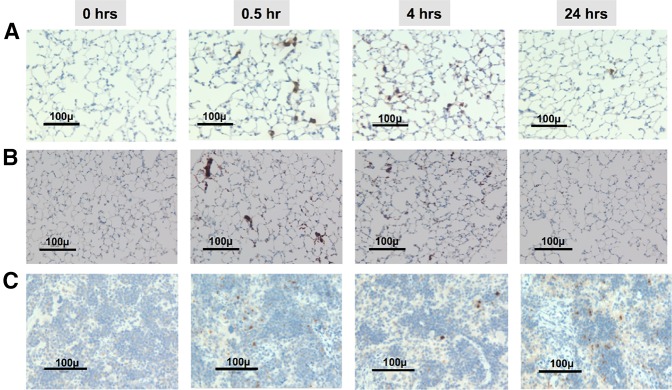
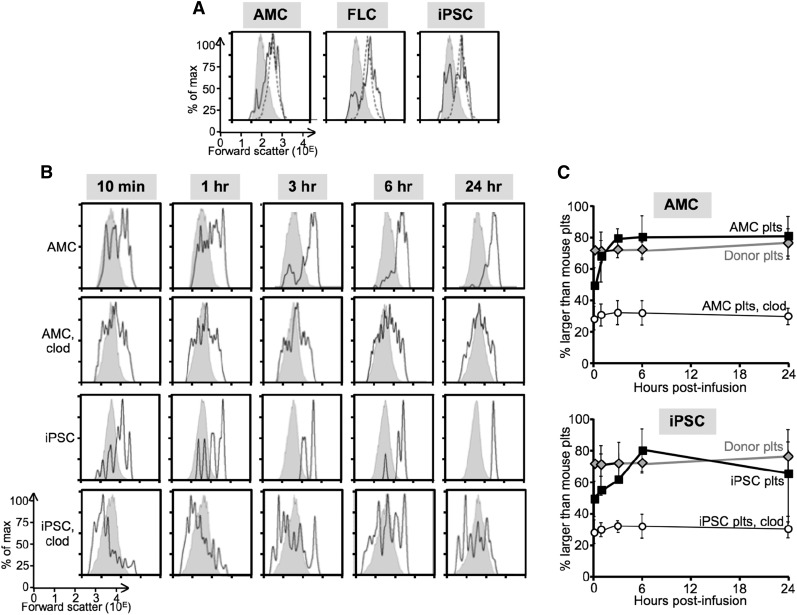
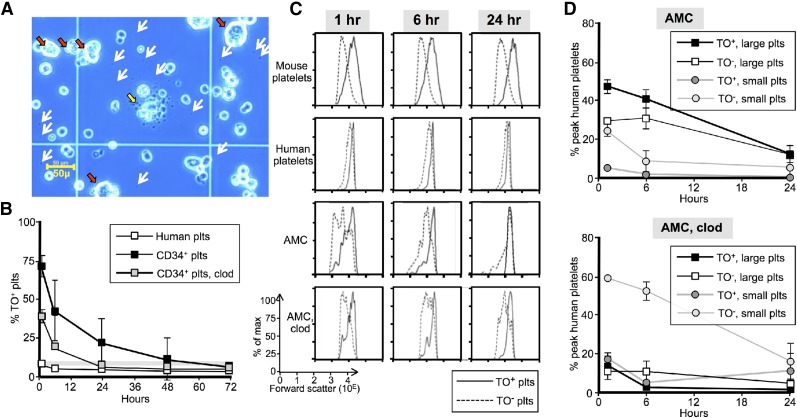
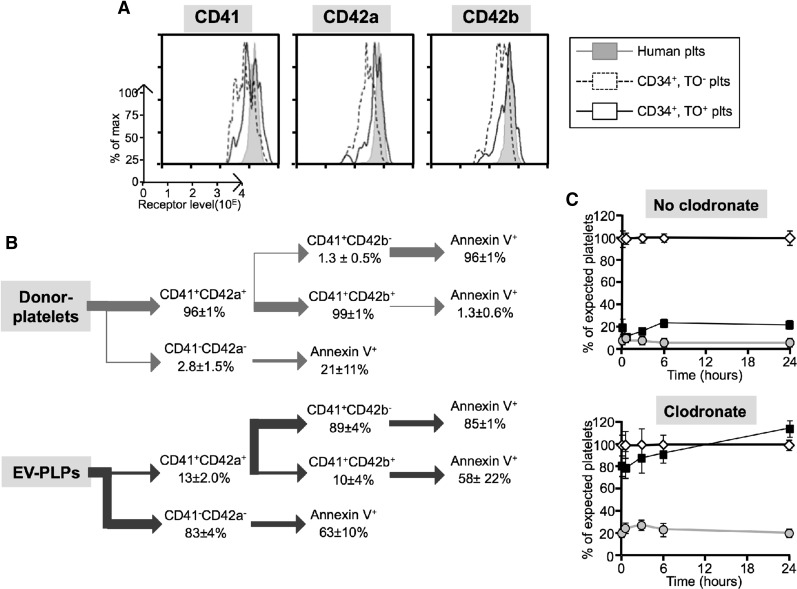
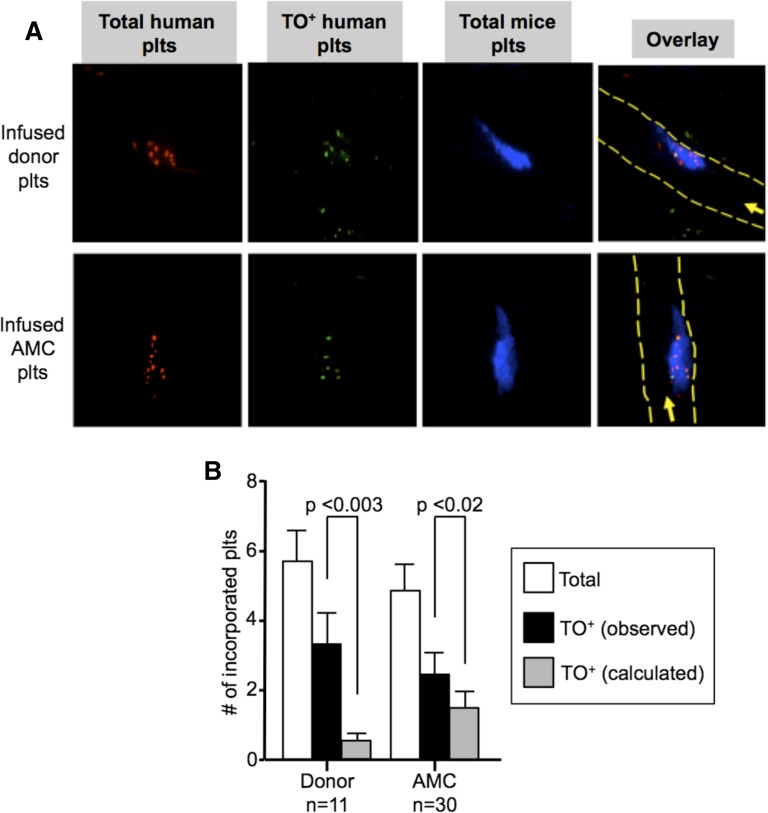
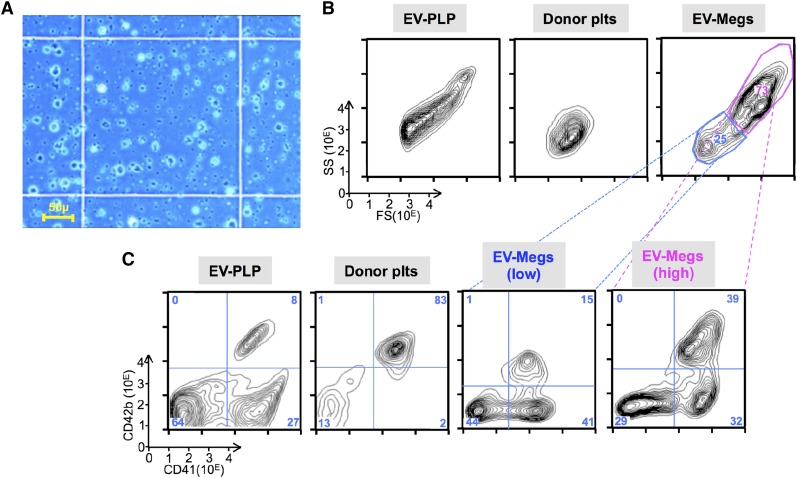
Thrombopoiesis is the process by which megakaryocytes release platelets that circulate as uniform small, disc-shaped anucleate cytoplasmic fragments with critical roles in hemostasis and related biology. The exact mechanism of thrombopoiesis and the maturation pathways of platelets released into the circulation remain incompletely understood. We showed that ex vivo-generated murine megakaryocytes infused into mice release platelets within the pulmonary vasculature. Here we now show that infused human megakaryocytes also release platelets within the lungs of recipient mice. In addition, we observed a population of platelet-like particles (PLPs) in the infusate, which include platelets released during ex vivo growth conditions. By comparing these 2 platelet populations to human donor platelets, we found marked differences: platelets derived from infused megakaryocytes closely resembled infused donor platelets in morphology, size, and function. On the other hand, the PLP was a mixture of nonplatelet cellular fragments and nonuniform-sized, preactivated platelets mostly lacking surface CD42b that were rapidly cleared by macrophages. These data raise a cautionary note for the clinical use of human platelets released under standard ex vivo conditions. In contrast, human platelets released by intrapulmonary-entrapped megakaryocytes appear more physiologic in nature and nearly comparable to donor platelets for clinical application.


Figures

Figure 1
Figure 1
Infused human donor platelets and EV-megakaryocytes from different developmental stages into NSG mice. Donor platelets (plts) and megakaryocytes grown from AMC-, FLC-, and iPSC-derived hematopoietic progenitors were infused into NSG recipient mice. ND, not determined. (A) Degree of ploidy determined for the infused megakaryocytes before infusion showing representative studies. (B) Mean ± SEM for percent of peak human platelet counts determined over the first 48 hours after infusion. Each mouse was infused with 1 to 2.2 × 10⁶ megakaryocytes. The half-life is indicated by a gray rectangle beginning at peak platelet count. The half-life value and the number of independent studies done are indicated in each graph. N = number of independent studies done in duplicate. (C) Same as in B, but in mice that had been pretreated intravenously with clodronate-ladened liposomes.
Figure 2
Figure 2
Histologic examination of the lungs and spleens after infusion of AMC EV-megakaryocytes into NSG mice. (A) Temporal representative sections of the lungs in recipient animals after the infusion of human BrdU-labeled megakaryocytes into NSG mice. Counterstained with hematoxylin. Black bar = 100 µm at an original magnification of 40×. (B) Same as in A, but stained for human CD41. (C) Same as in A, but splenic tissue is presented.
Figure 3
Figure 3
Size distribution of platelets in recipient mice. (A) Representative flow cytometric studies from ≥5 studies 1 hour after infusion showing forward scatter distribution as an indicator of size for the recipient mice platelets (shaded gray) compared with infused human donor platelets (dotted line) to mice studied in parallel receiving infused EV-megakaryocytes (solid line) grown from AMCs (left), FLCs (center), and iPSCs (right). (B) Representative size distribution studies after infused AMC- or iPSC-derived EV-megakaryocytes as indicated ± clodronate-ladened liposome (clod) pretreatment of the recipient NSG mice as determined by forward scatter with recipient mice platelet size as an internal size standard. (C) Mean ± SEM of ≥5 studies per arm of changes after infused AMC (top) or iPSC (bottom) EV-megakaryocytes or donor platelets that are >90% of recipient mouse platelet size. In some studies, the recipient mice had been pretreated with clodronate-ladened liposomes.
Figure 4
Figure 4
Characterization young vs old platelets. (A) Representative field of AMC EV-megakaryocyte preparation on a hematocytometer before infusion. White arrows represent some of the visible platelet-size particles. Red arrows indicate large megakaryocyte-like cells, whereas a large cell with extended proplatelets/platelets is shown in the center (yellow arrow). Bar in left lower corner indicates size of the observed field. (B) Temporal profile of the percent of a circulating platelet population that are TO+. Thin gray horizontal bar is percent TO+ recipient murine platelets. Open squares are percent of infused human platelets that are TO+. Black squares are percent of derived platelets from infused AMC EV-megakaryocytes that are TO+, and gray squares are the same when infused into clodronate liposome-pretreated mice. Mean ± SEM are shown. N ≥ 5 studies per arm. (C) Representative temporal profiles of size as determined by forward scatter for TO+ (solid lines) and TO (dashed lines) platelets. Top row is recipient mice platelets after infused AMC EV-megakaryocytes. Second row is human platelets after infusion of donor platelets. Third and bottom row are human platelets derived from AMC EV-megakaryocytes without and with clodronate liposome pretreatment, respectively. (D) Graphs are percent of the maximum human platelet number (which occurred 1-hour after EV-megakaryocyte infusion) at each time point separated out by both TO staining and size. The AMC EV-megakaryocytes were infused into either mice that were untreated (top) or pretreated (bottom) with clodronate liposomes. Mean ± SEM are shown. N ≥ 5 studies per arm.
Figure 5
Figure 5
Rapid clearance of small human platelets. (A) Representative flow cytometric studies of surface receptor level for CD41, CD42a, and CD42b on infused human platelets (gray graph) or young and old platelets after AMC EV-megakaryocytes (dashed and solid line graph, respectively) at 1 hour after infusion. (B) Data summary of flow cytometric studies of isolated human donor platelets (top) or EV-PLPs (bottom) stained for the indicated surface markers or Annexin V binding. Mean ± SEM for each subpopulation. N = 3 separate studies for donor platelets and N = 4 for EV-PLPs, each in duplicate. (C) Human platelets either nonactivated (open diamonds) or after TRAP (filled squares) or CVX activation (gray circles) were infused into recipient NSG mice that were or were not preinfused with clodronate-ladened liposomes. The counts in the activated studies were normalized to parallel studies with nonactivated donor platelets. Mean ± SEM is shown. N = 5 studies, each done in duplicate.
Figure 6
Figure 6
In situ studies of incorporation of TO+ vs TO platelets into growing thrombi. (A) Representative confocal images after cremaster arteriole laser injuries in NSG mice done 0.5 to 1 hour after infusion of (top) human donor platelets or (bottom) AMC EV-megakaryocytes double-labeled with calcein violet (red) and TO (green) with double-labeled human platelets being yellow in the overlay (right). Incorporated murine platelets into the thrombi are in blue. In the overlay, the direction of flow is indicated by an arrow and the outline of the vessels by dashed yellow lines. (B) Mean ± SEM of total number of human platelets per thrombus (open bars), observed number of TO+ platelets per thrombus (black bars), and calculated number of TO+ platelets per thrombus based on the percent of human platelets in the circulation based on level of circulating human platelets determined on concurrent flow cytometric studies (gray bars). On the left are studies done after infused human donor platelets and on the right are the same after infused AMC EV-megakaryocytes.
Figure 7
Figure 7
Analysis of AMC EV-PLP preparation. (A) Representative field of an EV-PLP preparation on a hematocytometer before infusion. Bar in left lower corner indicates size of the observed field. (B) Representative size distribution of particles of the total preparation as determined by forward-scatter (FS) vs side-scatter (SS) for (left) EV-PLPs, (center) donor platelets, and (right) EV-megakaryocytes. (C) Representative surface expression of human CD41 and CD42b done on the same samples as in B. Percent of cells in each of 4 quadrants are noted. The AMC-megakaryocytes total preparation was also fractionated and gave low CD41+ (blue, 25% of the total) and high CD41+ (magenta, 73% of total) size preparations.

Comment in

Similar articles

Cited by

References

    1. Ware J, Corken A, Khetpal R. Platelet function beyond hemostasis and thrombosis. Curr Opin Hematol. 2013;20(5):451–456. - PMC - PubMed
    1. Rondina MT, Weyrich AS, Zimmerman GA. Platelets as cellular effectors of inflammation in vascular diseases. Circ Res. 2013;112(11):1506–1519. - PMC - PubMed
    1. Ho-Tin-Noé B, Demers M, Wagner DD. How platelets safeguard vascular integrity. J Thromb Haemost. 2011;9(Suppl 1):56–65. - PMC - PubMed
    1. Weyrich AS, Zimmerman GA. Platelets in lung biology. Annu Rev Physiol. 2013;75:569–591. - PMC - PubMed
    1. Machlus KR, Italiano JE., Jr The incredible journey: From megakaryocyte development to platelet formation. J Cell Biol. 2013;201(6):785–796. - PMC - PubMed

Publication types

Substances