

Radical re-appraisal of water structure in hydrophilic confinement
- PMID: 25843963
- PMCID: PMC4376068
- DOI: 10.1016/j.cplett.2013.10.075
Radical re-appraisal of water structure in hydrophilic confinement
Abstract
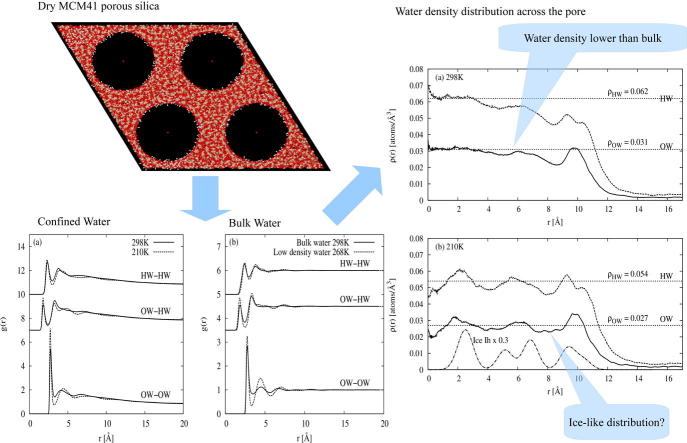
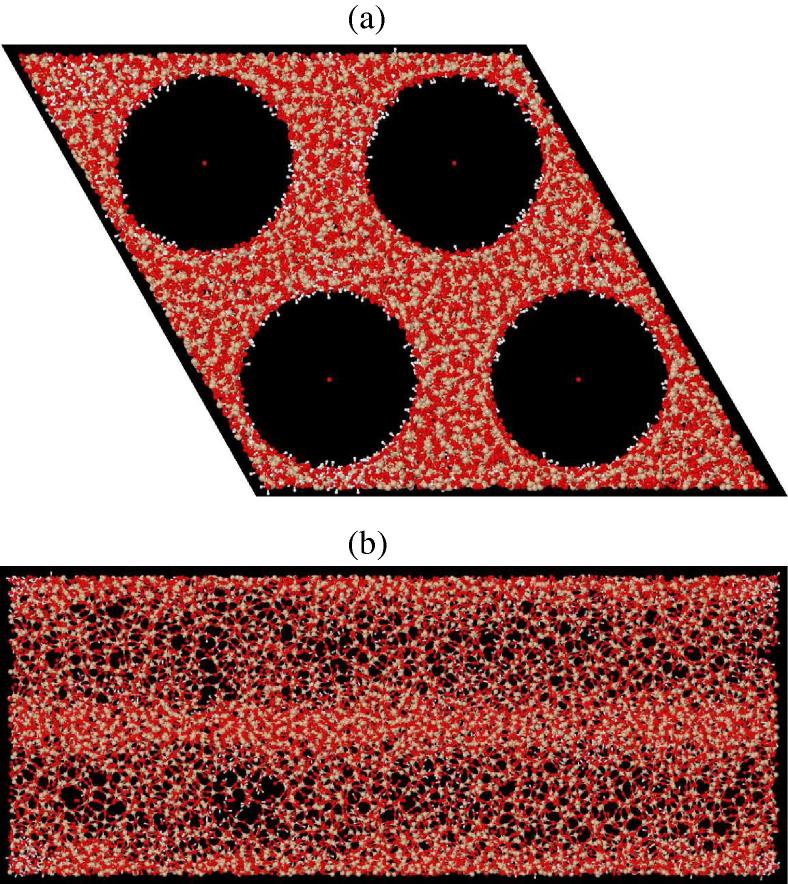
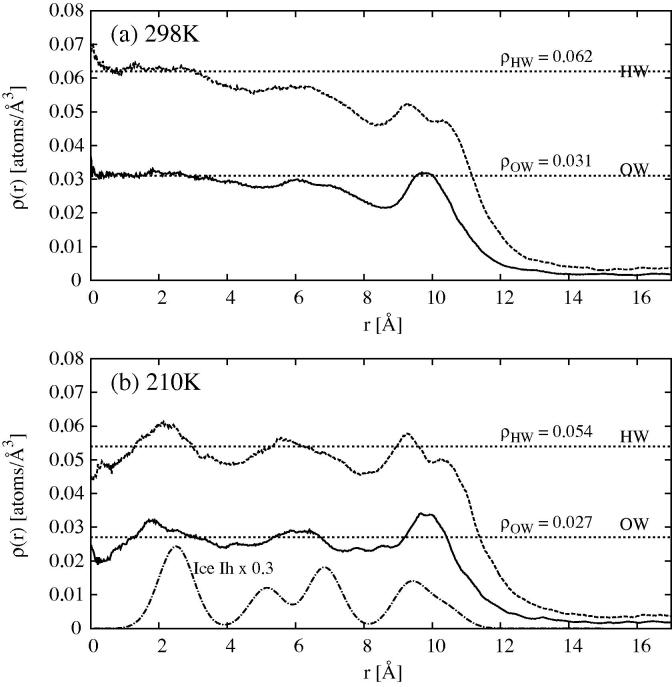
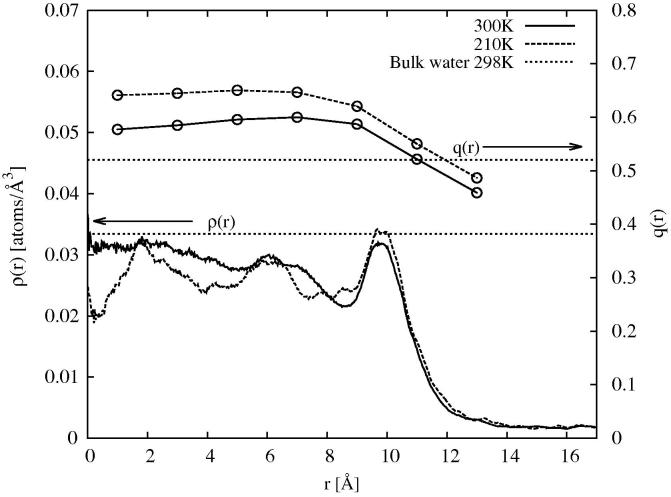
The structure of water confined in MCM41 silica cylindrical pores is studied to determine whether confined water is simply a version of the bulk liquid which can be substantially supercooled without crystallisation. A combination of total neutron scattering from the porous silica, both wet and dry, and computer simulation using a realistic model of the scattering substrate is used. The water in the pore is divided into three regions: core, interfacial and overlap. The average local densities of water in these simulations are found to be about 20% lower than bulk water density, while the density in the core region is below, but closer to, the bulk density. There is a decrease in both local and core densities when the temperature is lowered from 298 K to 210 K. The radical proposal is made here that water in hydrophilic confinement is under significant tension, around -100 MPa, inside the pore.
Figures
Similar articles
-
Density profile of water confined in cylindrical pores in MCM-41 silica.J Phys Condens Matter. 2012 Feb 15;24(6):064107. doi: 10.1088/0953-8984/24/6/064107. Epub 2012 Jan 25. J Phys Condens Matter. 2012. PMID: 22277549
-
Self-intermediate scattering function analysis of supercooled water confined in hydrophilic silica nanopores.J Chem Phys. 2017 Jun 7;146(21):214501. doi: 10.1063/1.4984764. J Chem Phys. 2017. PMID: 28595416 Free PMC article.
-
Ice crystallization observed in highly supercooled confined water.Phys Chem Chem Phys. 2019 Feb 27;21(9):4931-4938. doi: 10.1039/c8cp07585a. Phys Chem Chem Phys. 2019. PMID: 30758013
-
Low temperature phase properties of water confined in mesoporous silica MCM-41: thermodynamic and neutron scattering study.J Chem Phys. 2013 May 28;138(20):204714. doi: 10.1063/1.4807593. J Chem Phys. 2013. PMID: 23742507
-
Self-Diffusion in Confined Water: A Comparison between the Dynamics of Supercooled Water in Hydrophobic Carbon Nanotubes and Hydrophilic Porous Silica.Int J Mol Sci. 2022 Nov 20;23(22):14432. doi: 10.3390/ijms232214432. Int J Mol Sci. 2022. PMID: 36430907 Free PMC article.
Cited by
-
Segregated water observed in a putative fish embryo cryopreservative.R Soc Open Sci. 2016 Mar 2;3(3):150655. doi: 10.1098/rsos.150655. eCollection 2016 Mar. R Soc Open Sci. 2016. PMID: 27069654 Free PMC article.
-
Confinement Effects on the Benzene Orientational Structure.Angew Chem Int Ed Engl. 2018 Apr 16;57(17):4565-4570. doi: 10.1002/anie.201713115. Epub 2018 Mar 13. Angew Chem Int Ed Engl. 2018. PMID: 29446870 Free PMC article.
-
Ordered Mesoporous Silica Prepared in Different Solvent Conditions: Application for Cu(II) and Pb(II) Adsorption.Gels. 2022 Jul 15;8(7):443. doi: 10.3390/gels8070443. Gels. 2022. PMID: 35877528 Free PMC article.
-
Highly compressed water structure observed in a perchlorate aqueous solution.Nat Commun. 2017 Oct 13;8(1):919. doi: 10.1038/s41467-017-01039-9. Nat Commun. 2017. PMID: 29030555 Free PMC article.
-
Walking on water: revisiting the role of water in articular cartilage biomechanics in relation to tissue engineering and regenerative medicine.J R Soc Interface. 2022 Aug;19(193):20220364. doi: 10.1098/rsif.2022.0364. Epub 2022 Aug 3. J R Soc Interface. 2022. PMID: 35919975 Free PMC article. Review.
References
-
- Poole P.H., Sciortino F., Essmann U., Stanley H.E. Nature. 1992;360:324.
-
- Stanley H., Angell C., Essmann U., Hemmati M., Poole P., Sciortino F. Phys. A Statist. Mech. Appl. 1994;205:122.
-
- Harrington S., Zhang R., Poole P.H., Sciortino F., Stanley H.E. Phys. Rev. Lett. 1997;78:2409.
-
- Brovchenko I., Geiger A., Oleinikova A. J. Chem. Phys. 2005;123:044515. - PubMed
-
- Liu Y., Panagiotopoulos A.Z., Debenedetti P.G. J. Chem. Phys. 2009;131:104508.
LinkOut - more resources
Full Text Sources
Other Literature Sources