. 2015 Apr 16;58(2):323-38.
doi: 10.1016/j.molcel.2015.02.031. Epub 2015 Apr 2.

ATR-mediated phosphorylation of FANCI regulates dormant origin firing in response to replication stress

Affiliations

ATR-mediated phosphorylation of FANCI regulates dormant origin firing in response to replication stress

Yu-Hung Chen et al. Mol Cell. .

Abstract

Excess dormant origins bound by the minichromosome maintenance (MCM) replicative helicase complex play a critical role in preventing replication stress, chromosome instability, and tumorigenesis. In response to DNA damage, replicating cells must coordinate DNA repair and dormant origin firing to ensure complete and timely replication of the genome; how cells regulate this process remains elusive. Herein, we identify a member of the Fanconi anemia (FA) DNA repair pathway, FANCI, as a key effector of dormant origin firing in response to replication stress. Cells lacking FANCI have reduced number of origins, increased inter-origin distances, and slowed proliferation rates. Intriguingly, ATR-mediated FANCI phosphorylation inhibits dormant origin firing while promoting replication fork restart/DNA repair. Using super-resolution microscopy, we show that FANCI co-localizes with MCM-bound chromatin in response to replication stress. These data reveal a unique role for FANCI as a modulator of dormant origin firing and link timely genome replication to DNA repair.


Figures

Figure 1
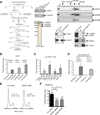
Figure 1. FANCI interacts with the MCM replicative helicase complex
(A) Purification scheme of the FANCI complex from HeLa nuclear extracts. After DEAE-cellulose chromatography, FANCI and FANCD2 are separated. The polypeptides that co-eluted with FANCI at the last chromatographic step were visualized by silver stain and identified by MS. Gel filtration fractions from Superose 6 were probed with antibodies against FANCI, MCM3 and MCM5. Co-IP was done using the indicated antibodies from U2OS nuclear extracts. (B-D) Enrichment of DNA obtained with antibodies against FANCI, MCM5, or ORC2 as determined by ChIP analysis using chromatin prepared from HeLa or FA-A (FANCA-deficient patient) cells corrected with FANCA WT or empty vector. Quantitative PCR analysis was performed using primer sequences for validated origin sites or their upstream counterpart as indicated (Salsi et al., 2009). Results are displayed as fold increase as compared to IgG Ctrl (anti-GFP). In D, differences in fold increase between FA-A + FANCA WT and FA-A + Vector for LaminB Ori is not significant (p>0.05). (E) FACS analysis showing normal cell cycle distribution between Ctrl and FANCI siRNA knockdown U2OS cells. (F) U2OS cells were transfected with the indicated siRNAs and treated with 200 µM HU for 4 h followed by a 30 min EdU pulse. DNA and EdU content were analyzed by FACS and displayed as % EdU-positive cells. For all of the figures, the asterisks represent either *p<0.05, **p<0.01, ***p<0.001, or ****p<0.0001.
Figure 2
Figure 2. FANCI is required for dormant origin firing during conditions of replication stress
(A) Schematic for DNA fiber analysis. RPE cells were treated with 200 µM HU for 4 h and then pulse-labeled sequentially with IdU (green) and CldU (red) for 20 min each in the presence of HU after separate washes. Images depicting the different classes of replication structures used to determine the frequency of replication origins. DNA fibers were extracted, denatured and stained by antibodies on the slides. (B) RPE cells were transfected with the indicated siRNAs and treated with different HU doses for 4 or 18 h. Samples were then analyzed by Western blot to confirm knockdown efficiency. The monoubiquitinated form of either FANCI or FANCD2 is represented by the slower-migrating band. (C) The percentage of new origin firing (counted as the sum of second label firing and bi-directional forks over the total number of different replication structures) was measured in RPE cells transfected with the indicated siRNAs and left untreated or treated with 200 µM HU. (D) The percentage of stalled and terminated forks were also measured and quantified as in (C). (E) The percentage of new origin firing was measured in FANCD2-deficient patient cells (PD20) complemented with either vector only, FANCD2 WT or FANCD2 K561R mutant and left untreated or treated with HU as in (C). (F) RPE cells were transfected with the indicated siRNAs and left untreated or treated with 200 µM HU and DNA fibers were analyzed for changes in inter-origin distances. Inter-origin distances were measured as the distance between two adjacent initiation sites during IdU pulse, and median values are indicated in kilobases (kb). Over 50 fibers were analyzed in each condition. Box and whiskers in all graphs indicate 25%-75% and 10%-90% percentiles, respectively. The lines represent the median values. For the measurement of inter-origin distances, the p value was calculated by the Mann-Whitney rank sum t-test.
Figure 3
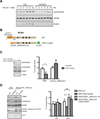
Figure 3. MCM4 N-terminal mutant bypasses the requirement of FANCI for dormant origin firing
(A) RPE cells transfected with either Ctrl or FANCI siRNAs were treated with 100 µM HU for the indicated times (h). Western blot analysis was performed and probed with the indicated antibodies. (B) Schematic of MCM4 N-terminal deletion mutant (MCM4_Δ90N-term). (C) RPE cells or RPE cells stably expressing MCM4_Δ90N-term were treated with or without the Cdc7 inhibitor (PHA 767491) at 5 uM for 4 h and analyzed by Western blot (RPE cells only) and by DNA fiber analysis for % origin firing. (D) Western blot analysis of normal RPE cells or RPE cells stably expressing MCM4_Δ90N-term after transfection with either Ctrl or FANCI siRNAs (untreated) were probed with the indicated antibodies. Comparison of % origin firing in RPE cells versus RPE cells stably expressing MCM4_Δ90N-term were transfected with Ctrl or FANCI siRNA and treated with or without 200 µM HU.
Figure 4
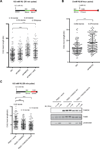
Figure 4. FANCD2 restricts replication fork speed after HU treatment in a monoubiquitination-independent manner
(A-C) Schematics of treatment with HU and pulse labeling with IdU and CldU are shown. Replication fork lengths (Jackson and Pombo, 1998) were obtained by converting the CldU track size in uM to kb and analyzed in the siRNA-transfected RPE cells or PD20 cells treated with the indicated dose of HU. Average fork speeds are calculated by dividing the track lengths by the labeling time and depicted above the track lengths. Western blot analysis of PD20 cells is shown and probed with the indicated antibodies. For the measurement of track length distributions for replication fork speeds, the p value was calculated by the Mann-Whitney rank sum t-test.
Figure 5
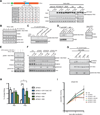
Figure 5. ATR-mediated Phosphorylation of FANCI inhibits dormant origin firing
(A) Schematic of the conserved ATR phospho-consensus S/T-Q sites on human FANCI. Rescue of FANCI-depleted RPE cells with stably expressed siRNA-resistant GFP-FANCI WT, K523R (monoubiquitination deficient), 6SA and 6SD mutants; probed with the indicated antibodies for Western blot analysis. (B) Time-course experiment of HU-treated (2mM) HeLa cells was analyzed by Western blot and probed with the pS(556 + 559) FANCI phospho-specific antibody and other antibodies as indicated. Slower-migrating phosphorylated FANCI band corresponds to the monoubiquitinated FANCI band. (C) RPE cells transfected with FANCI siRNA and complemented with either GFP-FANCI WT, K523R, or 6SA were untreated or treated with MMC (1 µM). Extracts were subjected to co-IP with anti-GFP beads and analyzed by Western blot with the indicated antibodies. (D) RPE cells treated with either HU (2 mM) or MMC (1 µM) for the indicated times were subjected to co-IP with anti-FANCI antibody or IgG control and analyzed by Western blot with the indicated antibodies. (E) RPE cells were treated with HU (2 mM) for 18 h with or without the ATR inhibitor (VE-821) at 10 uM for 4 h as indicated and analyzed by Western blot. (F) RPE cells transfected with the indicated siRNAs and treated with the indicated dose of HU for 18 h and analyzed by Western blot. (G) RPE cells transfected with Ctrl or FANCI siRNA and complemented with either GFP-FANCI WT, 6SA, K523R, or 6SD mutants were treated with HU (2 mM) and subjected to co-IP with anti-GFP beads and analyzed by Western blot with the indicated antibodies. (H) Measurement of % origin firing in FANCI-depleted RPE cells complemented with different GFP-FANCI expression constructs and treated with 200 µM HU. (I) Measurement of cell proliferation in HU-treated RPE cells as indicated. P values for Ctrl vs siFANCI or siFANCI vs siFANCI + WT, + 6SA, or + K523R are < 0.05 for the 7 day time point. P value for siFANCI vs siFANCI + 6SD is > 0.05.
Figure 6
Figure 6. Phosphorylation of FANCI is required for replication fork restart during replication stress
(A)A schematic for measuring replication fork restart using DNA fiber technique. Cells are labeled first with IdU for 20 min, then treated with 2 mM HU for 4 h to block DNA replication. Following a wash step to remove the HU, cells are then pulsed with CldU for 30 min. Regions on the DNA fibers with both colors labeled demonstrate fork restart, whereas fibers with only the green track represent forks that could not restart. The frequency of “green only” tracks over total forks is displayed as % of stalled forks. FANCI-depleted RPE cells complemented with different FANCI WT and mutant expression constructs or RPE cells depleted of FANCA or FANCD2 by siRNAs were treated with 2 mM HU for 4 h to measure stalled forks and samples were analyzed by Western blot with the indicated antibodies. (B) Schematic of MMC-treated RPE cells that are analyzed for % origin firing. RPE cells depleted of FANCI and complemented with different GFP-FANCI expression constructs as indicated were processed for % origin firing measurements. (C) MMC sensitivity growth assay displayed as % cell survival using Syto60 staining with the indicated MMC dose in RPE cells. P values for Ctrl vs siFANCI or siFANCI vs siFANCI + WT or + 6SA are < 0.05 for the 0.4 nM MMC dose. P values for siFANCI vs siFANCI + 6SD or + K523R are > 0.05 at the same dose.
Figure 7
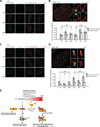
Figure 7. Super-resolution imaging detects FANCI co-localization with the MCM complex
(A and C) SR images of the nuclei of U2OS cells stably expressing either FLAP-tagged FANCI WT (top row), 6SA (middle), or 6SD (bottom) that is treated with 200 µM (+HU) and pulsed labeled with EdU for 1 h. Localization of MCM5, FANCD2, FANCI, and newly synthesized DNA were visualized using antibodies against MCM5, FANCD2 or GFP (FANCI) and direct labeling of EdU with Click-iT chemistry (Scale bar, 5 µm). (B and D) Co-localization (overlap) measurements of FANCI with either MCM5 or FANCD2 as revealed by SR imaging. The magnified images depict an SR image of either a FANCI 6SA or 6SD mutant-expressing U2OS nucleus treated with HU (MCM5, green; FANCD2, green; FANCI, blue; newly synthesized DNA, red; scale bar, 3 µm). The magnification of the marked region (i) shows an example of a localization overlap event between MCM5 (or FANCD2) and FANCI in the way of either two-color co-localization, i(a), or two-color overlap, i(b); while the magnification of region (ii) shows an example of a lack of a localization overlap event between the two proteins as in (i) with the two-color co-localization, ii(a), or two-color overlap, ii(b) (scale bar, 500 nm). The graphs in B and D depict the average number of overlap events normalized between MCM5 (or FANCD2) and FANCI from the nuclei of either WT, 6SA or 6SD-expressing U2OS cells. The grey bar shows the average number of overlaps between MCM5 (or FANCD2) and FANCI from the same nuclei (intra-overlap); these events are related and therefore represent a non-random occurrence. In contrast, the white bar shows the average number of overlaps detected between different nuclei (inter-overlap); these events are unrelated and represent a random occurrence. (E) Cartoon model depicting how a phosphorylation switch mediated by the ATR kinase (and an unknown protein phosphatase) can exert control over FANCI to either activate or inhibit dormant origin firing in response to different levels or types of replication stress. Cells exposed to minimal levels of replication stress will result in more dormant origin firing to help rescue slowed or stalled forks. During low levels of replication stress, dormant origin firing is likely operational as a default setting due to the absence of ATR signaling. In contrast, higher exposure to DNA damage or replication stress will result in robust and sustained ATR activation, leading to FANCI and Chk1 phosphorylation and reduced dormant origin firing. This may give cells more time to activate DNA repair and restart replication forks; both of these events could be mediated, in part, through FANCI phosphorylation and monoubiquitination. FANCD2 has an unanticipated role in inhibiting FANCI-mediated dormant origin firing, independent of its monoubiquitination status. FANCI can activate dormant origins by promoting DDK-dependent phosphorylation of MCM complexes to relieve MCM proteins from its inhibitory state. We predict that phosphorylation of FANCI will shift the pool of FANCI from MCM-bound dormant origins to stalled replication forks.

Similar articles

Cited by

References

    1. Agullo-Pascual E, Reid DA, Keegan S, Sidhu M, Fenyö D, Rothenberg E, Delmar M. Super-resolution fluorescence microscopy of the cardiac connexome reveals plakophilin-2 inside the connexin43 plaque. Cardiovasc Res. 2013;100:231–240. - PMC - PubMed
    1. Alver RC, Chadha GS, Blow JJ. The contribution of dormant origins to genome stability: from cell biology to human genetics. DNA Repair (Amst) 2014;19:182–189. - PMC - PubMed
    1. Aris SM, Pommier Y. Potentiation of the novel topoisomerase I inhibitor indenoisoquinoline LMP-400 by the cell checkpoint and Chk1-Chk2 inhibitor AZD7762. Cancer Res. 2012;72:979–989. - PMC - PubMed
    1. Auerbach AD, Wolman SR. Susceptibility of Fanconi’s anaemia fibroblasts to chromosome damage by carcinogens. Nature. 1976;261:494–496. - PubMed
    1. Bell SD, Botchan MR. The minichromosome maintenance replicative helicase. Cold Spring Harb Perspect Biol. 2013;5:a012807. - PMC - PubMed

Publication types

MeSH terms

LinkOut - more resources