. 2015 Apr 2;96(4):597-611.
doi: 10.1016/j.ajhg.2015.02.017.

Genomic analyses reveal mutational signatures and frequently altered genes in esophageal squamous cell carcinoma

Affiliations

Genomic analyses reveal mutational signatures and frequently altered genes in esophageal squamous cell carcinoma

Ling Zhang et al. Am J Hum Genet. .

Erratum in

  • Am J Hum Genet. 2015 Nov 5;97(5):769
  • Genomic Analyses Reveal Mutational Signatures and Frequently Altered Genes in Esophageal Squamous Cell Carcinoma.
    Zhang L, Zhou Y, Cheng C, Cui H, Cheng L, Kong P, Wang J, Li Y, Chen W, Song B, Wang F, Jia Z, Li L, Li Y, Yang B, Liu J, Shi R, Bi Y, Zhang Y, Wang J, Zhao Z, Hu X, Yang J, Li H, Gao Z, Chen G, Huang X, Yang X, Wan S, Chen C, Li B, Tan Y, Chen L, He M, Xie S, Li X, Zhuang X, Wang M, Xia Z, Luo L, Ma J, Dong B, Zhao J, Song Y, Ou Y, Li E, Xu L, Wang J, Xi Y, Li G, Xu E, Liang J, Yang X, Guo J, Chen X, Zhang Y, Li Q, Liu L, Li Y, Zhang X, Yang H, Lin D, Cheng X, Guo Y, Wang J, Zhan Q, Cui Y. Zhang L, et al. Am J Hum Genet. 2020 Aug 6;107(2):375. doi: 10.1016/j.ajhg.2020.07.008. Am J Hum Genet. 2020. PMID: 32763191 Free PMC article. No abstract available.
  • Genomic Analyses Reveal Mutational Signatures and Frequently Altered Genes in Esophageal Squamous Cell Carcinoma.
    Zhang L, Zhou Y, Cheng C, Cui H, Cheng L, Kong P, Wang J, Li Y, Chen W, Song B, Wang F, Jia Z, Li L, Li Y, Yang B, Liu J, Shi R, Bi Y, Zhang Y, Wang J, Zhao Z, Hu X, Yang J, Li H, Gao Z, Chen G, Huang X, Yang X, Wan S, Chen C, Li B, Tan Y, Chen L, He M, Xie S, Li X, Zhuang X, Wang M, Xia Z, Luo L, Ma J, Dong B, Zhao J, Song Y, Ou Y, Li E, Xu L, Wang J, Xi Y, Li G, Xu E, Liang J, Yang X, Guo J, Chen X, Zhang Y, Li Q, Liu L, Li Y, Zhang X, Yang H, Lin D, Cheng X, Guo Y, Wang J, Zhan Q, Cui Y. Zhang L, et al. Am J Hum Genet. 2020 Sep 3;107(3):579. doi: 10.1016/j.ajhg.2020.08.012. Am J Hum Genet. 2020. PMID: 32888509 Free PMC article. No abstract available.

Abstract

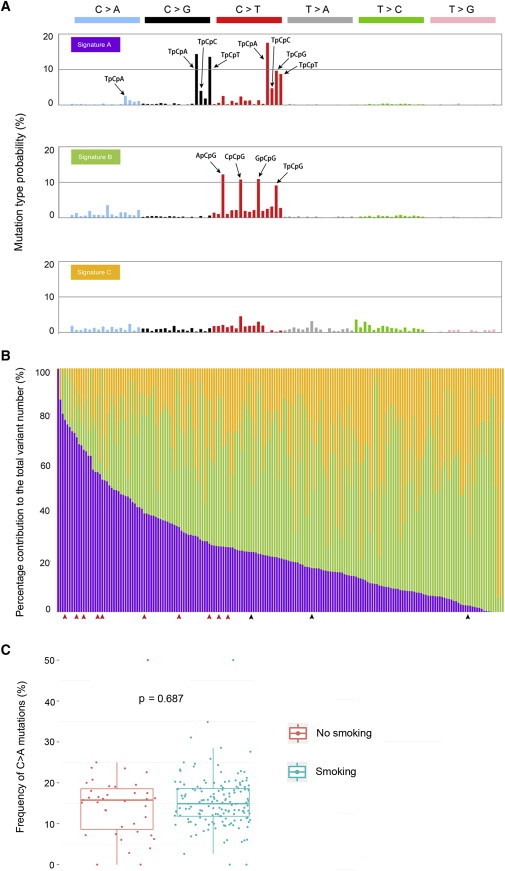
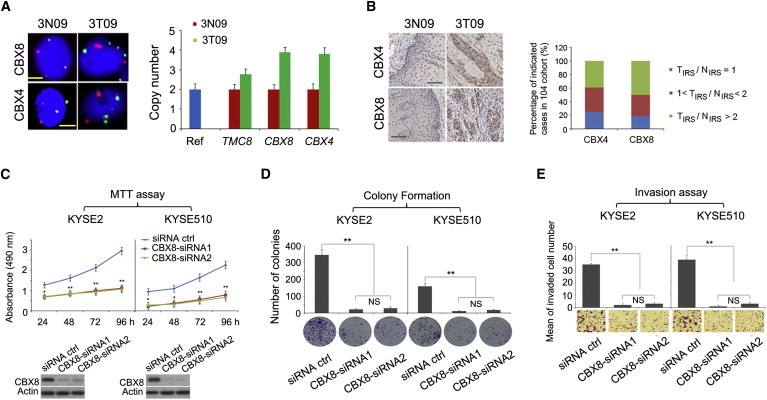
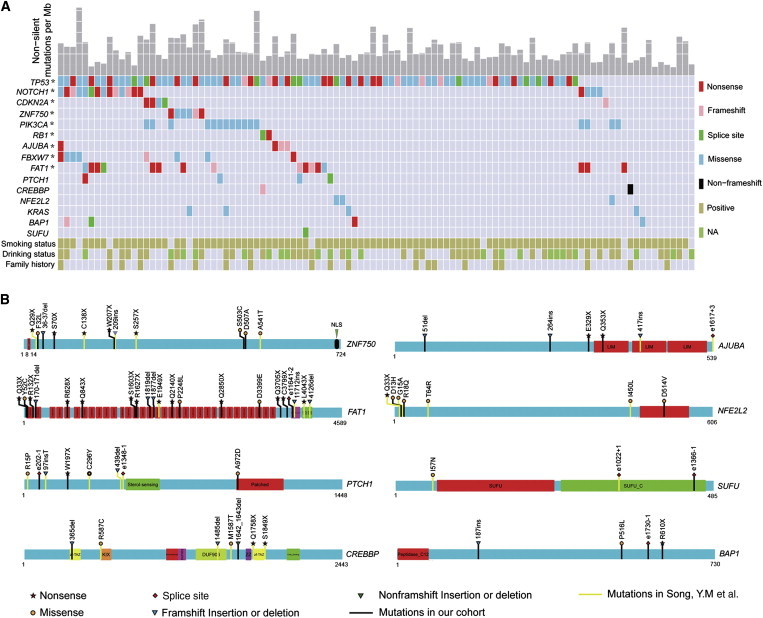
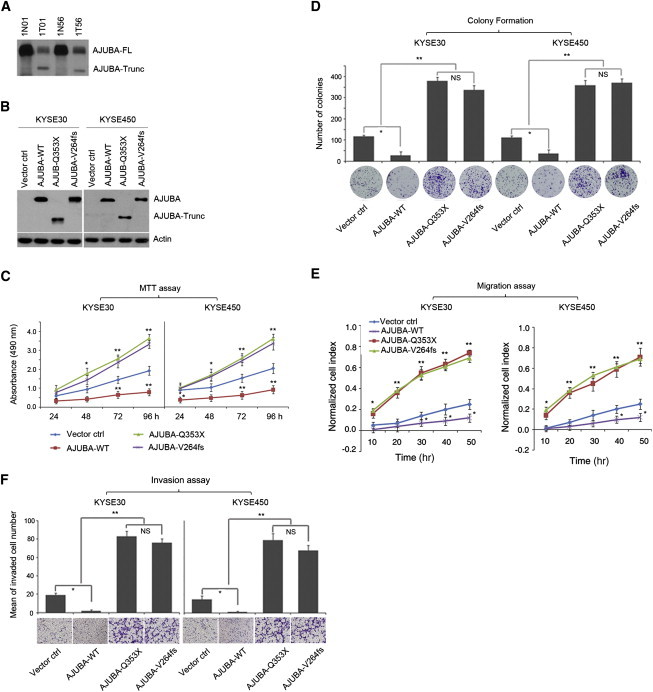
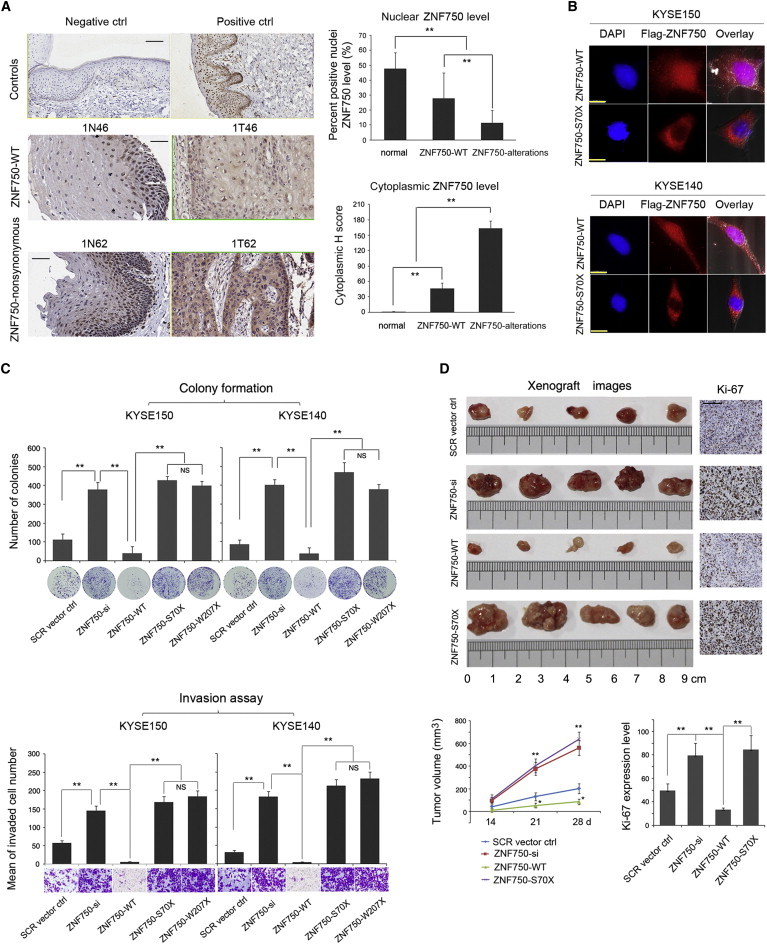
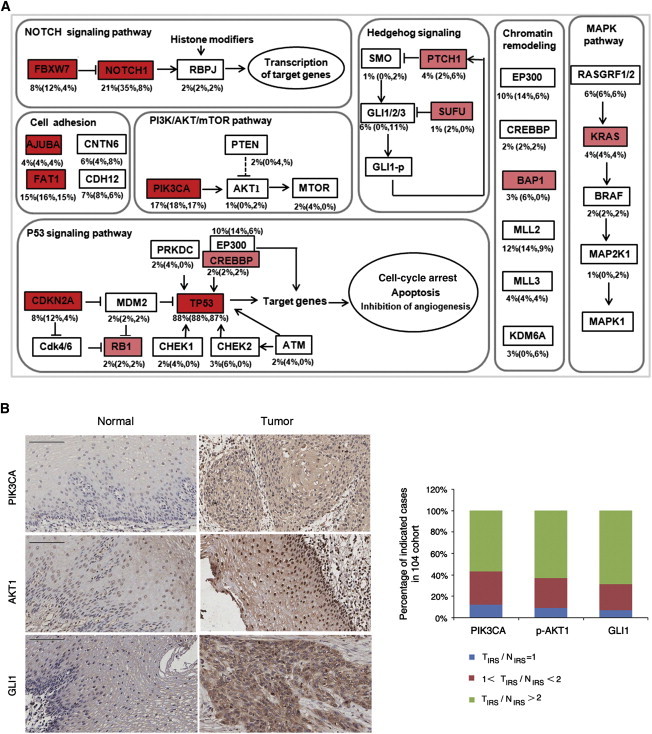
Esophageal squamous cell carcinoma (ESCC) is one of the most common cancers worldwide and the fourth most lethal cancer in China. However, although genomic studies have identified some mutations associated with ESCC, we know little of the mutational processes responsible. To identify genome-wide mutational signatures, we performed either whole-genome sequencing (WGS) or whole-exome sequencing (WES) on 104 ESCC individuals and combined our data with those of 88 previously reported samples. An APOBEC-mediated mutational signature in 47% of 192 tumors suggests that APOBEC-catalyzed deamination provides a source of DNA damage in ESCC. Moreover, PIK3CA hotspot mutations (c.1624G>A [p.Glu542Lys] and c.1633G>A [p.Glu545Lys]) were enriched in APOBEC-signature tumors, and no smoking-associated signature was observed in ESCC. In the samples analyzed by WGS, we identified focal (<100 kb) amplifications of CBX4 and CBX8. In our combined cohort, we identified frequent inactivating mutations in AJUBA, ZNF750, and PTCH1 and the chromatin-remodeling genes CREBBP and BAP1, in addition to known mutations. Functional analyses suggest roles for several genes (CBX4, CBX8, AJUBA, and ZNF750) in ESCC. Notably, high activity of hedgehog signaling and the PI3K pathway in approximately 60% of 104 ESCC tumors indicates that therapies targeting these pathways might be particularly promising strategies for ESCC. Collectively, our data provide comprehensive insights into the mutational signatures of ESCC and identify markers for early diagnosis and potential therapeutic targets.


Figures

Figure 1
Figure 1
Three Mutational Signatures Identified in ESCC and Their Incidence across the 192 Tumor Samples (A) Ninety-six substitution classifications from WGS or WES data derived from the 192 pairs of ESCC samples, including 88 samples from Song et al. Mutation types are displayed in different colors on the horizontal axis. The vertical axis depicts the percentage of mutations attributed to a specific mutation type. (B) The contributions of mutational signatures to individual tumors. Each bar represents a sample, and samples are ordered by the proportion of signature A found in them. The three mutational signatures are represented by the different colors shown in (A). For signature A, a significant number of mutations in a sample is defined as more than 100 substitutions in total or more than 25% of all mutations in that sample. Red or black triangles indicate samples harboring the PIK3CA c.1624G>A (p.Glu542Lys) or c.1633G>A (p.Glu545Lys) mutation, respectively. (C) Boxplot of the proportion of C>A transversions in individuals with or without a smoking history. Each dot represents the proportion of C>A mutations in one individual; Student’s t test was used to compare the difference between the two groups. Data represent the mean ± SD.
Figure 2
Figure 2
Amplified Genes Identified in ESCC by GISTIC (A) CBX4 and CBX8 were amplified in ESCC tumors. Left panel: immunofluorescence images show signals produced from FISH analyses using probes specific to chromosomal region 5q (red, control) and CBX4 or CBX8 (green) in ESCC samples 3N09 and 3T09. Scale bars represent 5 μm. Right panel: CBX4 and CBX8 copy number was assayed by qPCR in 3N09 and 3T09. RPPH1 was used as a normal reference, and TMC8 (located near this region) was used as a focal CNA control. Data represent the mean ± SD. All assays were performed in triplicate. (B) The amounts of CBX4 and CBX8 were increased in ESCC tumors. Representative immunohistochemistry images show CBX4 or CBX8 levels in the same tumor. The bar graph shows the percentage of indicated individuals with different CBX4 or CBX8 levels in the 104-individual ESCC cohort. CBX4 or CBX8 levels were based on subjective assessment of immunohistochemical staining intensity (see Material and Methods). Scale bars represent 400 μm. (C–E) Depletion of CBX8 in KYSE2 and KYSE510 cells significantly inhibited cell proliferation, as measured by MTT assay (C), colony-formation assays (D), and cell invasion (E). Knockdown of CBX8 is demonstrated by immunoblotting (bottom of C); β-actin was used as a loading control. Data represent the mean ± SD. At least three independent experiments were performed in triplicate. Statistical analysis was performed with a two-sided t test. ∗∗p < 0.01, p < 0.05.
Figure 3
Figure 3
Somatic Mutations of Candidate Cancer-Associated Genes, Ranked by Significance across 192 Tumors (A) Candidate driver genes were identified via MutSigCV significance analysis. The gray histogram at the top shows the number of mutations per megabase in each sample, and each rectangle represents 1 Mb. The main section shows each mutation type for every sample, including the total number of mutated samples per gene; mutation subtypes are denoted by color. If multiple mutations were observed within a gene in a single sample, only one is shown. The candidate cancer-associated genes are shown on the left: genes marked by an asterisk have a q value of <0.1. The bottom three rows indicate smoking status, drinking status, and family history. NA means that the condition remains unknown, and “positive” means that the individual has the condition shown on the left. The full list of mutated genes is provided in Table S3. (B) A schematic representation of the domain structure of proteins (ZNF750, AJUBA, FAT1, NFE2L2, PTCH1, SUFU, CREBBP, and BAP1) encoded by SMGs shows the location of somatic variants identified in ESCC tumors. DNA mutations and amino acid changes are shown. The C-terminal nuclear localization sequence (NLS) of ZNF750 is shown in black.
Figure 4
Figure 4
AJUBA Acts as a Tumor Suppressor in ESCC (A) Immunoblotting validation of truncated AJUBA proteins in two identified ESCC tumors. (B–F) The effect of wild-type and altered AJUBA on cell growth, cell migration, and cell invasion, as monitored by MTT assay (C), colony-formation assay (D), and cell-migration and cell-invasion assays in an xCELLigence RTCA DP system (E and F). The presence of wild-type AJUBA or AJUBA altered by p.Gln353 (p.Q353X) or p.Val264fs (p.V264fs) in KYSE30 and KYSE150 cells was confirmed by immunoblotting with anti-AJUBA antibody, which recognizes the N terminus of AJUBA (B). These cell lines all have a low level of endogenous AJUBA. Data represent the mean ± SD; three independent experiments were performed in triplicate. Statistical analysis was performed with a two-sided t test. ∗∗p < 0.01, p < 0.05.
Figure 5
Figure 5
ZNF750 Acts as a Tumor Suppressor in ESCC (A) Immunohistochemical analysis shows ZNF750 staining in esophageal tissues and matched normal tissue of ESCC-affected individuals harboring wild-type ZNF750 (ZNF750-WT, second row) or nonsynonymous alterations (ZNF750-nonsynonmyous, third row). Negative and positive controls are normal skin samples (first row). Graphs (right) show nuclear (top) and cytoplasmic (bottom) amounts of ZNF750 in ESCC and normal esophageal tissue on the basis of a subjective assessment of immunohistochemical staining intensity (see Material and Methods, χ2 test, ∗∗p < 0.01, p < 0.05). Scale bars represent 400 μm. (B) Immunofluorescence of FLAG-tagged wild-type ZNF750 (ZNF750-WT, first and third rows) and p.Ser70 ZNF750 (ZNF750-S70X, second and fourth rows) in KYSE150 (top) and KYSE140 (bottom) cells. DAPI labels the nucleus. Scale bars represent 10 μm. (C) Endogenous ZNF750 was stably knocked down in KYSE150 and KYSE140 cells and then forced to encode FLAG-tagged wild-type ZNF750 (ZNF750-WT) or the p.Ser70 (ZNF750-S70X) or p.Trp207 (ZNF750-W207X) variant. Cell proliferation was monitored by colony-formation assay. SCR indicates scramble control. The data represent the mean ± SD; three independent experiments were performed in triplicate. Data were statistically analyzed by a two-sided t test. ∗∗p < 0.01, p < 0.05. (D) Tumor xenografts show significant growth inhibition of cells overexpressing WT ZNF750. Five representative tumors are shown: (from top to bottom) the SCR vector control, ZNF750 knockdown (ZNF750-si), wild-type ZNF750 (ZNF750-WT), and the p.Ser70 variant (ZNF750-S70X) (n = 6 per group). The graph at the bottom left shows tumor volumes. Immunohistochemical analyses of Ki-67 are also shown (in the images on the right [the scale bar represents 200 μm] and the graph at the bottom right). Data represent the mean ± SD. ∗∗p < 0.01, p < 0.05.
Figure 6
Figure 6
Altered Pathways in ESCC (A) Key cancer pathway components altered in ESCC. ESCC potential driver genes and their mutation frequencies were mapped to the following major groups: NOTCH signaling, PI3K pathway, p53 pathway, Hh pathway, MAPK pathway, chromatin remodeling, and regulation of cell adhesion. Alteration frequencies are shown as a percentage of those in all samples; genes identified as SMGs by the MutSigCV analytical method are colored in red. Excitatory (arrows) and inhibitory (black lines) interactions were taken from the KEGG pathway database. (B) Representative immunohistochemistry images show PIK3CA, AKT1, or GLI1 levels in tumors and matched normal tissues. The bar graph shows PIK3CA, AKT1, or GLI1 levels on the basis of a subjective assessment of immunohistochemical staining intensity. Scale bars represent 400 μm.

Similar articles

Cited by

References

    1. Pennathur A., Gibson M.K., Jobe B.A., Luketich J.D. Oesophageal carcinoma. Lancet. 2013;381:400–412. - PubMed
    1. Engel L.S., Chow W.H., Vaughan T.L., Gammon M.D., Risch H.A., Stanford J.L., Schoenberg J.B., Mayne S.T., Dubrow R., Rotterdam H. Population attributable risks of esophageal and gastric cancers. J. Natl. Cancer Inst. 2003;95:1404–1413. - PubMed
    1. Jia P., Pao W., Zhao Z. Patterns and processes of somatic mutations in nine major cancers. BMC Med. Genomics. 2014;7:11. - PMC - PubMed
    1. Pleasance E.D., Cheetham R.K., Stephens P.J., McBride D.J., Humphray S.J., Greenman C.D., Varela I., Lin M.L., Ordóñez G.R., Bignell G.R. A comprehensive catalogue of somatic mutations from a human cancer genome. Nature. 2010;463:191–196. - PMC - PubMed
    1. Pleasance E.D., Stephens P.J., O’Meara S., McBride D.J., Meynert A., Jones D., Lin M.L., Beare D., Lau K.W., Greenman C. A small-cell lung cancer genome with complex signatures of tobacco exposure. Nature. 2010;463:184–190. - PMC - PubMed

Publication types

MeSH terms

Substances