. 2015 Apr 1;29(7):746-59.
doi: 10.1101/gad.256115.114.

Essential roles for the splicing regulator nSR100/SRRM4 during nervous system development

Affiliations

Essential roles for the splicing regulator nSR100/SRRM4 during nervous system development

Mathieu Quesnel-Vallières et al. Genes Dev. .

Abstract

Alternative splicing (AS) generates vast transcriptomic complexity in the vertebrate nervous system. However, the extent to which trans-acting splicing regulators and their target AS regulatory networks contribute to nervous system development is not well understood. To address these questions, we generated mice lacking the vertebrate- and neural-specific Ser/Arg repeat-related protein of 100 kDa (nSR100/SRRM4). Loss of nSR100 impairs development of the central and peripheral nervous systems in part by disrupting neurite outgrowth, cortical layering in the forebrain, and axon guidance in the corpus callosum. Accompanying these developmental defects are widespread changes in AS that primarily result in shifts to nonneural patterns for different classes of splicing events. The main component of the altered AS program comprises 3- to 27-nucleotide (nt) neural microexons, an emerging class of highly conserved AS events associated with the regulation of protein interaction networks in developing neurons and neurological disorders. Remarkably, inclusion of a 6-nt, nSR100-activated microexon in Unc13b transcripts is sufficient to rescue a neuritogenesis defect in nSR100 mutant primary neurons. These results thus reveal critical in vivo neurodevelopmental functions of nSR100 and further link these functions to a conserved program of neuronal microexon splicing.

Keywords: SR proteins; alternative splicing; microexons; nervous system development.


Figures

Figure 1.
Figure 1.
Loss of the full-length nSR100 protein in nSR100Δ7–8/Δ7–8 mutant mice. (A, top panel) Map of the conditional nSR100/SRRM4 allele showing the positions of exons, Frt (open triangles) and LoxP (solid triangles) recombination sites, homology arms (dashed boxes), and cutting sites for the AseI restriction enzyme (vertical arrows) and the probe (solid bar) used for Southern blot analysis (see B). (Bottom panel) Map of the knockout allele following crossing of the conditional nSR100lox mouse with a CMV-Cre transgenic line. Cre-LoxP recombination drives the loss of nSR100 exons 7 and 8 and results in a +2 frameshift and the introduction of several premature termination codons downstream from the deletion. The position of primers used for RT–PCR (horizontal arrows; see C) is indicated. Homozygous nSR100lox/lox mice do not display any overt phenotype. (B) Southern blot analysis on tail DNA from wild-type (+/+), conditional (lox), and knockout (Δ7–8) mice. DNA was digested with AseI and hybridized with a probe binding upstream of the 5′ homology arm on the conditional allele in intron 3. Predicted band size is 15.4 kb in wild-type, 16.4 kb in conditional, and 19.4 kb in knockout alleles, respectively. (C) RT–PCR on embryonic day 16.5 (E16.5) whole-brain total RNA using primers amplifying exon 2 to exon 9. No transcript could be detected in homozygous mutants. (D) Immunoblotting on E17.5, whole-brain lysates using an antibody to nSR100. Full-length nSR100 protein is completely lost in homozygous mutants (arrow), but a 25-kDa fragment is expressed from the Δ7–8 allele. (E) E17.5 mutant embryos display normal morphology.
Figure 2.
Figure 2.
Loss of nSR100 impairs neurite outgrowth in motor neurons. (A) Whole-mount staining of E18.5 diaphragms with anti-neurofilament antibody (green) to highlight innervation. Orange dots mark secondary branches in the insets. Bars: left panels, 1000 μm; insets, 500 μm. (B,C) The total distance covered by all secondary axons (B) and the number of secondary branches present on the right ventral primary branch of the phrenic nerve (C) were quantified on three or four individuals for each genotype. The total distance covered by secondary neurites and the number of secondary branches formed are significantly lower in homozygous mutants. (D) The total length covered by primary branches is not affected in homozygous mutants. (E) The average length of individual secondary branches in the mutant does not differ significantly from those of wild-type and heterozygous littermates. Three diaphragms from wild-type and heterozygous embryos and four diaphragms for homozygous mutants were analyzed. One-way ANOVA with Tukey-Kramer post-hoc test. Error bars indicate standard error of the mean.
Figure 3.
Figure 3.
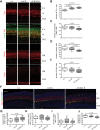
nSR100 mutant mice display aberrant cortical layering and premature neurogenesis. (A) Immunofluorescence microscopy using antibodies to Tbr1, Satb2, NeuN, and Pax6 to label deep layer VI, superficial layers II–V, post-mitotic neurons, and neural progenitors, respectively, on coronal sections of E18.5 embryonic brains. Bars, 50 μm. (I–VI) Cortical layers I–VI, (CM) cortical mantle. Dashed white lines highlight ventral and dorsal cortical boundaries. (BE) The number of Tbr1+ (B), layer II–V Satb2+ (C), NeuN+ (D), and Pax6+ (E) cells was quantified for three to five individuals per genotype and on three sections for each individual. These immunostaining experiments highlight an increase in the number of deep, early-born Tbr1+ neurons and a corresponding decrease in superficial Satb2+ neurons as well as a decrease in the total number of neurons (NeuN+) and neural progenitors (Pax6+). (F) EdU-labeling was performed at E12.5 (green), and brains were harvested at E18.5 and stained with an antibody to Tbr1 (red). Bar, 100 μm. (GI) The number of EdU+ cells was counted in deep layer VI (G), superficial layers II–V (H), and the SVZ (I). (J) The thickness of the SVZ was measured from the preplate to the lateral ventricle and relative to the total thickness of the cortex measured from the surface of layer I to the lateral ventricle. Four to five embryos per genotype and three sections per embryo were analyzed. Whiskers indicate the 10th and 90th percentiles in all box plots. One-way ANOVA with Tukey-Kramer post-hoc test.
Figure 4.
Figure 4.
Midline crossing defects in nSR100 mutant mice. (A) Negative grayscale images of immunofluorescence microscopy using an antibody to neurofilament on coronal sections of the rostral part of the corpus callosum of E18.5 embryos. Dashed lines with arrowheads show either the prototypical tracts of callosal axons in the wild-type (+/+) or the ectopic ventral projections in the homozygous mutant (Δ7–8/Δ7–8). Arrows indicate ectopic bundles in the heterozygous and homozygous mutants. Bar, 100 μm. (B) The thickness of ventrally projecting bundles was measured at three levels on each side of the corpus callosum for three (+/Δ7–8) or four (Δ7–8/Δ7–8) individuals per genotype and on three sections for each individual. Whiskers indicate the 10th and 90th percentiles. One-tailed Mann-Whitney test.
Figure 5.
Figure 5.
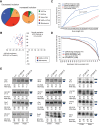
nSR100 regulatory program in the mouse brain. (A) Number of AS events showing significantly decreased (left) or increased (right) inclusion upon nSR100 deletion in mouse brains, plotted by class. (AltEx) Alternative cassette exons. (B) Microexons (blue) and longer cassette exons (red) were plotted based on their PSI difference between nSR100Δ7–8/Δ7–8 and wild-type samples (X-axis) and their ΔPSI between the average of neural versus nonneural tissues (Y-axis) as previously determined (Irimia et al. 2014). (C) Cumulative distribution of exon lengths for different groups of alternative exons, including events that show decreased inclusion in nSR100Δ7–8/Δ7–8compared with the control (nSR100-enhanced; dark blue), all alternative exons with increased neural PSI (neural increased; light blue), all alternative exons with decreased neural PSI (neural decreased; red), and nonneural alternative exons (nonneural; gray). (D) Cumulative distribution plots indicating the position of the first UGC motif within 200 nt upstream of nSR100-regulated microexons (dark blue), longer exons (>27 nt) with increased neural inclusion (light blue), exons with decreased neural inclusion (red), and nonneural (gray) and constitutive (black) exons. The number of exons used in the analysis for each subgroup is indicated in parentheses. (E) RT–PCR validations of nSR100-regulated cassette exons in cortical (left two lanes) and hippocampal (right two lanes) samples. PSI values calculated from semiquantitative RT–PCR or RNA-seq analysis are shown below the gel for each event. Cassette exon included isoforms are represented by yellow boxes flanked by blue constitutive exons. Primers were located in flanking constitutive exons.
Figure 6.
Figure 6.
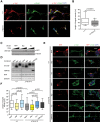
Functional regulation of a neural microexon by nSR100. (A) Representative images of primary hippocampal neurons from wild-type (+/+) and nSR100Δ7–8/Δ7–8 mice cultured for 2 d and then stained with antibodies to Tuj1 (red) and Map2 (green). Bar, 25 μm. (B) The length of the longest neurite was measured for each neuron. Four-hundred-fifty-one cells from wild-type embryos and 425 cells from mutant embryos were analyzed. (C) Immunoblotting with an antibody to red fluorescence protein (RFP) on Neuro2A lysates transfected with increasing amounts of the same constructs that were used for the experiments in DF showing Unc13b-skp-RFP (skp) and Unc13b-inc-RFP (inc) protein expression. (D) RT–PCR showing inclusion levels of the Unc13b microexon as well as RFP, nSR100, and GAPDH expression in transfected nSR100+/+ and nSR100Δ7–8/Δ7–8 cortical neuronal cultures. (E) Representative images of primary cortical neurons from nSR100+/+ and nSR100Δ7–8/Δ7–8 mice transfected with RFP, Unc13b-skp-RFP (skp), Unc13b-inc-RFP (inc), or nSR100-RFP; cultured for 2 d; and then stained with an antibody to Tuj1 (green). nSR100-RFP displays nuclear localization, as expected. Bar, 25 μm. (F) nSR100+/+ primary cortical neurons were transfected with RFP, Unc13b-skp-RFP, or Unc13b-inc-RFP (three left groups), and nSR100Δ7–8/Δ7–8 primary cortical neurons were transfected with the same constructs and nSR100-RFP (four right groups). The longest neurites were measured in RFP-expressing cells. Whiskers indicate the 10th and 90th percentiles. Kruskal-Wallis test with Dunn's multiple comparison tests.

Similar articles

Cited by

References

    1. Akbarian S, Bunney WE Jr, Potkin SG, Wigal SB, Hagman JO, Sandman CA, Jones EG. 1993. Altered distribution of nicotinamide-adenine dinucleotide phosphate-diaphorase cells in frontal lobe of schizophrenics implies disturbances of cortical development. Arch Gen Psychiatry 50: 169–177. - PubMed
    1. Barbosa-Morais NL, Irimia M, Pan Q, Xiong HY, Gueroussov S, Lee LJ, Slobodeniuc V, Kutter C, Watt S, Colak R, et al.2012. The evolutionary landscape of alternative splicing in vertebrate species. Science 338: 1587–1593. - PubMed
    1. Boucard AA, Chubykin AA, Comoletti D, Taylor P, Sudhof TC. 2005. A splice code for trans-synaptic cell adhesion mediated by binding of neuroligin 1 to α- and β-neurexins. Neuron 48: 229–236. - PubMed
    1. Braunschweig U, Gueroussov S, Plocik AM, Graveley BR, Blencowe BJ. 2013. Dynamic integration of splicing within gene regulatory pathways. Cell 152: 1252–1269. - PMC - PubMed
    1. Braunschweig U, Barbosa-Morais NL, Pan Q, Nachman EN, Alipanahi B, Gonatopoulos-Pournatzis T, Frey B, Irimia M, Blencowe BJ. 2014. Widespread intron retention in mammals functionally tunes transcriptomes. Genome Res 24: 1774–1786. - PMC - PubMed

Publication types

Substances