. 2015 Mar 12:9:1511-54.
doi: 10.2147/DDDT.S75976. eCollection 2015.

Induction of apoptosis and autophagy via sirtuin1- and PI3K/Akt/mTOR-mediated pathways by plumbagin in human prostate cancer cells

Affiliations

Induction of apoptosis and autophagy via sirtuin1- and PI3K/Akt/mTOR-mediated pathways by plumbagin in human prostate cancer cells

Zhi-Wei Zhou et al. Drug Des Devel Ther. .

Retraction in

Abstract

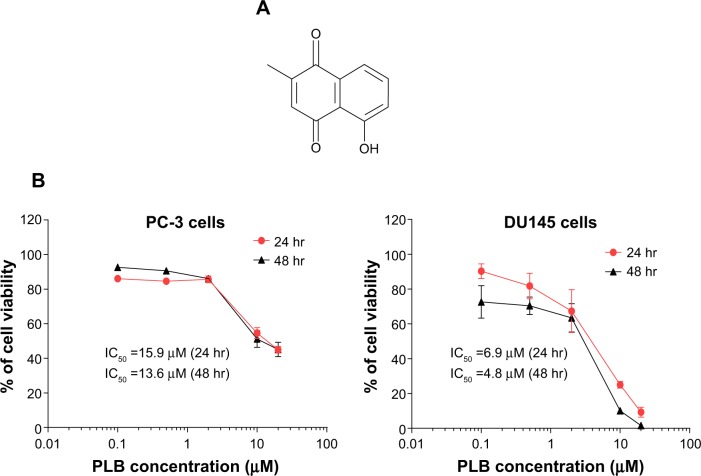
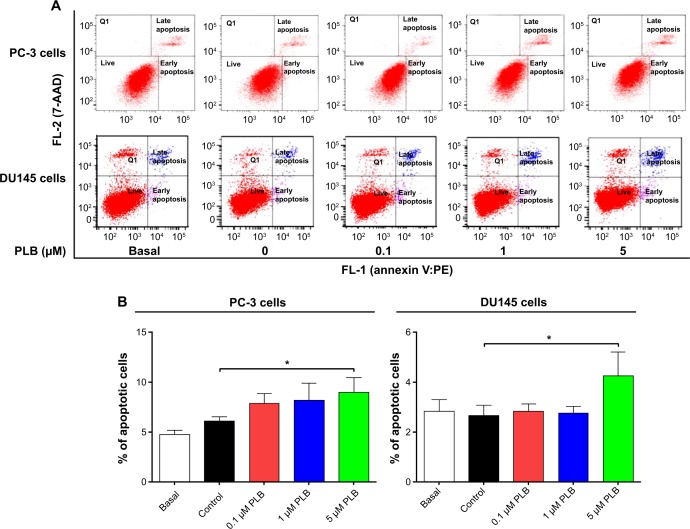
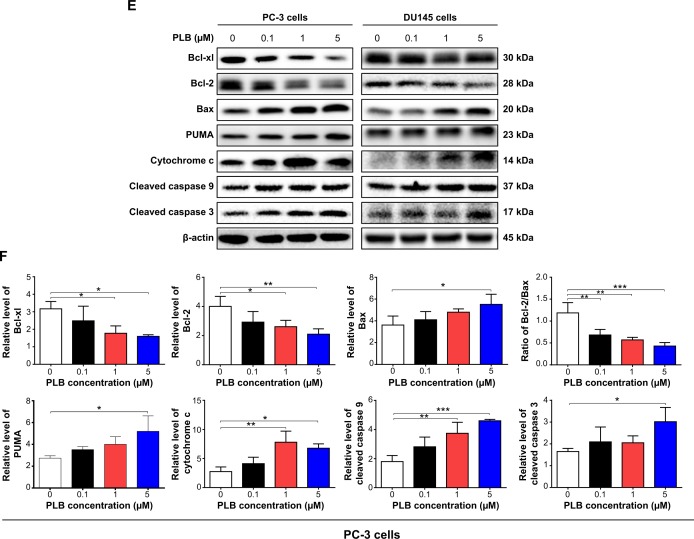
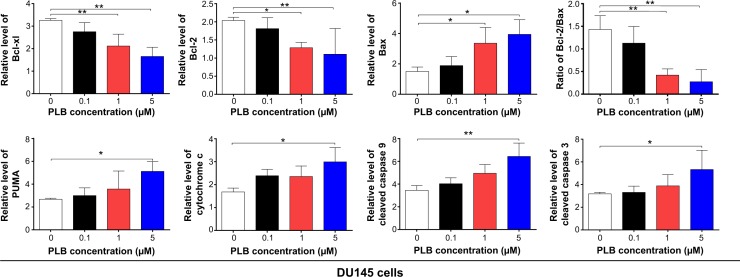
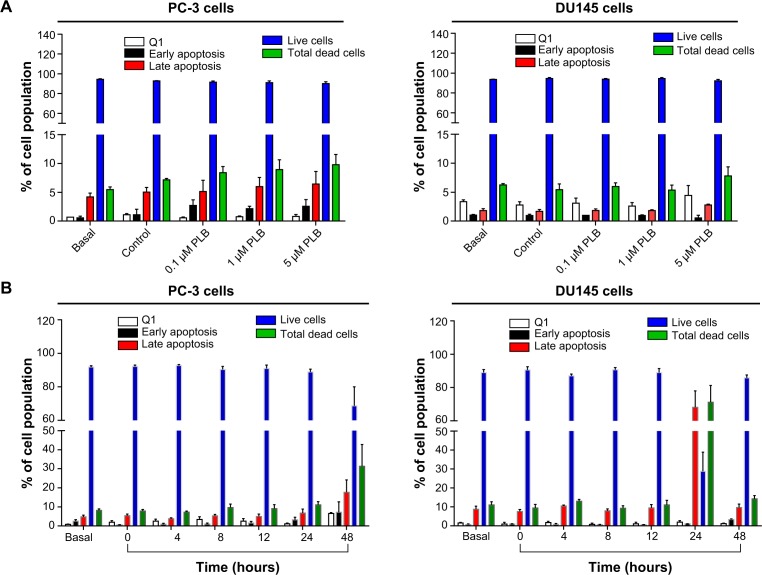
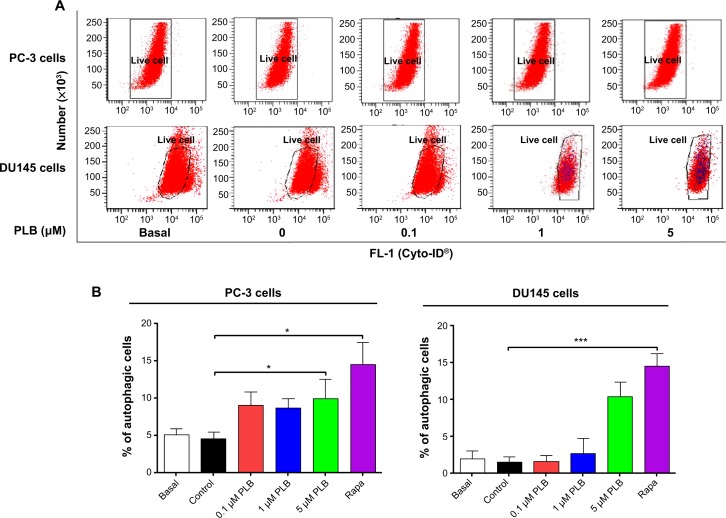
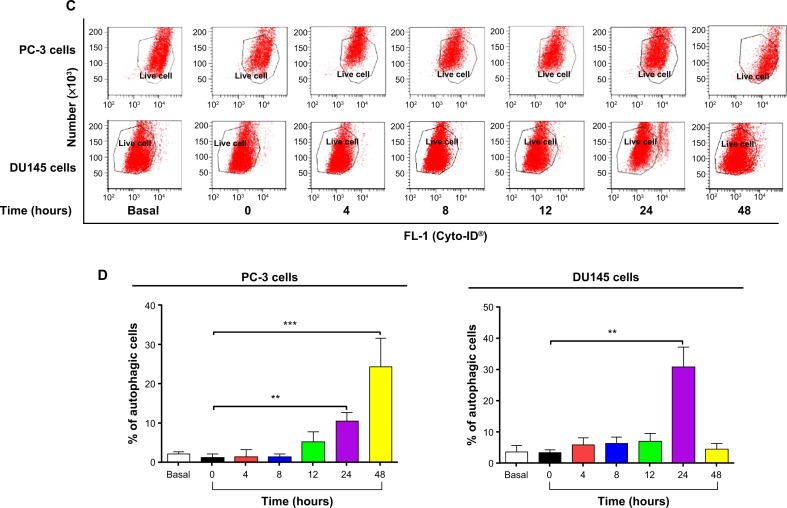
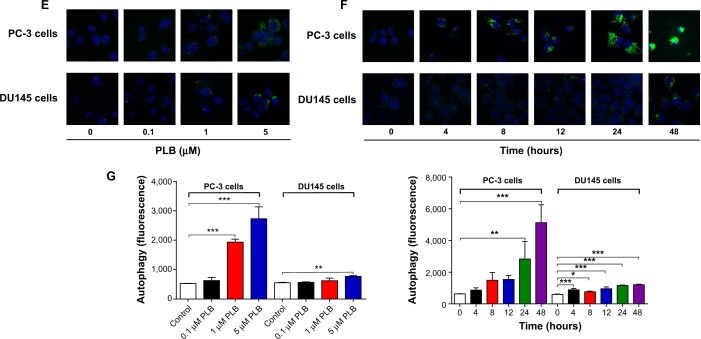
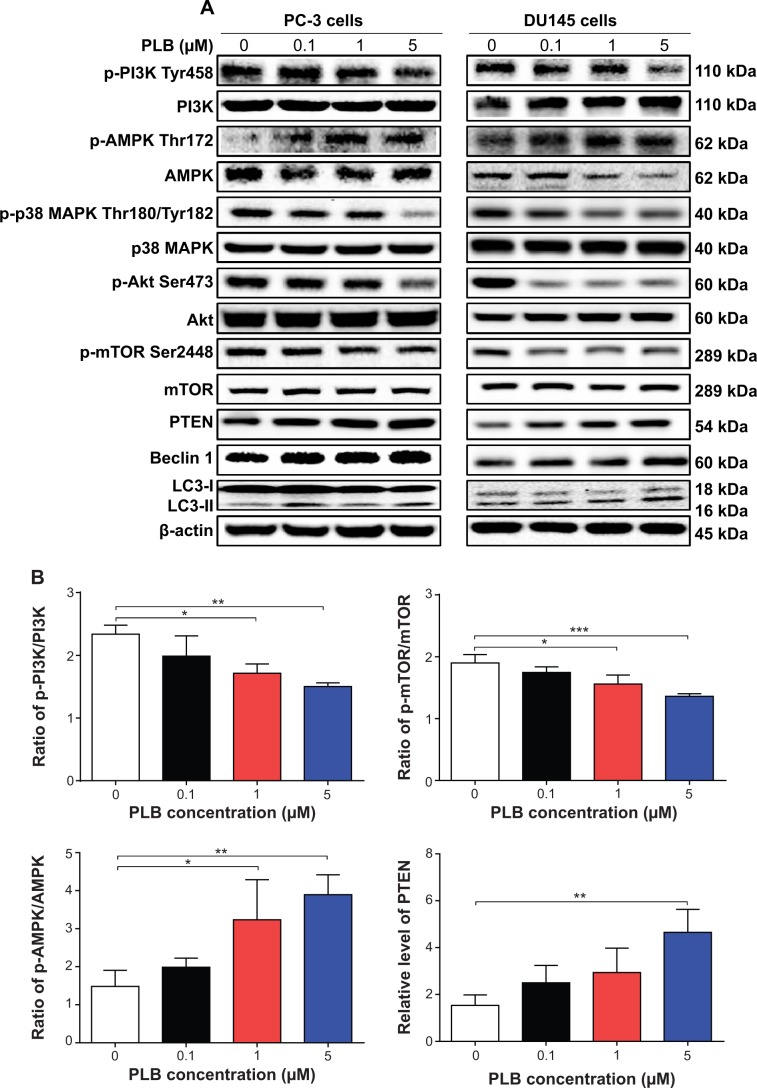
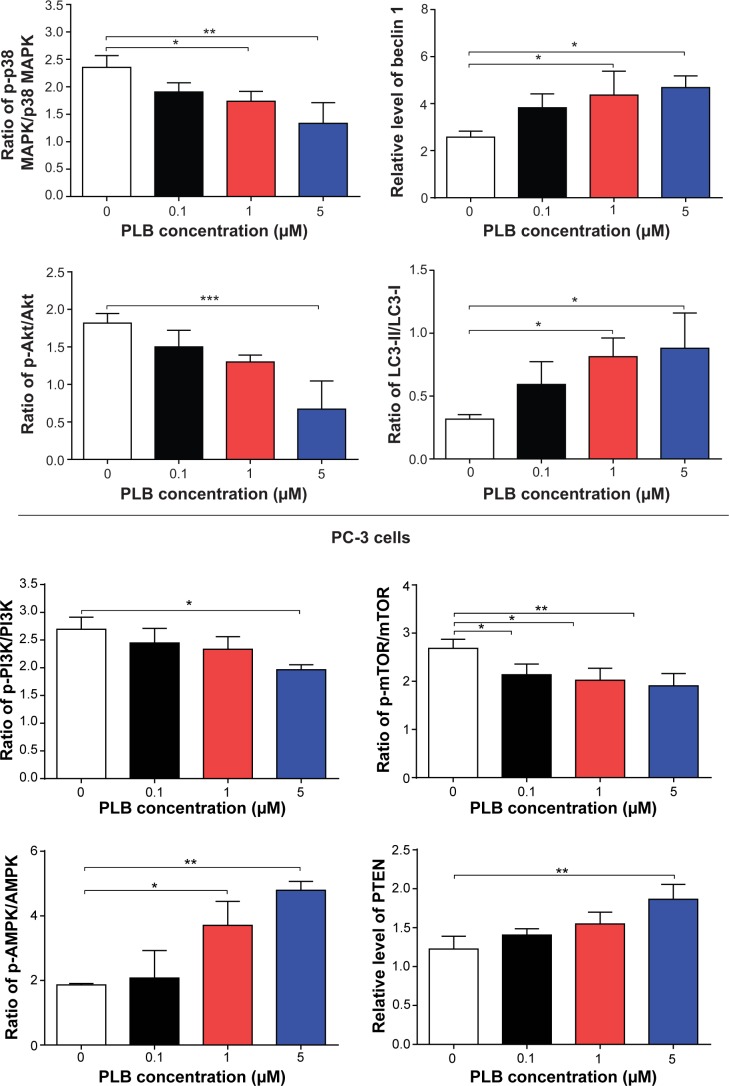
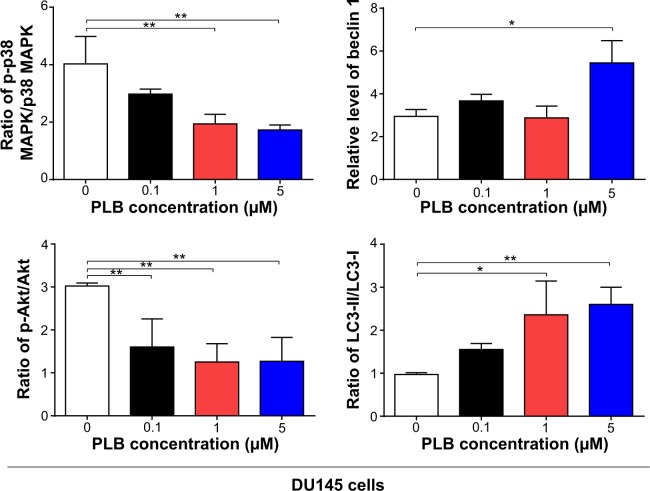
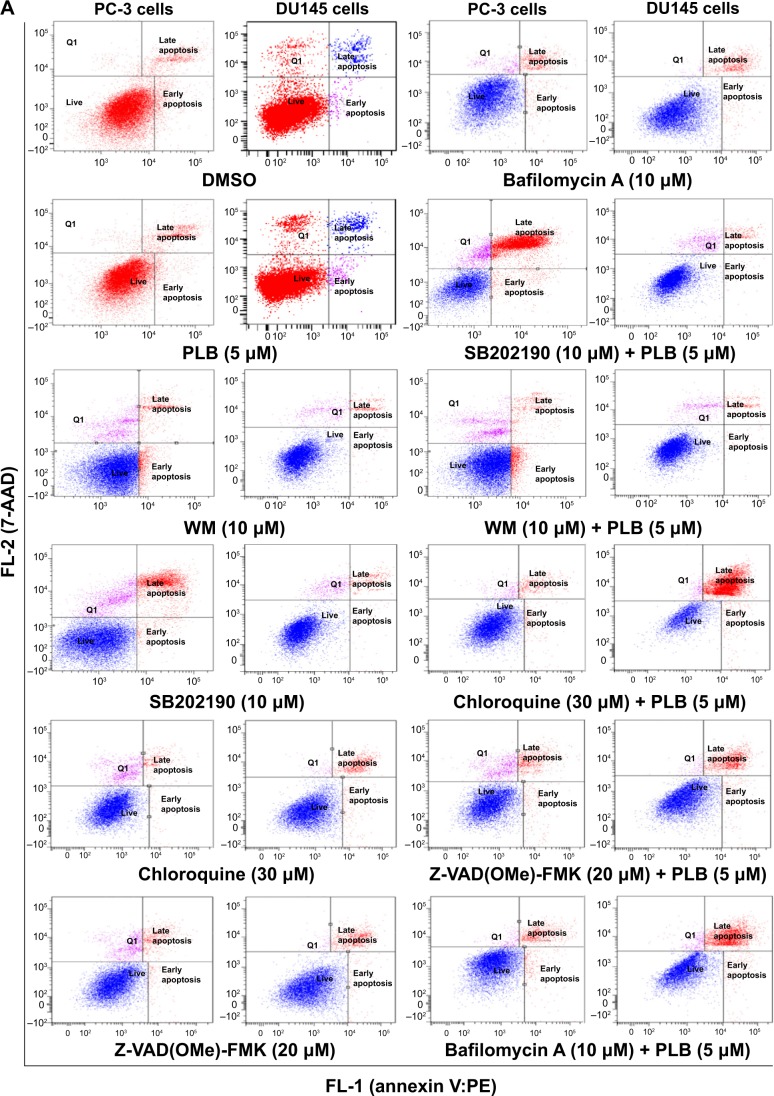
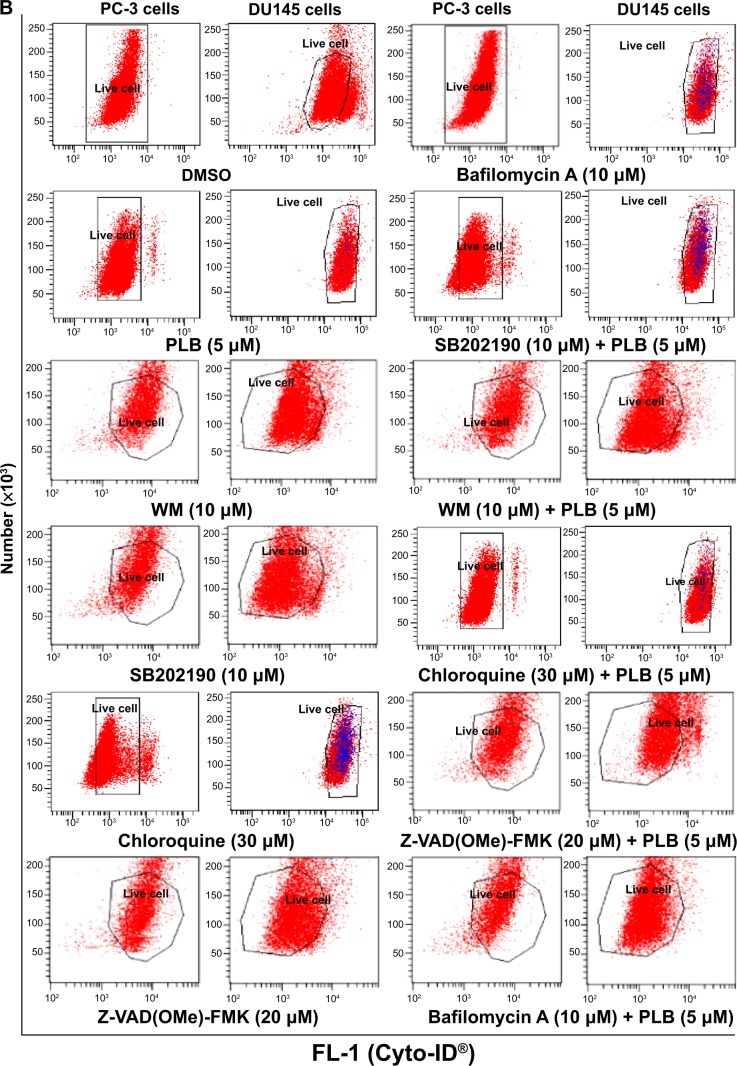
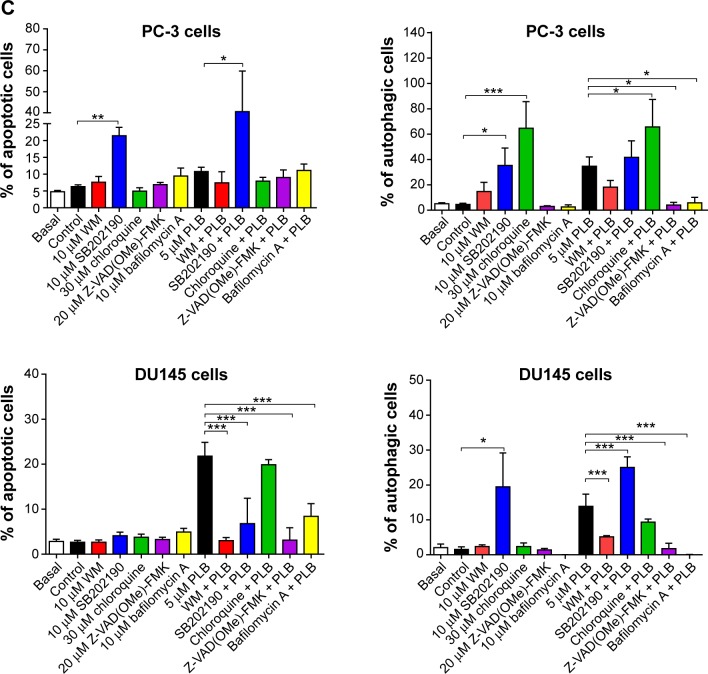
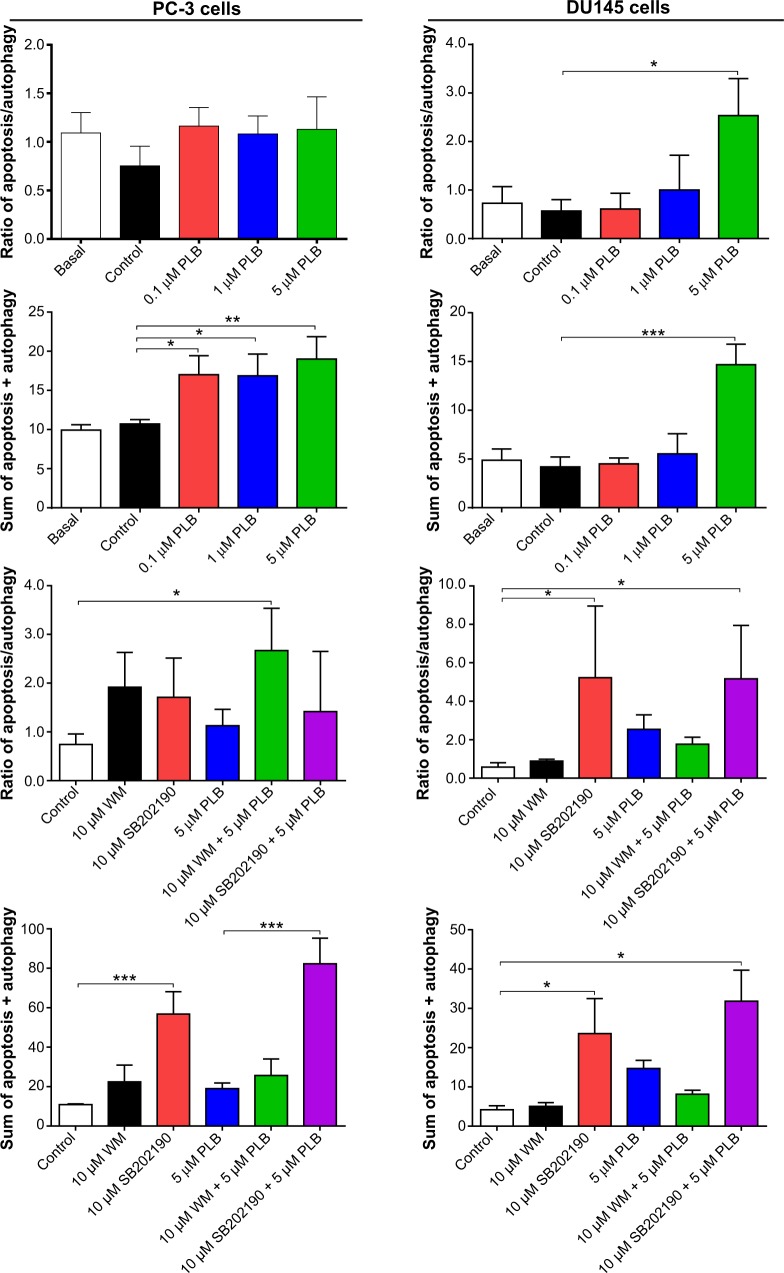
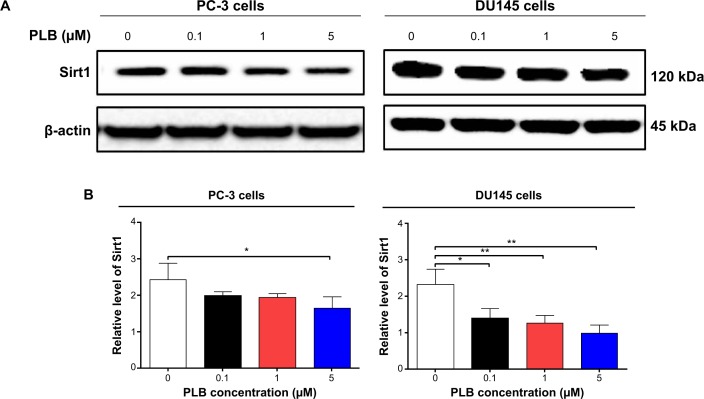
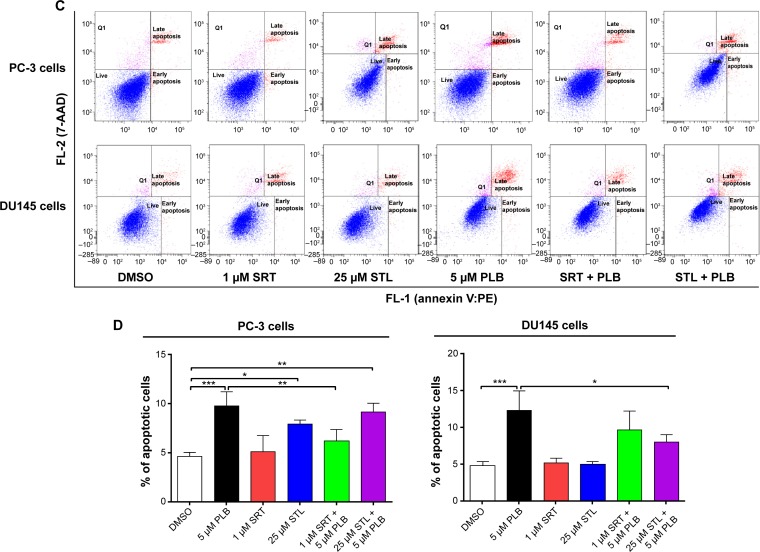
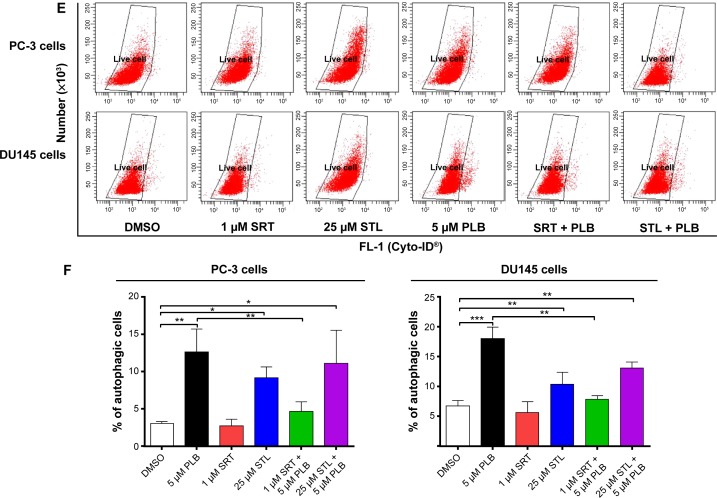
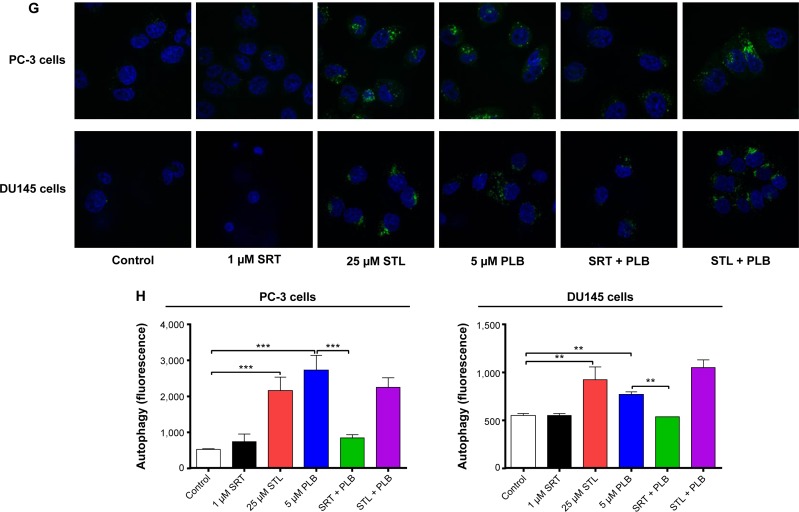
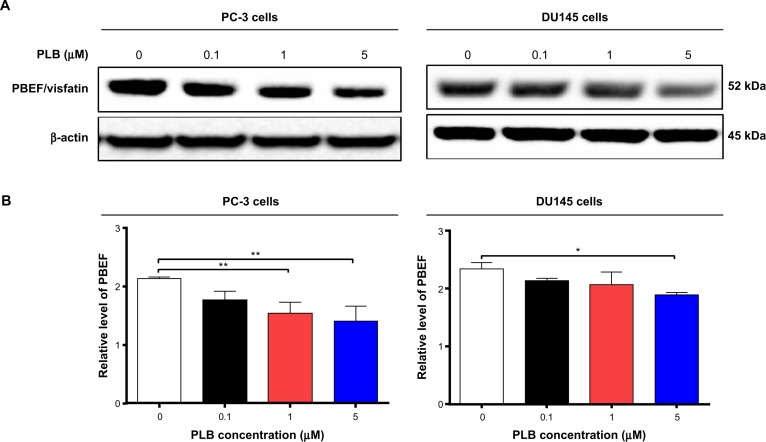
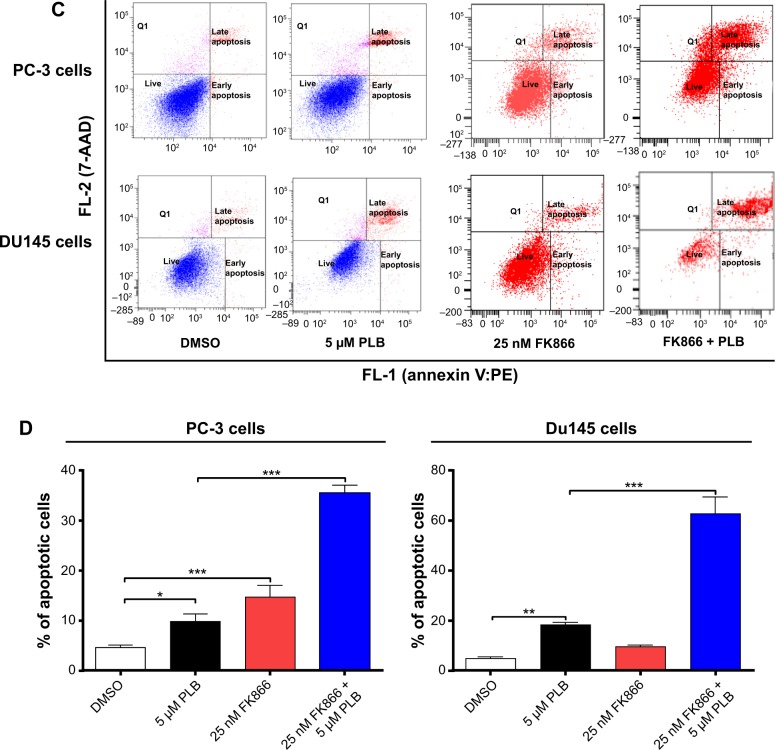
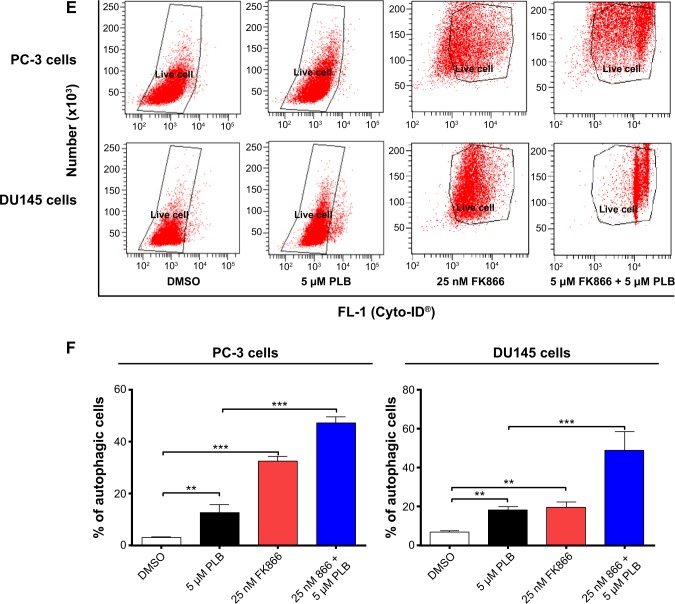
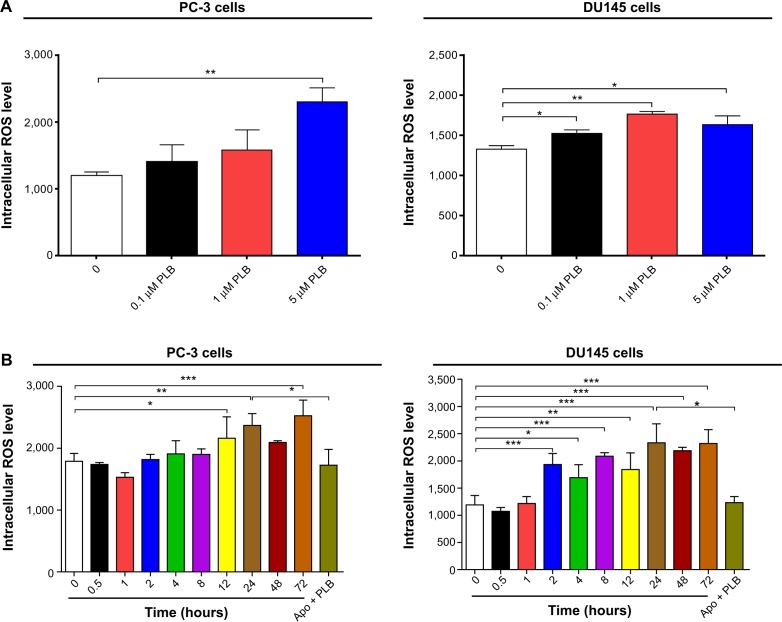
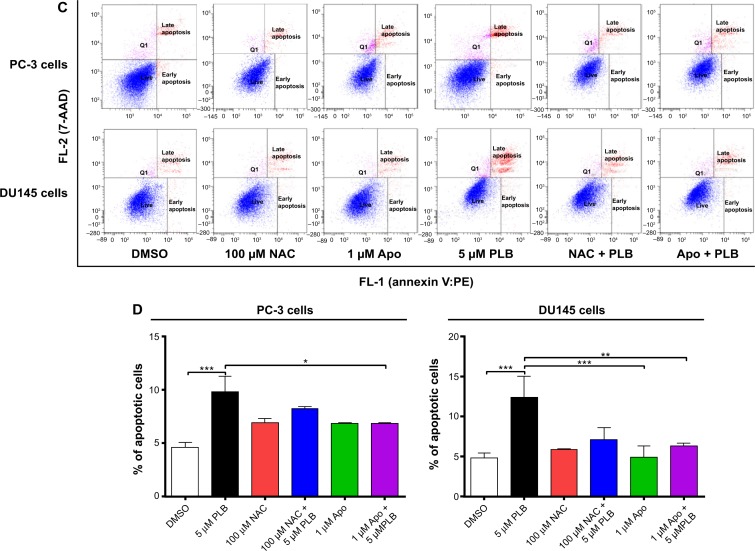
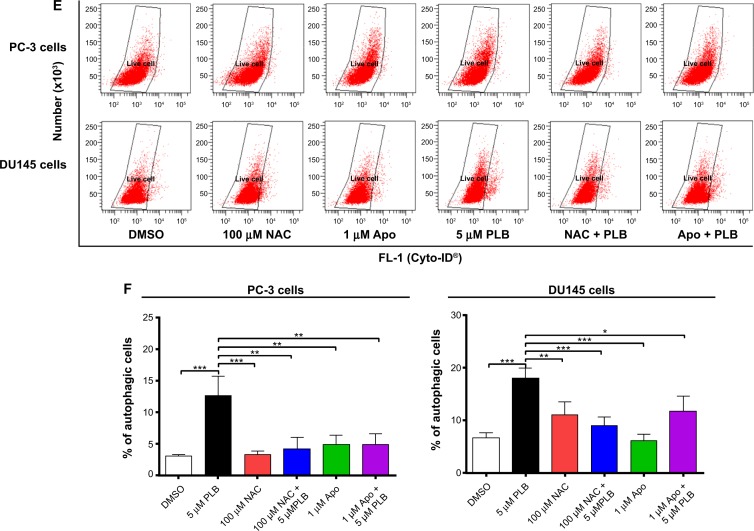
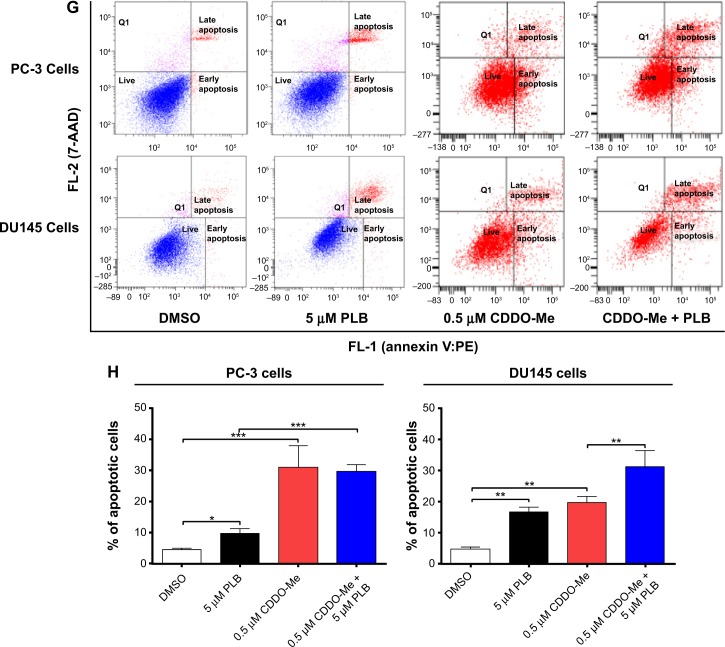
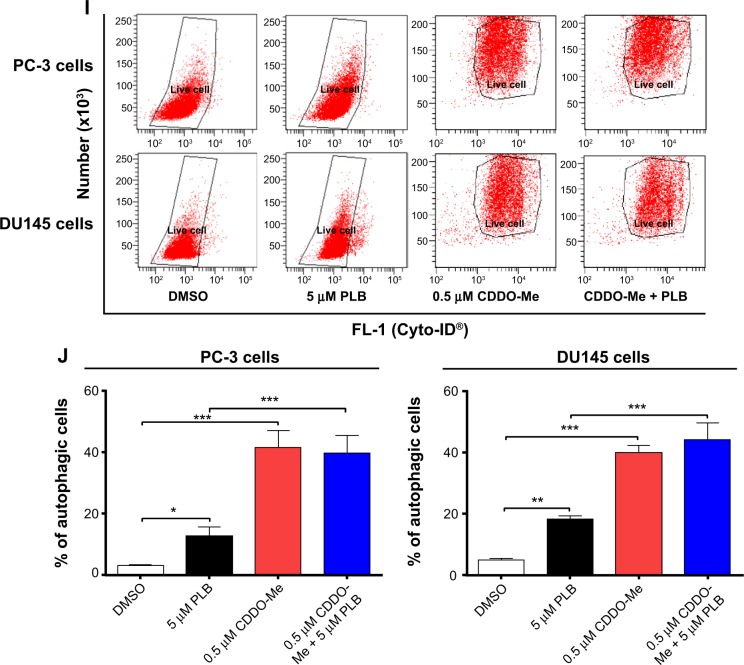
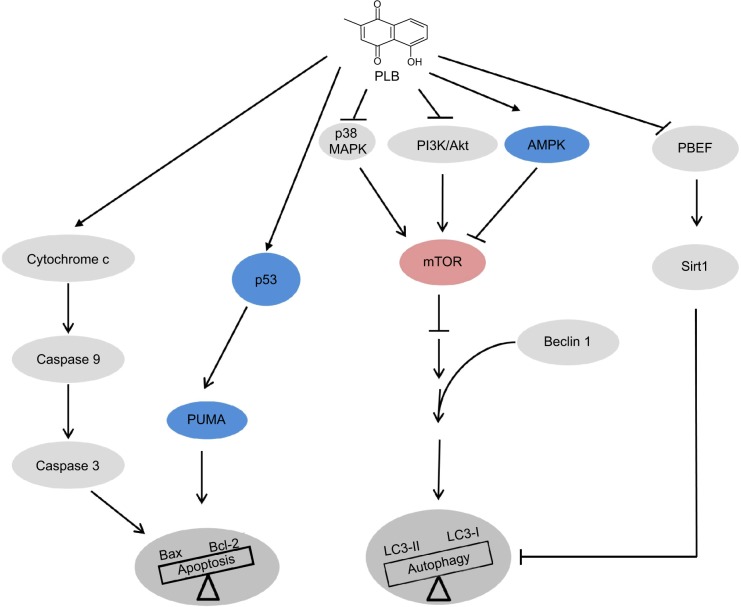
Plumbagin (PLB) has been shown to have anticancer activities in animal models, but the role of PLB in prostate cancer treatment is unclear. This study aimed to investigate the effects of PLB on apoptosis and autophagy and the underlying mechanisms in human prostate cancer cell lines PC-3 and DU145. Our study has shown that PLB had potent pro-apoptotic and pro-autophagic effects on PC-3 and DU145 cells. PLB induced mitochondria-mediated apoptosis and autophagy in concentration- and time-dependent manners in both PC-3 and DU145 cells. PLB induced inhibition of phosphatidylinositol 3-kinase (PI3K)/protein kinase B (Akt)/mammalian target of rapamycin (mTOR) and p38 mitogen-activated protein kinase (MAPK) pathways and activation of 5'-AMP-dependent kinase (AMPK) as indicated by their altered phosphorylation, contributing to the pro-autophagic activity of PLB. Modulation of autophagy altered basal and PLB-induced apoptosis in both cell lines. Furthermore, PLB downregulated sirtuin 1 (Sirt1), and inhibition of Sirt1 enhanced autophagy, whereas the induction of Sirt1 abolished PLB-induced autophagy in PC-3 and DU145 cells. In addition, PLB downregulated pre-B cell colony-enhancing factor/visfatin, and the inhibition of pre-B cell colony-enhancing factor/visfatin significantly enhanced basal and PLB-induced apoptosis and autophagy in both cell lines. Moreover, reduction of intracellular reactive oxygen species (ROS) level attenuated the apoptosis- and autophagy-inducing effects of PLB on both PC-3 and DU145 cells. These findings indicate that PLB promotes apoptosis and autophagy in prostate cancer cells via Sirt1- and PI3K/Akt/mTOR-mediated pathways with contribution from AMPK-, p38 MAPK-, visfatin-, and ROS-associated pathways.

Keywords: AMPK; DU145; PC-3; ROS; visfatin.


Figures

Figure 1
Figure 1
The chemical structure and cytotoxicity of PLB toward PC-3 and DU145 cells. Notes: (A) The chemical structure of PLB. (B) PC-3 and DU145 cells treated with PLB at concentration ranging from 0.1 μM to 20 μM for 24 hr and 48 hr, respectively. The cell viability was determined by the MTT assay. Abbreviations: hr, hour; IC50, half maximal inhibitory concentration; MTT, thiazolyl blue tetrazolium bromide; PLB, plumbagin.
Figure 2
Figure 2
PLB-induced apoptotic cell death and altered expression levels of pro- and anti-apoptotic proteins in PC-3 and DU145 cells. Notes: Flow cytometric plots (A) and percentage bar graphs (B) of specific cell populations (live, early apoptosis, and late apoptosis) in PC-3 and DU145 cells treated with PLB at 0.1 μM, 1 μM, and 5 μM for 24 hours. Flow cytometric plots (C) and percentage bar graphs (D) of specific cell populations (live, early apoptosis, and late apoptosis) in PC-3 and DU145 cells treated with 5 μM PLB over 48 hours. (E) Effect of PLB treatment on the expression levels of Bcl-xl, Bax, Bcl-2, PUMA, cytochrome c, cleaved caspase 3, and cleaved caspase 9 in PC-3 and DU145 cells determined using Western blotting assays. (F) Bar graphs showing the relative levels of Bcl-xl, Bax, Bcl-2, PUMA, cytochrome c, cleaved caspase 3, cleaved caspase 9, and the ratio of Bcl-2/Bax in PC-3 and DU145 cells. β-actin was used as the internal control. Data are the mean ± SD of three independent experiments. *P<0.05; **P<0.01; and ***P<0.001 by one-way ANOVA. Abbreviations: 7-AAD, 7-aminoactinomycin D; ANOVA, analysis of variance; Bax, Bcl-2-associated X protein; Bcl-xl, B-cell lymphoma-extra-large; PLB, plumbagin; PUMA, p53 upregulated modulator of apoptosis; SD, standard deviation; PE, phycoerythrin.
Figure 2
Figure 2
PLB-induced apoptotic cell death and altered expression levels of pro- and anti-apoptotic proteins in PC-3 and DU145 cells. Notes: Flow cytometric plots (A) and percentage bar graphs (B) of specific cell populations (live, early apoptosis, and late apoptosis) in PC-3 and DU145 cells treated with PLB at 0.1 μM, 1 μM, and 5 μM for 24 hours. Flow cytometric plots (C) and percentage bar graphs (D) of specific cell populations (live, early apoptosis, and late apoptosis) in PC-3 and DU145 cells treated with 5 μM PLB over 48 hours. (E) Effect of PLB treatment on the expression levels of Bcl-xl, Bax, Bcl-2, PUMA, cytochrome c, cleaved caspase 3, and cleaved caspase 9 in PC-3 and DU145 cells determined using Western blotting assays. (F) Bar graphs showing the relative levels of Bcl-xl, Bax, Bcl-2, PUMA, cytochrome c, cleaved caspase 3, cleaved caspase 9, and the ratio of Bcl-2/Bax in PC-3 and DU145 cells. β-actin was used as the internal control. Data are the mean ± SD of three independent experiments. *P<0.05; **P<0.01; and ***P<0.001 by one-way ANOVA. Abbreviations: 7-AAD, 7-aminoactinomycin D; ANOVA, analysis of variance; Bax, Bcl-2-associated X protein; Bcl-xl, B-cell lymphoma-extra-large; PLB, plumbagin; PUMA, p53 upregulated modulator of apoptosis; SD, standard deviation; PE, phycoerythrin.
Figure 3
Figure 3
Effects of PLB treatment on the apoptosis of PC-3 and DU145 cells. Notes: (A) Effect of PLB concentration on the apoptosis of PC-3 and DU145 cells treated with PLB at 0.1 μM, 1 μM, and 5 μM for 24 hours. (B) Effect of PLB treatment time on the apoptosis of PC-3 and DU145 cells treated with 5 μM over 48 hours. Cells were double stained with annexin V:PE and 7-AAD and subjected to flow cytometric analysis that collected 10,000 events. Data are the mean ± SD of three independent experiments. Abbreviations: ANOVA, analysis of variance; PLB, plumbagin; Q1, necrotic cells; SD, standard deviation.
Figure 4
Figure 4
PLB-induced autophagic cell death in PC-3 and DU145 cells. Notes: Flow cytometric plots (A) and bar graphs (B) showing the percentage of autophagic PC-3 and DU145 cells treated with PLB at 0.1 μM, 1 μM, and 5 μM for 24 hours. Flow cytometric plots (C) and bar graphs (D) showing the percentage of autophagic cells in PC-3 and DU145 cells treated with PLB at 5 μM over 48 hours. (E) Confocal microscopic images showing autophagy in PC-3 and DU145 cells treated with PLB at 0.1 μM, 1 μM, and 5 μM for 24 hours (stained in green). The level of autophagy was evaluated using the autophagic vacuole-specific green fluorescent dye, Cyo-ID®. (F) Confocal microscopic images showing autophagy in PC-3 and DU145 cells treated with PLB at 5 μM over 48 hours (stained in green). (G) Bar graphs showing the percentage of autophagic PC-3 and DU145 cells treated with PLB at 0.1 μM, 1 μM, and 5 μM for 24 hours or PLB at 5 μM for 48 hours. Data represent the mean ± SD of three independent experiments. *P<0.05; **P<0.01; and ***P<0.001 by one-way ANOVA. Abbreviations: ANOVA, analysis of variance; PLB, plumbagin; SD, standard deviation.
Figure 4
Figure 4
PLB-induced autophagic cell death in PC-3 and DU145 cells. Notes: Flow cytometric plots (A) and bar graphs (B) showing the percentage of autophagic PC-3 and DU145 cells treated with PLB at 0.1 μM, 1 μM, and 5 μM for 24 hours. Flow cytometric plots (C) and bar graphs (D) showing the percentage of autophagic cells in PC-3 and DU145 cells treated with PLB at 5 μM over 48 hours. (E) Confocal microscopic images showing autophagy in PC-3 and DU145 cells treated with PLB at 0.1 μM, 1 μM, and 5 μM for 24 hours (stained in green). The level of autophagy was evaluated using the autophagic vacuole-specific green fluorescent dye, Cyo-ID®. (F) Confocal microscopic images showing autophagy in PC-3 and DU145 cells treated with PLB at 5 μM over 48 hours (stained in green). (G) Bar graphs showing the percentage of autophagic PC-3 and DU145 cells treated with PLB at 0.1 μM, 1 μM, and 5 μM for 24 hours or PLB at 5 μM for 48 hours. Data represent the mean ± SD of three independent experiments. *P<0.05; **P<0.01; and ***P<0.001 by one-way ANOVA. Abbreviations: ANOVA, analysis of variance; PLB, plumbagin; SD, standard deviation.
Figure 5
Figure 5
Effect of PLB on the expression level of molecule targets in autophagy signaling pathway. Notes: The phosphorylation levels of PI3K, AMPK, p38 MAPK, and Akt, and the total levels of mTOR, PTEN, beclin 1, LC3-I, and LC3-II in PC-3 and DU145 cells were determined by Western blotting assay. β-actin was used as the internal control. (A) Representative blots showing the phosphorylation levels of PI3K, AMPK, p38 MAPK, and Akt, and the total levels of mTOR, PTEN, beclin 1, LC3-I, and LC3-II in PC-3 and DU145 cells treated with PLB at 0.1 μM, 1 μM, and 5 μM for 24 hours. (B) Bar graphs showing the phosphorylation levels of PI3K, AMPK, p38 MAPK, and Akt, and the total levels of mTOR, PTEN, beclin 1, LC3-I, and LC3-II in PC-3 and DU145 cells. Data represent the mean ± SD of three independent experiments. *P<0.05; **P<0.01; and ***P<0.001 by one-way ANOVA. Abbreviations: AMPK, 5′-AMP-dependent kinase; ANOVA, analysis of variance; hr, hour; LC3, microtubule-associated protein 1A/1B-light chain 3; mTOR, mammalian target of rapamycin; p38 MAPK, p38 mitogen-activated protein kinase; PI3K, phosphatidylinositide 3-kinase; PLB, plumbagin; PTEN, phosphatase and tensin homolog; SD, standard deviation.
Figure 5
Figure 5
Effect of PLB on the expression level of molecule targets in autophagy signaling pathway. Notes: The phosphorylation levels of PI3K, AMPK, p38 MAPK, and Akt, and the total levels of mTOR, PTEN, beclin 1, LC3-I, and LC3-II in PC-3 and DU145 cells were determined by Western blotting assay. β-actin was used as the internal control. (A) Representative blots showing the phosphorylation levels of PI3K, AMPK, p38 MAPK, and Akt, and the total levels of mTOR, PTEN, beclin 1, LC3-I, and LC3-II in PC-3 and DU145 cells treated with PLB at 0.1 μM, 1 μM, and 5 μM for 24 hours. (B) Bar graphs showing the phosphorylation levels of PI3K, AMPK, p38 MAPK, and Akt, and the total levels of mTOR, PTEN, beclin 1, LC3-I, and LC3-II in PC-3 and DU145 cells. Data represent the mean ± SD of three independent experiments. *P<0.05; **P<0.01; and ***P<0.001 by one-way ANOVA. Abbreviations: AMPK, 5′-AMP-dependent kinase; ANOVA, analysis of variance; hr, hour; LC3, microtubule-associated protein 1A/1B-light chain 3; mTOR, mammalian target of rapamycin; p38 MAPK, p38 mitogen-activated protein kinase; PI3K, phosphatidylinositide 3-kinase; PLB, plumbagin; PTEN, phosphatase and tensin homolog; SD, standard deviation.
Figure 6
Figure 6
Effect of a series of inducers and inhibitors on the apoptosis and autophagy induced by PLB in PC-3 and DU145 cells. Notes: (A) Plots from flow cytometry showing the effects of various compounds on basal and PLB-induced apoptosis in PC-3 and DU145 cells. (B) Plots from flow cytometry showing the effects of the compounds on basal and PLB-induced autophagy in PC-3 and DU145 cells. (C) Bar graphs showing the effects of various compounds on the apoptosis and autophagy in PC-3 and DU145 cells. The cells were pretreated with each of the compounds for 1 hour, and PLB was added and incubated for a further 24 hours. To detect cellular apoptosis, annexin V:PE and 7-AAD were used for double staining after the cells were treated with PLB. The autophagy was detected using the Cyto-ID® green fluorescent dye to stain autophagy-associated vacuoles. Data are the mean ± SD of three independent experiments. *P<0.05; **P<0.01; ***P<0.001 by one-way ANOVA. Abbreviations: ANOVA, analysis of variance; DMSO, dimethylsulfoxide; PLB, plumbagin; SD, standard deviation; WM, wortmannin; 7-AAD, 7-aminoactinomycin D; PE, phycoerythrin.
Figure 6
Figure 6
Effect of a series of inducers and inhibitors on the apoptosis and autophagy induced by PLB in PC-3 and DU145 cells. Notes: (A) Plots from flow cytometry showing the effects of various compounds on basal and PLB-induced apoptosis in PC-3 and DU145 cells. (B) Plots from flow cytometry showing the effects of the compounds on basal and PLB-induced autophagy in PC-3 and DU145 cells. (C) Bar graphs showing the effects of various compounds on the apoptosis and autophagy in PC-3 and DU145 cells. The cells were pretreated with each of the compounds for 1 hour, and PLB was added and incubated for a further 24 hours. To detect cellular apoptosis, annexin V:PE and 7-AAD were used for double staining after the cells were treated with PLB. The autophagy was detected using the Cyto-ID® green fluorescent dye to stain autophagy-associated vacuoles. Data are the mean ± SD of three independent experiments. *P<0.05; **P<0.01; ***P<0.001 by one-way ANOVA. Abbreviations: ANOVA, analysis of variance; DMSO, dimethylsulfoxide; PLB, plumbagin; SD, standard deviation; WM, wortmannin; 7-AAD, 7-aminoactinomycin D; PE, phycoerythrin.
Figure 7
Figure 7
Crosstalk between apoptosis and autophagy in PC-3 and DU145 cells. Notes: Cells were treated with PLB or in combination with 10 μM SB202190 or 10 μM WM for 24 hours. Apoptosis and autophagy were determined using a flow cytometer. The ratio of apoptosis over autophagy and sum of apoptosis plus autophagy were calculated. Data are the mean ± SD of three independent experiments. *P<0.05; **P<0.01; and ***P<0.001 by one-way ANOVA. Abbreviations: ANOVA, analysis of variance; PLB, plumbagin; SD, standard deviation; WM, wortmannin.
Figure 8
Figure 8
Sirt1 plays a role in PLB-induced apoptosis and autophagy in PC-3 and DU145 cells. Notes: (A) PLB downregulating Sirt1 in PC-3 and DU145 cells as shown by Western blotting assay. Cells were treated with PLB at 0.1 μM, 1 μM, or 5 μM for 24 hours. (B) The bar graph shows the relative expression level of Sirt1 in PC-3 and DU145 cells. (C) Effects of the Sirt1 inducer SRT (1 μM) and inhibitor STL (25 μM) on PLB-induced apoptosis in PC-3 and DU145 cells. : (D) Bar graphs showing the effects of the Sirt1 inducer SRT (1 μM) and inhibitor STL (25 μM) on PLB-induced apoptosis in PC-3 and DU145 cells. (E) Representative flow cytometric dot plots showing the effects of the Sirt1 inducer SRT (1 μM) and inhibitor STL (25 μM) on PLB-induced autophagy in PC-3 and DU145 cells. (F) Bar graphs showing the effects of the Sirt1 inducer SRT (1 μM) and inhibitor STL(25 μM) on PLB-induced autophagy in PC-3 and DU145 cells. (G) Effects of the Sirt1 inducer SRT (1 μM) and inhibitor STL (25 μM) on PLB-induced autophagy in PC-3 and DU145 cells as shown in confocal microscopic images (G) and bar graphs (H) using the autophagy-associated vacuole-specific fluorescence dye, Cyto-ID®. Data are the mean ± SD of three independent experiments. *P<0.05; **P<0.01; and ***P<0.001 by one-way ANOVA. Abbreviations: ANOVA, analysis of variance; DMSO, dimethylsulfoxide; PLB, plumbagin; STL, sirtinol; SD, standard deviation; WM, wortmannin; 7-AAD, 7-aminoactinomycin D; PE, phycoerythrin.
Figure 8
Figure 8
Sirt1 plays a role in PLB-induced apoptosis and autophagy in PC-3 and DU145 cells. Notes: (A) PLB downregulating Sirt1 in PC-3 and DU145 cells as shown by Western blotting assay. Cells were treated with PLB at 0.1 μM, 1 μM, or 5 μM for 24 hours. (B) The bar graph shows the relative expression level of Sirt1 in PC-3 and DU145 cells. (C) Effects of the Sirt1 inducer SRT (1 μM) and inhibitor STL (25 μM) on PLB-induced apoptosis in PC-3 and DU145 cells. : (D) Bar graphs showing the effects of the Sirt1 inducer SRT (1 μM) and inhibitor STL (25 μM) on PLB-induced apoptosis in PC-3 and DU145 cells. (E) Representative flow cytometric dot plots showing the effects of the Sirt1 inducer SRT (1 μM) and inhibitor STL (25 μM) on PLB-induced autophagy in PC-3 and DU145 cells. (F) Bar graphs showing the effects of the Sirt1 inducer SRT (1 μM) and inhibitor STL(25 μM) on PLB-induced autophagy in PC-3 and DU145 cells. (G) Effects of the Sirt1 inducer SRT (1 μM) and inhibitor STL (25 μM) on PLB-induced autophagy in PC-3 and DU145 cells as shown in confocal microscopic images (G) and bar graphs (H) using the autophagy-associated vacuole-specific fluorescence dye, Cyto-ID®. Data are the mean ± SD of three independent experiments. *P<0.05; **P<0.01; and ***P<0.001 by one-way ANOVA. Abbreviations: ANOVA, analysis of variance; DMSO, dimethylsulfoxide; PLB, plumbagin; STL, sirtinol; SD, standard deviation; WM, wortmannin; 7-AAD, 7-aminoactinomycin D; PE, phycoerythrin.
Figure 9
Figure 9
PBEF/visfatin plays a role in PLB-induced apoptosis and autophagy in PC-3 and DU145 cells. Notes: (A) PLB downregulating PBEF in PC-3 and DU145 cells as shown by Western blotting assay. Cells were treated with PLB at 0.1 μM, 1 μM, or 5 μM for 24 hours. (B) The bar graphs showing the relative expression level of PBEF in PC-3 and DU145 cells. (C and D) Effects of the PBEF inhibitor FK866 on PLB-induced apoptosis in PC-3 and DU145 cells. (E) Effects of the PBEF inhibitor FK866 on PLB-induced autophagy in PC-3 and DU145 cells as shown in flow cytometric histograms. (F) Bar graphs showing the effects of the PBEF inhibitor FK866 on PLB-induced autophagy in PC-3 and DU145 cells. Data are presented as the mean ± SD of three independent experiments. *P<0.05; **P<0.01; and ***P<0.001 by one-way ANOVA. Abbreviations: ANOVA, analysis of variance; DMSO, dimethylsulfoxide; PBEF, pre-B cell colony-enhancing factor; PLB, plumbagin; SD, standard deviation; 7-AAD, 7-aminoactinomycin D; PE, phycoerythrin.
Figure 9
Figure 9
PBEF/visfatin plays a role in PLB-induced apoptosis and autophagy in PC-3 and DU145 cells. Notes: (A) PLB downregulating PBEF in PC-3 and DU145 cells as shown by Western blotting assay. Cells were treated with PLB at 0.1 μM, 1 μM, or 5 μM for 24 hours. (B) The bar graphs showing the relative expression level of PBEF in PC-3 and DU145 cells. (C and D) Effects of the PBEF inhibitor FK866 on PLB-induced apoptosis in PC-3 and DU145 cells. (E) Effects of the PBEF inhibitor FK866 on PLB-induced autophagy in PC-3 and DU145 cells as shown in flow cytometric histograms. (F) Bar graphs showing the effects of the PBEF inhibitor FK866 on PLB-induced autophagy in PC-3 and DU145 cells. Data are presented as the mean ± SD of three independent experiments. *P<0.05; **P<0.01; and ***P<0.001 by one-way ANOVA. Abbreviations: ANOVA, analysis of variance; DMSO, dimethylsulfoxide; PBEF, pre-B cell colony-enhancing factor; PLB, plumbagin; SD, standard deviation; 7-AAD, 7-aminoactinomycin D; PE, phycoerythrin.
Figure 10
Figure 10
ROS plays a role in PLB-induced apoptosis and autophagy in PC-3 and DU145 cells. Notes: (A) PLB stimulating the generation of ROS in PC-3 and DU145 cells. Cells were treated with PLB at 0.1 μM, 1 μM, or 5 μM for 24 hours. The bar graphs showing the intracellular level of ROS in PC-3 and DU145 cells. (B) Bar graphs showing the time course of PLB-induced generation of intracellular ROS in PC-3 and DU145 cells. (C) Effects of Apo and NAC on basal and PLB-induced apoptosis in PC-3 and DU145 cells. (D) Bar graphs showing the effects of Apo and NAC on basal and PLB-induced apoptosis in PC-3 and DU145 cells. (E) Representative flow cytometric dot plots showing the effects of Apo and NAC on basal and PLB-induced autophagy in PC-3 and DU145 cells. (F) Bar graphs showing the effects of Apo and NAC on basal and PLB-induced autophagy in PC-3 and DU145 cells determined by flow cytometry. (G) Representative flow cytometric dot plots showing the effects of CDDO-Me on basal and PLB-induced apoptosis in PC-3 and DU145 cells. (H) Bar graphs showing the effects of CDDO-Me on basal and PBL-induced apoptosis in PC-3 and DU145 cells. (I) Representative flow cytometric dot plots showing the effects of CDDO-Me on basal and PLB-induced autophagy in PC-3 and DU145 cells. (J) Bar graphs showing the effects of CDDO-Me on basal and PLB-induced autophagy in PC-3 and DU145 cells. Data are the mean ± SD of three independent experiments. *P<0.05; **P<0.01; and ***P<0.001 by one-way ANOVA. Abbreviations: ANOVA, analysis of variance; Apo, apocynin; DMSO, dimethylsulfoxide; NAC, N-acetyl-L-cysteine; PLB, plumbagin; ROS, reactive oxygen species; SD, standard deviation; 7-AAD, 7-aminoactinomycin D; PE, phycoerythrin.
Figure 10
Figure 10
ROS plays a role in PLB-induced apoptosis and autophagy in PC-3 and DU145 cells. Notes: (A) PLB stimulating the generation of ROS in PC-3 and DU145 cells. Cells were treated with PLB at 0.1 μM, 1 μM, or 5 μM for 24 hours. The bar graphs showing the intracellular level of ROS in PC-3 and DU145 cells. (B) Bar graphs showing the time course of PLB-induced generation of intracellular ROS in PC-3 and DU145 cells. (C) Effects of Apo and NAC on basal and PLB-induced apoptosis in PC-3 and DU145 cells. (D) Bar graphs showing the effects of Apo and NAC on basal and PLB-induced apoptosis in PC-3 and DU145 cells. (E) Representative flow cytometric dot plots showing the effects of Apo and NAC on basal and PLB-induced autophagy in PC-3 and DU145 cells. (F) Bar graphs showing the effects of Apo and NAC on basal and PLB-induced autophagy in PC-3 and DU145 cells determined by flow cytometry. (G) Representative flow cytometric dot plots showing the effects of CDDO-Me on basal and PLB-induced apoptosis in PC-3 and DU145 cells. (H) Bar graphs showing the effects of CDDO-Me on basal and PBL-induced apoptosis in PC-3 and DU145 cells. (I) Representative flow cytometric dot plots showing the effects of CDDO-Me on basal and PLB-induced autophagy in PC-3 and DU145 cells. (J) Bar graphs showing the effects of CDDO-Me on basal and PLB-induced autophagy in PC-3 and DU145 cells. Data are the mean ± SD of three independent experiments. *P<0.05; **P<0.01; and ***P<0.001 by one-way ANOVA. Abbreviations: ANOVA, analysis of variance; Apo, apocynin; DMSO, dimethylsulfoxide; NAC, N-acetyl-L-cysteine; PLB, plumbagin; ROS, reactive oxygen species; SD, standard deviation; 7-AAD, 7-aminoactinomycin D; PE, phycoerythrin.
Figure 11
Figure 11
Proposed mechanisms of action of PLB in killing prostate cancer cells. Notes: PLB induces apoptosis and autophagy involving p38 MAPK, PI3K/Akt/mTOR, AMPK, PBEF/visfatin, and Sirt1. There is crosstalk among the pathways involving many of these critical signaling proteins. Abbreviations: AMPK, 5′-AMP-dependent kinase; Bax, Bcl-2-associated X protein; LC3, light chain 3; mTOR, mammalian target of rapamycin; p38 MAPK, p38 mitogen-activated protein kinase; PBEF, pre-B cell colony-enhancing factor; PI3K, phosphatidylinositide 3-kinase; PLB, plumbagin; PUMA, p53 upregulated modulator of apoptosis; Sirt1, sirtuin 1.

Similar articles

Cited by

References

    1. Siegel R, Naishadham D, Jemal A. Cancer statistics, 2013. CA Cancer J Clin. 2013;63(1):11–30. - PubMed
    1. Ahmed HU. Prostate cancer: time for active surveillance of intermediate-risk disease? Nat Rev Urol. 2013;10(1):6–8. - PubMed
    1. American Cancer Society . Global Cancer Facts and Figures. Atlanta: American Cancer Society; 2011.
    1. U.S., Cancer Statistics Working Group, United States cancer statistics: 1999–2011 incidence and mortality web-based report. Centers for Disease Control and Prevention and National Cancer Institute; Atlanta, GA: 2014.
    1. Cancer mortality statistics: Cancer mortality for common cancers. London: Cancer Research UK; [Accessed November 6, 2014]. [updated September 15, 2014]. Available from: http://www.cancerresearchuk.org/cancer-info/cancerstats/mortality/cancer....

Publication types

MeSH terms