. 2015 Apr 9;520(7546):186-91.
doi: 10.1038/nature14299. Epub 2015 Apr 1.

In vivo genome editing using Staphylococcus aureus Cas9

Affiliations

In vivo genome editing using Staphylococcus aureus Cas9

F Ann Ran et al. Nature. .

Abstract

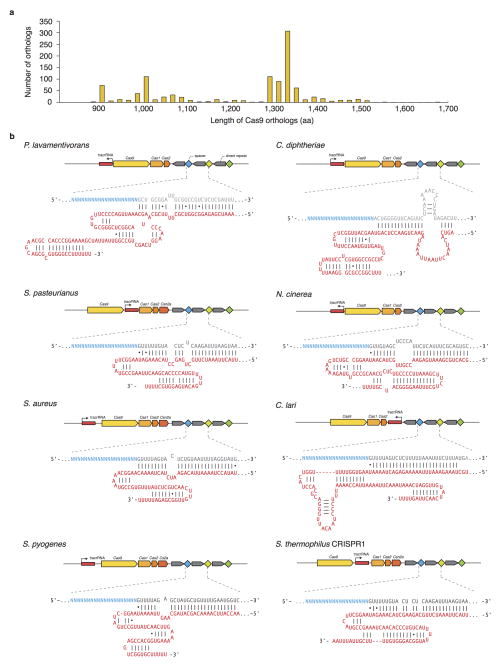
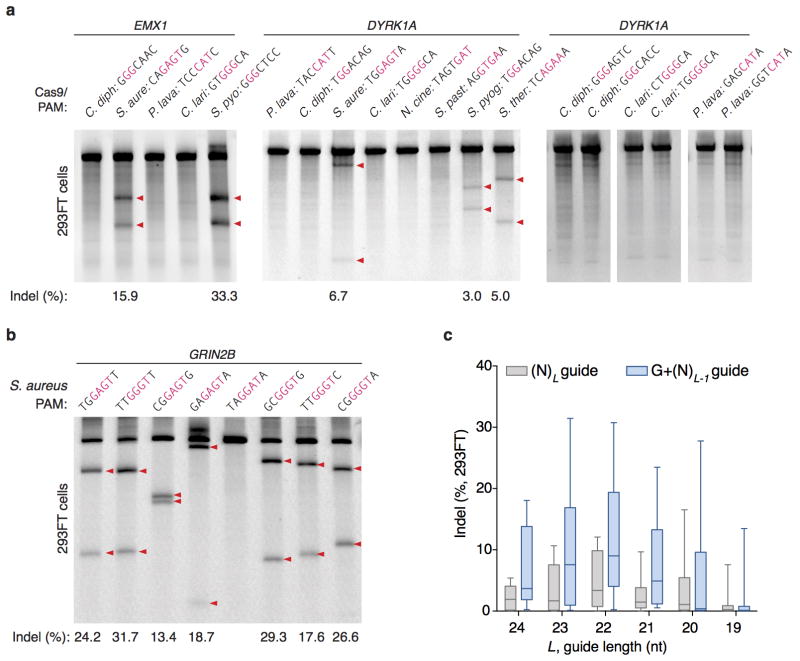
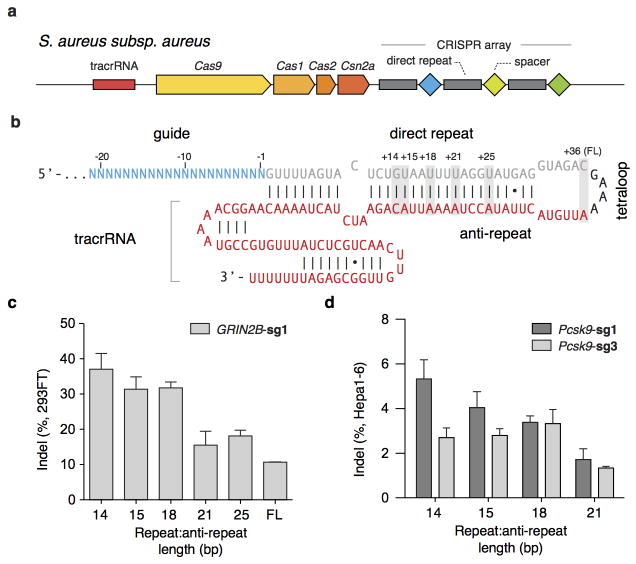
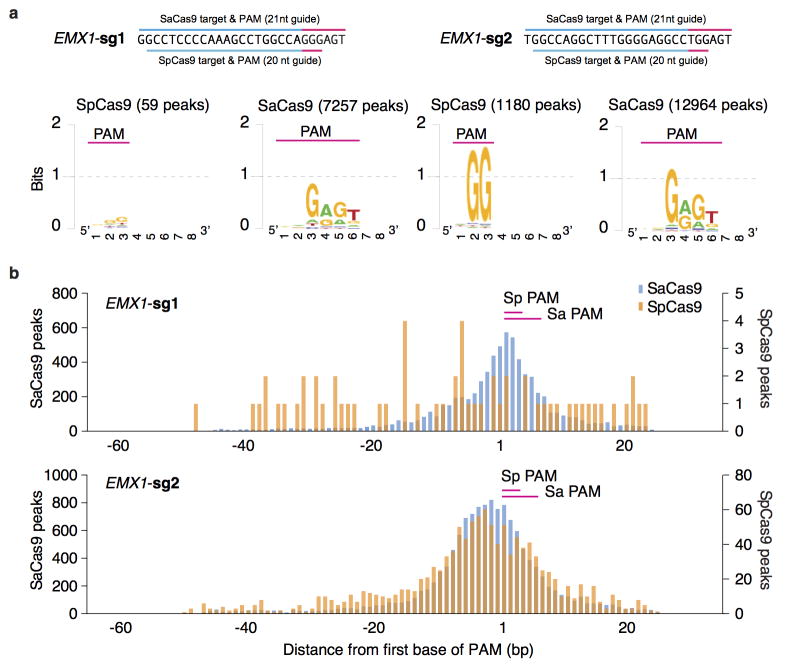
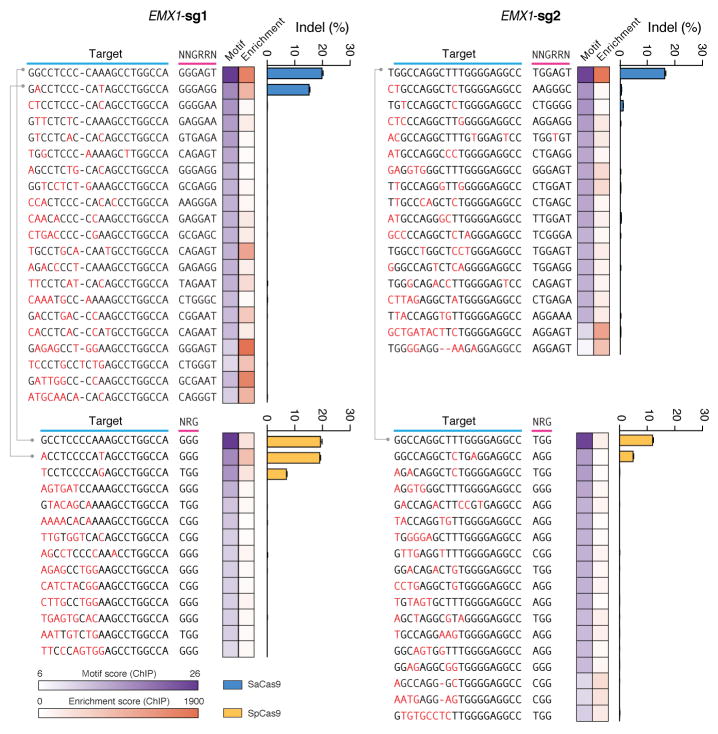
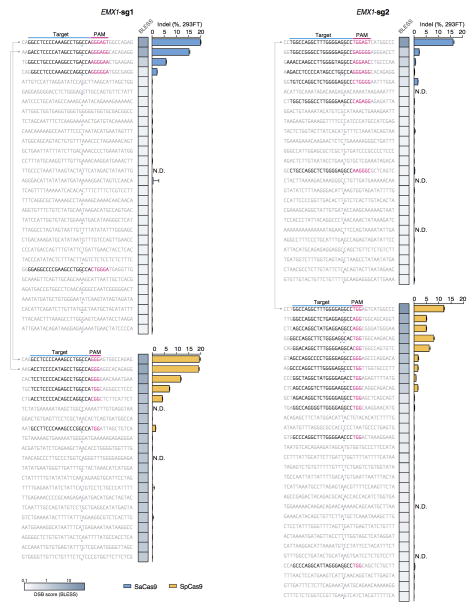
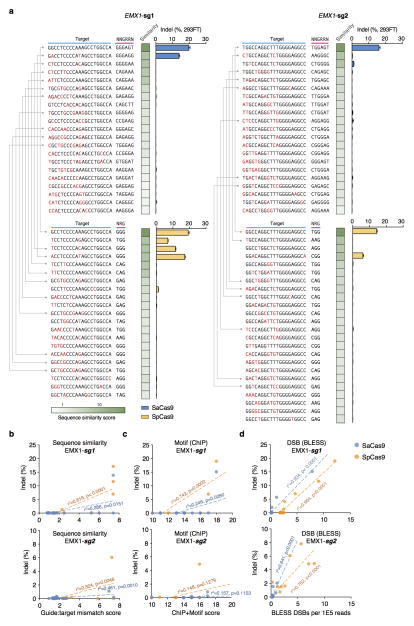
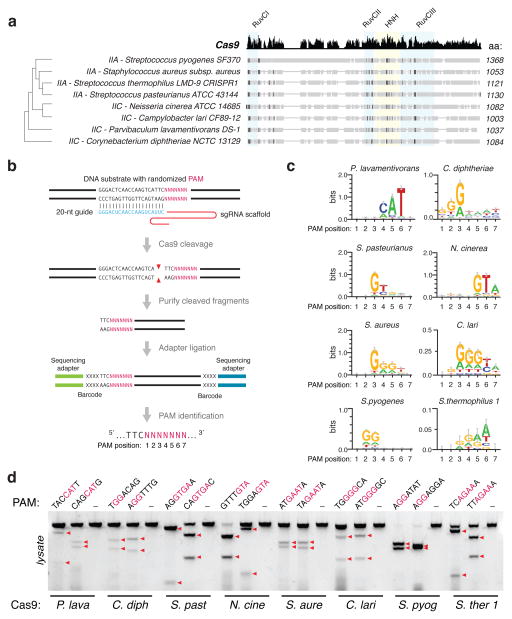
The RNA-guided endonuclease Cas9 has emerged as a versatile genome-editing platform. However, the size of the commonly used Cas9 from Streptococcus pyogenes (SpCas9) limits its utility for basic research and therapeutic applications that use the highly versatile adeno-associated virus (AAV) delivery vehicle. Here, we characterize six smaller Cas9 orthologues and show that Cas9 from Staphylococcus aureus (SaCas9) can edit the genome with efficiencies similar to those of SpCas9, while being more than 1 kilobase shorter. We packaged SaCas9 and its single guide RNA expression cassette into a single AAV vector and targeted the cholesterol regulatory gene Pcsk9 in the mouse liver. Within one week of injection, we observed >40% gene modification, accompanied by significant reductions in serum Pcsk9 and total cholesterol levels. We further assess the genome-wide targeting specificity of SaCas9 and SpCas9 using BLESS, and demonstrate that SaCas9-mediated in vivo genome editing has the potential to be efficient and specific.


Conflict of interest statement

The authors declare competing financial interests: details are available in the online version of the paper.

Figures

Extended Data Figure 1
Extended Data Figure 1. Selection of Type II CRISPR-Cas loci from eight bacterial species
a, Distribution of lengths for Cas9 >600 Cas9 orthologs. b, Schematic of Type II CRISPR-Cas loci and sgRNA from eight bacterial species. Spacer or “guide” sequences are shown in blue, followed by direct repeat (gray). Predicted tracrRNAs are shown in red, and folded based on the Constraint Generation RNA folding model.
Extended Data Figure 2
Extended Data Figure 2. Cas9 ortholog cleavage pattern in vitro
Stacked bar graph indicates the fraction of targets cleaved at 2, 3, 4, or 5-bp upstream of PAM for each Cas9 ortholog; most Cas9s cleave stereotypically at 3-bp upstream of PAM (red triangle).
Extended Data Figure 3
Extended Data Figure 3. Test of Cas9 ortholog activity in 293FT cells
a, SURVEYOR assays showing indel formation at human endogenous loci from co-transfection of Cas9 orthologs and sgRNA. PAM sequences for individual targets are shown above each lane, with the consensus region for each PAM highlighted in red. Red triangles indicate cleaved fragments. b, SaCas9 generates indels efficiently for a multiple targets. c, Box-whisker plot of indel formation as a function of SaCas9 guide length L, with unaltered guides (perfect match of L nucleotides, gray bars) or replacement of the 5′-most base of guide with guanine (G + L −1 nucleotides, blue bars) (n = 8 guides).
Extended Data Figure 4
Extended Data Figure 4. Optimization of SaCas9 sgRNA scaffold in mammalian cells
a, Schematic of the Staphylococcus aureus subspecies aureus CRISPR locus. b, Schematic of SaCas9 sgRNA with 21-nt guide, crRNA repeat (gray), tetraloop (black) and tracrRNA (red). The number of crRNA repeat to tracrRNA anti-repeat base-pairing is indicated above the gray boxes. SaCas9 cleaves targets with varying repeat:anti-repeat lengths in c, HEK 293FT and d, Hepa1-6 cell lines. (n=3, error bars show S.E.M.)
Extended Data Figure 5
Extended Data Figure 5. Genome-wide binding by Cas9-chromatin immunoprecipitation (dCas9-ChIP)
a, Unbiased identification of PAM motif for dSaCas9 and dSpCas9. Peaks were analyzed for the best match by motif score to the guide region only within 50-nt of the peak summit. The alignment extended for 10-nt at the 3′ end and visualized using Weblogo. Numbers in parentheses indicate the number of called peaks. b, Histograms show the distribution of the peak summit relative to motif for dSaCas9 and dSpCas9. Position 1 on x-axis indicates the first base of PAM.
Extended Data Figure 6
Extended Data Figure 6. Indel measurements at candidate off-target sites based on ChIP
Indels at top off-target sites predicted by dCas9-ChIP for each Cas9 and sgRNA pair, based on ChIP peaks ranked by sequence similarity of the genomic loci to the guide motif (heatmap in purple), or p-value of ChIP enrichment over control (heatmap in red). Lines connect the common targets (EMX1) and off-targets between the two Cas9s.
Extended Data Figure 7
Extended Data Figure 7. Analysis pipeline of sequencing data from BLESS
a, Overview of the data analysis pipeline starting from the raw sequencing reads. Representative sequencing read mappings and corresponding histograms of the pairwise distances between all the forward orientation (red) reads and reverse orientation (blue) reads, displayed for representative b, DSB hotspots and poorly-defined DSB sites and c, Cas9 induced DSBs with detectable indels. Fraction of pairwise distances between reads overlapping by no more than 6bp (dashed vertical line) are indicated over histogram plots.
Extended Data Figure 8
Extended Data Figure 8. Indel measurements at off-target sites based on DSB scores
List of top off-target sites ranked by DSB scores for each Cas9 and sgRNA pair. Indel levels are determined by targeted deep sequencing. Blue triangles indicate positions of peak BLESS signal, and where present, PAMs and targets with sequence homology to the guide are highlighted. Lines connect the common on-targets (EMX1) and off-targets between the two Cas9s. N.D. not determined.
Extended Data Figure 9
Extended Data Figure 9. Indel measurements of top candidate off-target sites based on sequence similarity score
Off-targets are predicted based on sequence similarity to on-target, accounting for number and position of Watson-Crick base-pairing mismatches as previously described. NNGRR and NRG are used as potential PAMs for SaCas9 and SpCas9, respectively. Lines connect the common targets (EMX1) and off-targets between the two Cas9s. Correlation plots between indel percentages and b, prediction based on sequence similarity, c, ChIP peaks ranked by motif similarity, or d, DSB scores for top ranking off-target loci. Trendlines, r2, and p-values are calculated using ordinary least squares.
Extended Data Figure 10
Extended Data Figure 10. SaCas9 targeting Apob locus in the mouse liver
a, Schematics illustrating the mouse Apob gene locus and the positions of the three guides tested. b, Experimental time course and c, SURVEYOR assay showing indel formation at target loci after intravenous injection of AAV2/8 carrying thyroxine-binding globulin (TBG) promoter-driven SaCas9 and U6-driven guide at 2E11 total genome copies (n = 1 animal each). d, Oil-red staining of liver tissue from AAV- or saline-injected animals. Male C56BL/6 mice were injected at 8 weeks of age and analyzed 4 weeks post injection.
Figure 1
Figure 1. Biochemical screen for small Cas9 orthologs
a, Phylogenetic tree of selected Cas9 orthologs. Subfamily and sizes (amino acids) are indicated, with nuclease domains highlighted in colored boxes, and conserved sequences in black. b, Schematic illustration of the in vitro cleavage-based method used to identify the first seven positions (5′-NNNNNNN) of protospacer adjacent motifs (PAMs). c, Consensus PAMs for eight Cas9 orthologs from sequencing of cleaved fragments. Error bars are Bayesian 95% confidence interval. d, Cleavage using different orthologs and sgRNAs targeting loci bearing the putative PAMs (consensus shown in red). Red triangles indicate cleavage fragments.
Figure 2
Figure 2. Characterization of Staphylococcus aureus Cas9 (SaCas9) in 293FT cells
a, SaCas9 sgRNA scaffold (red) and guide (blue) base-pairing at target locus (black) immediately 5′ of PAM. b, Box-whisker plot showing indels vary depending on the length of the guide sequence (n=4). c, dSaCas9-ChIP reveals peaks associated with seed + PAM. Text to the right indicates the total number of peaks and percentage containing significant (FDR < 0.1) match to the guide motif followed by NNGRRT PAMs. d, Pooled indel values for NNGRR(A), (C), (G), or (T) PAM combinations (n=12, 21, 39, and 44 respectively).
Figure 3
Figure 3. Characterization of genome-wide nuclease activity of SaCas9 and SpCas9
a, Schematic of BLESS processing steps. b, Manhattan plots of genome-wide DSB clusters generated by each Cas9 and sgRNA pair, with on-target loci shown above. c, Correlation between DSB scores and indel levels for top-scoring DSB clusters. Trendlines, r2, and p-values are calculated using ordinary least squares. d, Off-target loci from BLESS with detectable indels through targeted deep sequencing (n=3) are shown. Heatmaps indicate DSB score (blue), motif score from ChIP (purple), or sequence similarity score (green) for each locus. Blue triangles indicate peak positions of BLESS signal.
Figure 4
Figure 4. AAV-delivery of SaCas9 for in vivo genome editing
a, Single-vector AAV system and experimental timeline. b, Indels at Pcsk9 targets in liver tissue following injection of AAV at 2E11 total genome copies (n=3 animals). Time course of c, serum Pcsk9 and d, total cholesterol in animals (n=3 for all titers and time points, error bars show S.E.M.). e, Manhattan plots of BLESS-identified DSB clusters in N2a cells. Inset indicates indel levels at top DSB scoring loci. f, Indels in liver tissue (n=3 animals, error bars indicate Wilson intervals) at BLESS-identified off-target loci. Heatmap indicates DSB scores.
Figure 5
Figure 5. Liver function tests and toxicity examination in injected animals
a., Histological analysis of the liver at 1-week post-injection by H&E stain. Scale bar = 10μm. b, Liver function tests in Pcsk9-targeted (both Pcsk9-sg1 and Pcsk9-sg2; 2E11 total genome copies, n ≥ 4), TBG::EGFP injected (2E11 total genome copies, n=3), and un-injected (n=5) animals. Dashed lines show the upper and lower ranges of normal value in mice where applicable.

Similar articles

Cited by

References

    1. Bolotin A, Quinquis B, Sorokin A, Ehrlich SD. Clustered regularly interspaced short palindrome repeats (CRISPRs) have spacers of extrachromosomal origin. Microbiol Read Engl. 2005;151:2551–2561. - PubMed
    1. Barrangou R, et al. CRISPR provides acquired resistance against viruses in prokaryotes. Science. 2007;315:1709–1712. - PubMed
    1. Garneau JE, et al. The CRISPR/Cas bacterial immune system cleaves bacteriophage and plasmid DNA. Nature. 2010;468:67–71. - PubMed
    1. Deltcheva E, et al. CRISPR RNA maturation by trans-encoded small RNA and host factor RNase III. Nature. 2011;471:602–607. - PMC - PubMed
    1. Sapranauskas R, et al. The Streptococcus thermophilus CRISPR/Cas system provides immunity in Escherichia coli. Nucleic Acids Res. 2011;39:9275–9282. - PMC - PubMed

Publication types

MeSH terms

Associated data