. 2015 Jan 17;4(4):310-24.
doi: 10.1016/j.molmet.2015.01.005. eCollection 2015 Apr.

Therapeutic effects of adropin on glucose tolerance and substrate utilization in diet-induced obese mice with insulin resistance

Affiliations

Therapeutic effects of adropin on glucose tolerance and substrate utilization in diet-induced obese mice with insulin resistance

Su Gao et al. Mol Metab. .

Abstract

Objective: The peptide hormone adropin regulates fuel selection preferences in skeletal muscle under fed and fasted conditions. Here, we investigated whether adropin treatment can ameliorate the dysregulation of fuel substrate metabolism, and improve aspects of glucose homeostasis in diet-induced obesity (DIO) with insulin resistance.

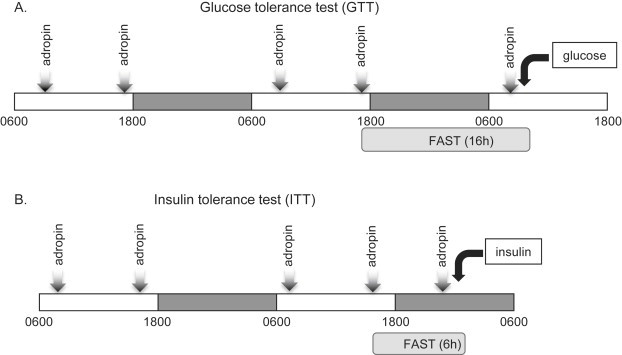
Methods: DIO C57BL/6 mice maintained on a 60% kcal fat diet received five intraperitoneal (i.p.) injections of the bioactive peptide adropin(34-76) (450 nmol/kg/i.p.). Following treatment, glucose tolerance and whole body insulin sensitivity were assessed and indirect calorimetry was employed to analyze whole body substrate oxidation preferences. Biochemical assays performed in skeletal muscle samples analyzed insulin signaling action and substrate oxidation.

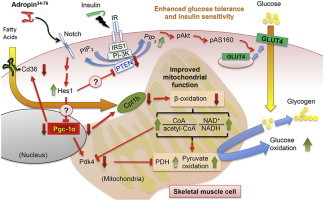
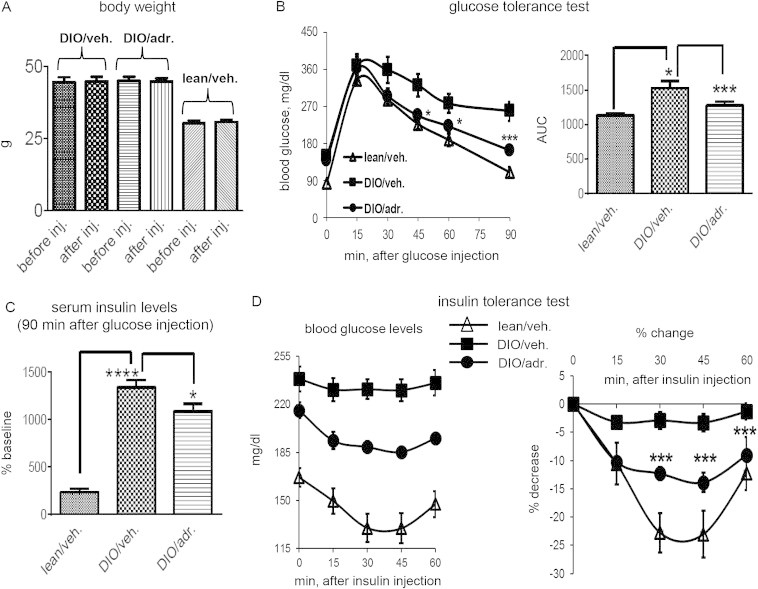
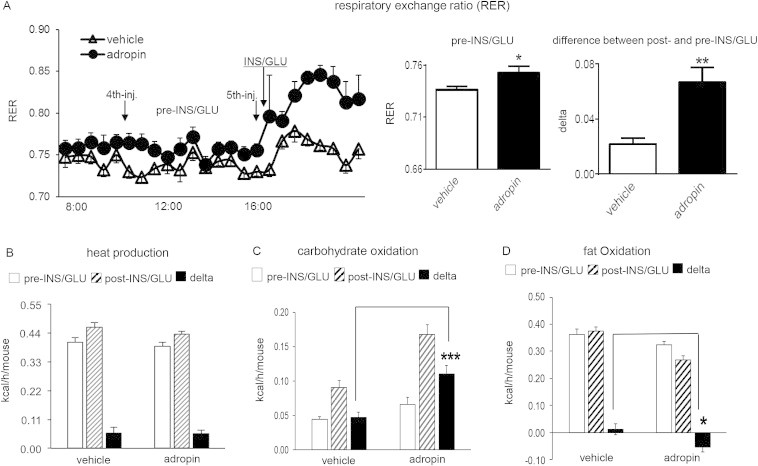
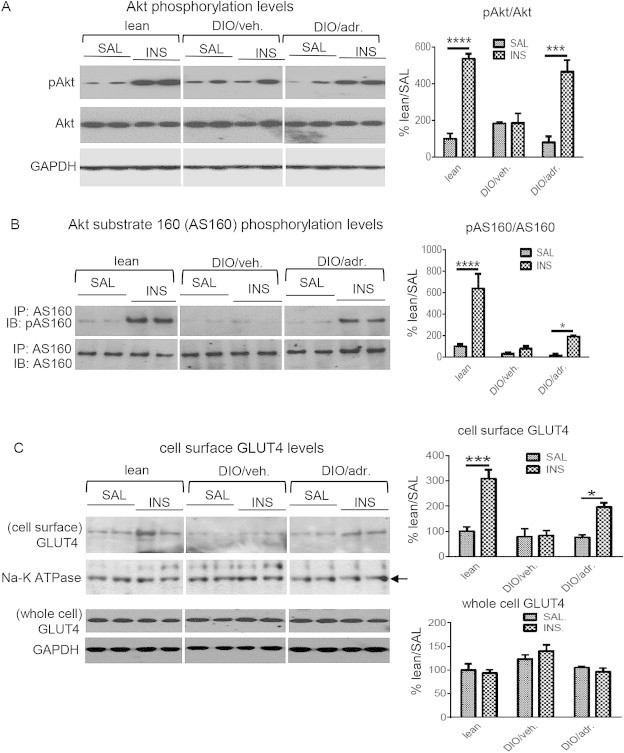
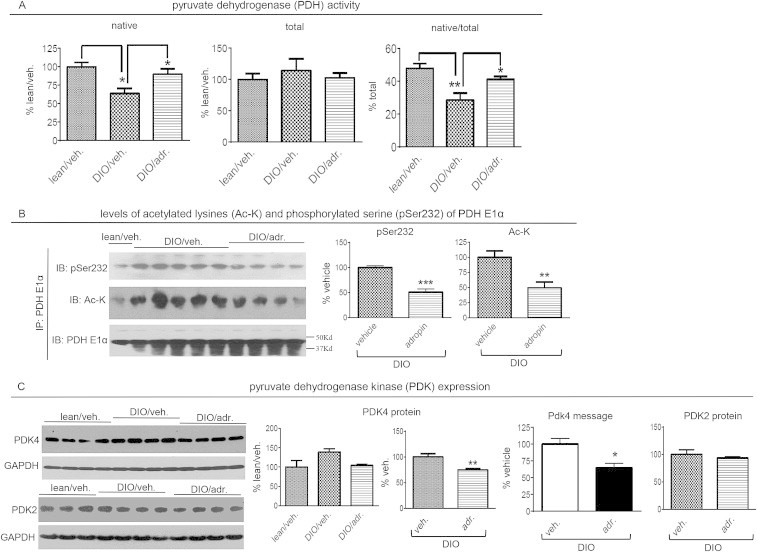
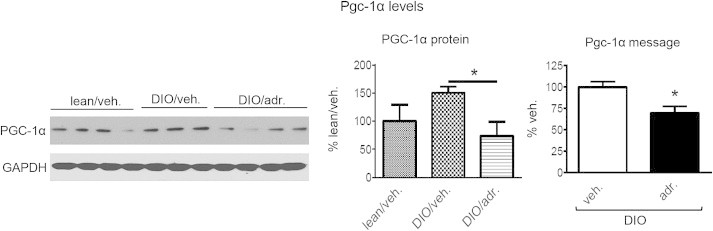
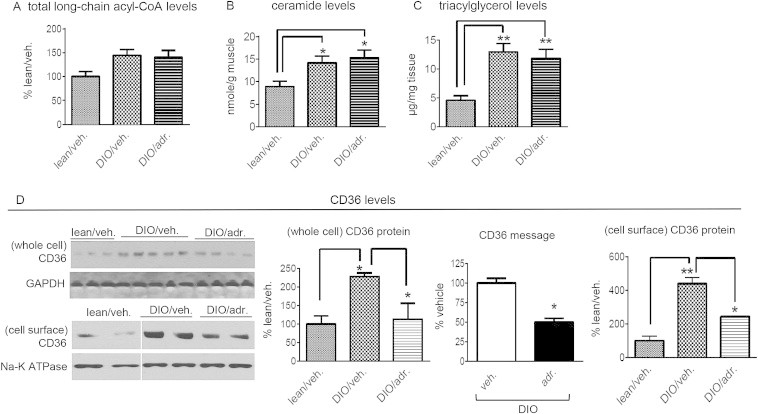
Results: Adropin treatment improved glucose tolerance, enhanced insulin action and augmented metabolic flexibility towards glucose utilization. In muscle, adropin treatment increased insulin-induced Akt phosphorylation and cell-surface expression of GLUT4 suggesting sensitization of insulin signaling pathways. Reduced incomplete fatty acid oxidation and increased CoA/acetyl-CoA ratio suggested improved mitochondrial function. The underlying mechanisms appear to involve suppressions of carnitine palmitoyltransferase-1B (CPT-1B) and CD36, two key enzymes in fatty acid utilization. Adropin treatment activated pyruvate dehydrogenase (PDH), a rate-limiting enzyme in glucose oxidation, and downregulated PDH kinase-4 (PDK-4) that inhibits PDH. Along with these changes, adropin treatment downregulated peroxisome proliferator-activated receptor-gamma coactivator-1α that regulates expression of Cpt1b, Cd36 and Pdk4.

Conclusions: Adropin treatment of DIO mice enhances glucose tolerance, ameliorates insulin resistance and promotes preferential use of carbohydrate over fat in fuel selection. Skeletal muscle is a key organ in mediating adropin's whole-body effects, sensitizing insulin signaling pathways and altering fuel selection preference to favor glucose while suppressing fat oxidation.

Keywords: Adropin; Fatty acid metabolism; Glucose metabolism; Insulin action; Metabolic flexibility; Mitochondrial function.


Figures

None
Graphical abstract
Figure 1
Figure 1
Schemes of the animal treatment for the assessments of glucose and insulin tolerance in DIO mice. DIO mice received five intraperitoneal (i.p.) injections of adropin34-76 or vehicle over a 48 h period. A group of chow-fed lean mice included in the study received injections of vehicle. (A) Protocol for assessing the impact of adropin treatment on glucose tolerance. After the 4th injection of adropin or vehicle, food was removed and the mice fasted overnight. The mice received a 5th injection the next morning; one hour later, baseline blood glucose levels were determined (t = 0); mice then received an i.p. injection of glucose (2 mg/g fat free mass). Glucose levels were then determined at 15 min intervals. (B) Protocol for assessing the impact of adropin treatment on insulin tolerance. DIO and the lean control mice received five intraperitoneal (i.p.) injections of adropin34-76 or vehicle. One hour after the 5th injection, the mice that had been fasted for 6 h were given an i.p. injection of insulin (0.5 mU/g body weight).
Figure 2
Figure 2
Treatment of DIO mice with adropin34-76enhances glucose tolerance and ameliorates insulin resistance without affecting body weight. (A) Body weights before the first injection and after the fifth injection were compared (n = 5). (B) Effect of adropin treatment on glucose tolerance. Following glucose injection, blood glucose levels were monitored at regular intervals for 90 min (n = 7–8). *: DIO/adr. vs. DIO/veh., P < 0.05; ***: DIO/adr. vs. DIO/veh., P < 0.001. The right panel shows the area under the curve (AUC) calculated for the glucose excursion curve. *: DIO/veh. vs. lean/veh., P < 0.05; ***: DIO/adr. vs. DIO/veh., P < 0.001. (C) Glucose-induced changes in serum insulin levels following adropin treatment. Serum samples were collected from two experiments, and the values of insulin levels at 90 min after glucose injection are expressed as a percentage of the basal level (i.e., fasting values before glucose injection) of the lean controls (0.45 ng/ml). ****: DIO/veh. vs. lean/veh., P < 0.0001; *: DIO/adr. vs. DIO/veh., P < 0.05. (D) Effect of adropin treatment on whole body insulin sensitivity. Blood glucose levels were monitored at 15-min interval for 60 min (n = 6–9) after an injection of insulin. The right panel shows the percent decline (% decrease) in blood glucose following insulin injection. ***: DIO/adr. vs. DIO/veh., P < 0.001.
Figure 3
Figure 3
Adropin treatment increases carbohydrate oxidation and enhances metabolic flexibility towards glucose oxidation in DIO mice. DIO mice received 5 injections of adropin or vehicle (n = 8) prior to injection of a bolus of insulin (2 mU/g) and glucose (2 mg/g) (INS/GLU); the mice had been fasted for 16 h prior to the injection of INS/GLU. (A) The respiratory exchange ratio (RER) for the time preceding and following the insulin/glucose injection. The left panel of curves shows the individual RER values along the injections. The averaged values for each animal between the 4th and 5th injection are designated as “Pre-INS/GLU”. Values averaged after the 5th injection were designated as “Post-INS/GLU”. The differences (delta) between the pre-injection average and the post-injection average, i.e., “Post-INS/GLU” minus “Pre-INS/GLU”, were then calculated. (B) Heat production (kcal/h) for the “Pre-INS/GLU” and the “Post-INS/GLU” period defined in (A), and the change (delta) of heat productions (“Post” minus “Pre”) were calculated. The corresponding carbohydrate oxidation levels (C) and fat oxidation levels (D) were calculated. *, P < 0.05; **, P < 0.01; ***, P < 0.001.
Figure 4
Figure 4
Adropin treatment enhances insulin-signaling actions in muscle of DIO mice. DIO and lean control mice received five injections of adropin34-76 or the vehicle, and were fasted for 6 h, with a final adropin injection administered 5 h into the fast. The mice then received i.p. injections of insulin (INS, 5 mU/g) or saline (SAL). Muscle tissue was freeze clamped and flash frozen in liquid nitrogen 10 min after the injection of insulin or saline. (A) The muscle samples were divided into two subgroups using two sets of gels (n = 4–8). The representative blots from one set of gels were presented, showing phospho-Akt (pAkt-S473) and total Akt (n = 2–4). GAPDH was used as the loading control. The level of the pAkt or total Akt was normalized to the corresponding GAPDH, and the ratios of the normalized pAkt to the normalized Akt were presented. (B) The Ab against Akt substrate 160 (AS160) was used to immunoprecipitate AS160 protein from whole muscle lysate. The immunoprecipitates were probed with a phospho-AS160 (pAS160-T642) Ab and AS160 Ab (n = 3–5). (C) GLUT4 contents in the subcellular fraction consisting mainly of cell surface were detected by Western blotting, and Na-K ATPase was used as the loading control (two muscle tissues were pooled; n = 2–3). In parallel, the GLUT4 protein levels in whole muscle lysate were shown (n = 3–4). In all blots, two representatives from individual groups in the same gel are presented. *, P < 0.05; ***, P < 0.001; ****, P < 0.0001.
Figure 5
Figure 5
Adropin treatment of DIO mice reduced incomplete oxidation of fatty acid and reduced CPT1 activity in muscle. Whole muscle lysates were used for the measurement of the production of acid soluble metabolites (ASM), indicating incomplete oxidation (A), and the production of CO2, indicating complete oxidation (B). (C) Total fatty acid oxidation (FAO) was calculated as the sum of the production of ASM and CO2 (n = 7). (D) CPT-1 activities in isolated muscle mitochondria of vehicle- and adropin-treated DIO mice (n = 4). (E) Muscle Cpt1b message levels in vehicle- and adropin-treated DIO mice (n = 6). (F) Free CoA and acetyl-CoA levels in muscle of vehicle- and adropin-treated DIO mice were measured; the CoA to acetyl-CoA ratio (CoA/acetyl-CoA) is shown (n = 5–6). *, P < 0.05.
Figure 6
Figure 6
Adropin treatment increased pyruvate dehydrogenase (PDH) activity, and decreased PDK-4 expressions, in the muscle from DIO mice. (A) PDH activity. The activity in whole muscle lysate in the presence of phosphatase inhibitors and ATP-depleting system is designated as “native activity”. The activity following phosphatase treatment is designated as “total activity”. The ratio of the native activity to total activity was then calculated. (B) The PDH E1α subunit was immunoprecipitated. The immunoprecipitates were used for detections of phospho-Ser232 (pS232), acetylated lysine (Ac-K) and total E1α (DIO group, n = 4–5). A conformation-specific anti-IgG antibody that only recognizes native IgG was used to detect the proteins. The molecular weight of the E1α subunit is 43Kda. (C) The levels of PDK4 protein (n = 4), PDK4 message (n = 5) and PDK2 protein (n = 3–4). *, P < 0.05; **, P < 0.01; ***, P < 0.001.
Figure 7
Figure 7
Adropin treatment decreased PGC-1α expression levels in the muscle of DIO mice. Shown are the levels of PGC-1α protein (n = 3–4) and mRNA (n = 6) in muscle. *, P < 0.05.
Figure 8
Figure 8
Adropin treatment did not alter intramuscular lipid intermediate levels in DIO mice. (A) Individual long-chain fatty acyl-CoA's levels in muscle were measured, and the sum of the individual acyl-CoA's was calculated as the total level. The assay was performed in two separate groups, and the average level of the “lean/veh.” was set as “100%” (n = 8–10). (B) Ceramide levels in muscle (n = 5–6). (C) Triacylglycerol (TAG) levels in muscle (n = 6–8). (D) The levels of CD36 protein in the cell surface (n = 3–5), CD36 message (n = 6) and CD36 protein in whole muscle (two samples pooled, n = 2). *, P < 0.05; **, P < 0.01.

Similar articles

Cited by

References

    1. Goetze J.P., Albrethsen J. Adropin: a new regulatory peptide in cardiovascular endocrinology. Regulatory Peptides. 2014;190–191:41–42. - PubMed
    1. Aydin S. Three new players in energy regulation: preptin, adropin and irisin. Peptides. 2014;56:94–110. - PubMed
    1. Gao S., McMillan R.P., Jacas J., Zhu Q., Li X., Kumar G.K. Regulation of substrate oxidation preferences in muscle by the peptide hormone adropin. Diabetes. 2014;63(10):3242–3452. - PMC - PubMed
    1. Kumar K.G., Trevaskis J.L., Lam D.D., Sutton G.M., Koza R.A., Chouljenko V.N. Identification of adropin as a secreted factor linking dietary macronutrient intake with energy homeostasis and lipid metabolism. Cell Metabolism. 2008;8:468–481. - PMC - PubMed
    1. Wong C.-M., Wang Y., Lee J.T.H., Huang Z., Wu D., Xu A. Adropin is a brain membrane-bound protein regulating physical activity via the NB-3/Notch signaling pathway in mice. Journal of Biological Chemistry. 2014;289:25976–25986. - PMC - PubMed

LinkOut - more resources