The coreceptor CD4 is expressed in distinct nanoclusters and does not colocalize with T-cell receptor and active protein tyrosine kinase p56lck
- PMID: 25829544
- PMCID: PMC4386407
- DOI: 10.1073/pnas.1503532112
The coreceptor CD4 is expressed in distinct nanoclusters and does not colocalize with T-cell receptor and active protein tyrosine kinase p56lck
Abstract
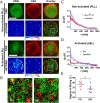
CD4 molecules on the surface of T lymphocytes greatly augment the sensitivity and activation process of these cells, but how it functions is not fully understood. Here we studied the spatial organization of CD4, and its relationship to T-cell antigen receptor (TCR) and the active form of Src kinase p56lck (Lck) using single and dual-color photoactivated localization microscopy (PALM) and direct stochastic optical reconstruction microscopy (dSTORM). In nonactivated T cells, CD4 molecules are clustered in small protein islands, as are TCR and Lck. By dual-color imaging, we find that CD4, TCR, and Lck are localized in their separate clusters with limited interactions in the interfaces between them. Upon T-cell activation, the TCR and CD4 begin clustering together, developing into microclusters, and undergo a larger scale redistribution to form supramolecluar activation clusters (SMACs). CD4 and Lck localize in the inner TCR region of the SMAC, but this redistribution of disparate cluster structures results in enhanced segregation from each other. In nonactivated cells these preclustered structures and the limited interactions between them may serve to limit spontaneous and random activation events. However, the small sizes of these island structures also ensure large interfacial surfaces for potential interactions and signal amplification when activation is initiated. In the later activation stages, the increasingly larger clusters and their segregation from each other reduce the interfacial surfaces and could have a dampening effect. These highly differentiated spatial distributions of TCR, CD4, and Lck and their changes during activation suggest that there is a more complex hierarchy than previously thought.
Keywords: PALM; T-cell receptor; coreceptor CD4; dSTORM; superresolution microscopy.
Conflict of interest statement
The authors declare no conflict of interest.
Figures


Similar articles
-
Association of tyrosine kinase p56lck with CD4 inhibits the induction of growth through the alpha beta T-cell receptor.Nature. 1992 Jul 23;358(6384):328-31. doi: 10.1038/358328a0. Nature. 1992. PMID: 1322497
-
Sequestration of CD4-associated Lck from the TCR complex may elicit T cell hyporesponsiveness in nonobese diabetic mice.J Immunol. 1998 Feb 1;160(3):1148-57. J Immunol. 1998. PMID: 9570528
-
Internalization of HIV glycoprotein gp120 is associated with down-modulation of membrane CD4 and p56lck together with impairment of T cell activation.J Immunol. 1992 Jul 1;149(1):285-94. J Immunol. 1992. PMID: 1535086
-
CD4 function in thymocyte differentiation and T cell activation.Philos Trans R Soc Lond B Biol Sci. 1993 Oct 29;342(1299):25-34. doi: 10.1098/rstb.1993.0131. Philos Trans R Soc Lond B Biol Sci. 1993. PMID: 7904343 Review.
-
Interactions of CD4 with MHC class II molecules, T cell receptors and p56lck.Philos Trans R Soc Lond B Biol Sci. 1993 Oct 29;342(1299):13-24. doi: 10.1098/rstb.1993.0130. Philos Trans R Soc Lond B Biol Sci. 1993. PMID: 7506833 Review.
Cited by
-
Beyond TCR Signaling: Emerging Functions of Lck in Cancer and Immunotherapy.Int J Mol Sci. 2019 Jul 16;20(14):3500. doi: 10.3390/ijms20143500. Int J Mol Sci. 2019. PMID: 31315298 Free PMC article. Review.
-
Rapid statistical discrimination of fluorescence images of T cell receptors on immobilizing surfaces with different coating conditions.Sci Rep. 2021 Jul 29;11(1):15488. doi: 10.1038/s41598-021-94730-3. Sci Rep. 2021. PMID: 34326382 Free PMC article.
-
Nanoparticles presenting clusters of CD4 expose a universal vulnerability of HIV-1 by mimicking target cells.Proc Natl Acad Sci U S A. 2020 Aug 4;117(31):18719-18728. doi: 10.1073/pnas.2010320117. Epub 2020 Jul 20. Proc Natl Acad Sci U S A. 2020. PMID: 32690692 Free PMC article.
-
Quantifying protein densities on cell membranes using super-resolution optical fluctuation imaging.Nat Commun. 2017 Nov 23;8(1):1731. doi: 10.1038/s41467-017-01857-x. Nat Commun. 2017. PMID: 29170394 Free PMC article.
-
The kinase occupancy of T cell coreceptors reconsidered.Proc Natl Acad Sci U S A. 2022 Dec 6;119(49):e2213538119. doi: 10.1073/pnas.2213538119. Epub 2022 Dec 1. Proc Natl Acad Sci U S A. 2022. PMID: 36454761 Free PMC article.
References
-
- Hampl J, Chien YH, Davis MM. CD4 augments the response of a T cell to agonist but not to antagonist ligands. Immunity. 1997;7(3):379–385. - PubMed
-
- Irvine DJ, Purbhoo MA, Krogsgaard M, Davis MM. Direct observation of ligand recognition by T cells. Nature. 2002;419(6909):845–849. - PubMed
-
- König R, Huang LY, Germain RN. MHC class II interaction with CD4 mediated by a region analogous to the MHC class I binding site for CD8. Nature. 1992;356(6372):796–798. - PubMed
Publication types
MeSH terms
Substances
Grants and funding
LinkOut - more resources
Full Text Sources
Other Literature Sources
Molecular Biology Databases
Research Materials
Miscellaneous

