

Sphingomyelin distribution in lipid rafts of artificial monolayer membranes visualized by Raman microscopy
- PMID: 25825736
- PMCID: PMC4403184
- DOI: 10.1073/pnas.1418088112
Sphingomyelin distribution in lipid rafts of artificial monolayer membranes visualized by Raman microscopy
Abstract
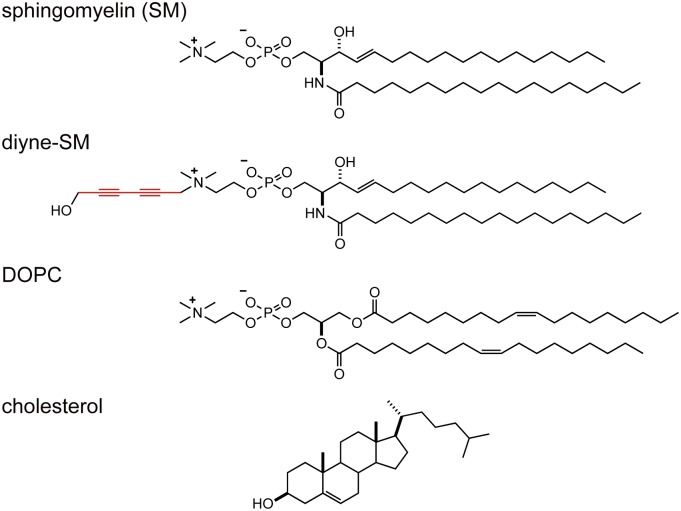
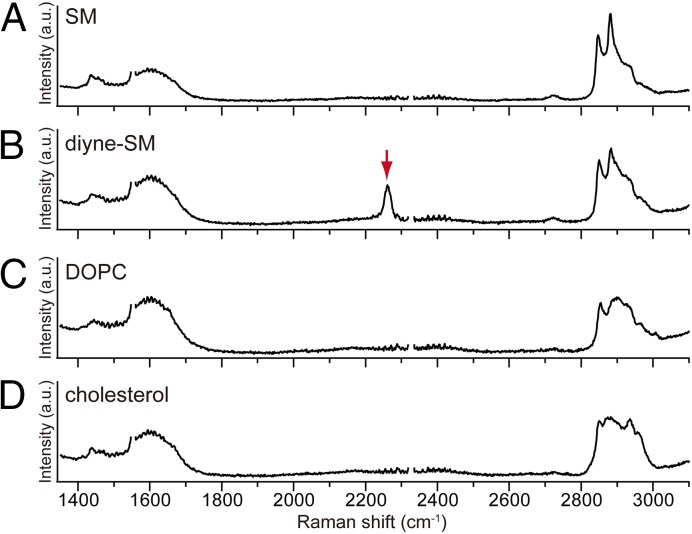
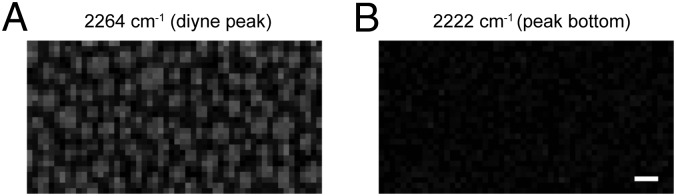
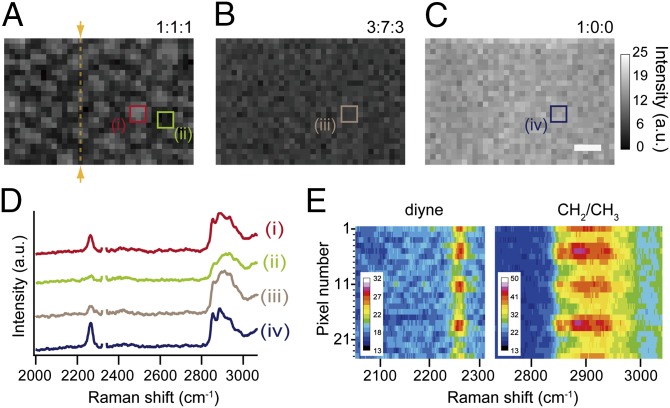
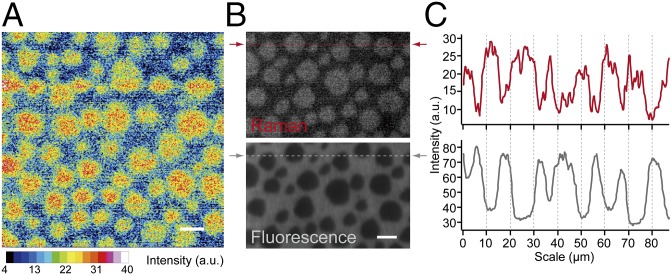
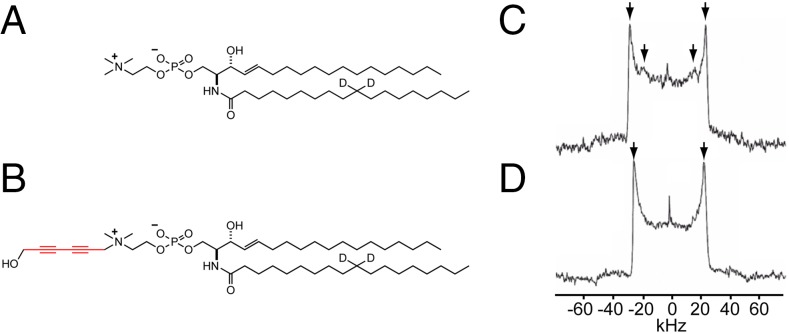
Sphingomyelin (SM) and cholesterol (chol)-rich domains in cell membranes, called lipid rafts, are thought to have important biological functions related to membrane signaling and protein trafficking. To visualize the distribution of SM in lipid rafts by means of Raman microscopy, we designed and synthesized an SM analog tagged with a Raman-active diyne moiety (diyne-SM). Diyne-SM showed a strong peak in a Raman silent region that is free of interference from intrinsic vibrational modes of lipids and did not appear to alter the properties of SM-containing monolayers. Therefore, we used Raman microscopy to directly visualize the distribution of diyne-SM in raft-mimicking domains formed in SM/dioleoylphosphatidylcholine/chol ternary monolayers. Raman images visualized a heterogeneous distribution of diyne-SM, which showed marked variation, even within a single ordered domain. Specifically, diyne-SM was enriched in the central area of raft domains compared with the peripheral area. These results seem incompatible with the generally accepted raft model, in which the raft and nonraft phases show a clear biphasic separation. One of the possible reasons is that gradual changes of SM concentration occur between SM-rich and -poor regions to minimize hydrophobic mismatch. We believe that our technique of hyperspectral Raman imaging of a single lipid monolayer opens the door to quantitative analysis of lipid membranes by providing both chemical information and spatial distribution with high (diffraction-limited) spatial resolution.
Keywords: Raman imaging; alkyne tag; lipid raft; sphingomyelin; supported monolayer.
Conflict of interest statement
The authors declare no conflict of interest.
Figures
Similar articles
-
Evidence of lipid rafts based on the partition and dynamic behavior of sphingomyelins.Chem Phys Lipids. 2018 Sep;215:84-95. doi: 10.1016/j.chemphyslip.2018.07.002. Epub 2018 Jul 10. Chem Phys Lipids. 2018. PMID: 30005889 Review.
-
Sphingomyelin chain length influences the distribution of GPI-anchored proteins in rafts in supported lipid bilayers.Mol Membr Biol. 2007 May-Jun;24(3):233-42. doi: 10.1080/09687860601127770. Mol Membr Biol. 2007. PMID: 17520480
-
Cyclosporin A distribution in cholesterol-sphingomyelin artificial membranes modeled as Langmuir monolayers.Colloids Surf B Biointerfaces. 2018 Jun 1;166:286-294. doi: 10.1016/j.colsurfb.2018.03.031. Epub 2018 Mar 26. Colloids Surf B Biointerfaces. 2018. PMID: 29604571
-
Targeting of Helicobacter pylori vacuolating toxin to lipid raft membrane domains analysed by atomic force microscopy.Biochem J. 2004 Aug 1;381(Pt 3):911-7. doi: 10.1042/BJ20031719. Biochem J. 2004. PMID: 15128269 Free PMC article.
-
Properties of Langmuir and solid supported lipid films with sphingomyelin.Adv Colloid Interface Sci. 2015 Aug;222:385-97. doi: 10.1016/j.cis.2014.03.008. Epub 2014 Mar 28. Adv Colloid Interface Sci. 2015. PMID: 24725646 Review.
Cited by
-
Multiwell Raman plate reader for high-throughput biochemical screening.Sci Rep. 2021 Aug 3;11(1):15742. doi: 10.1038/s41598-021-95139-8. Sci Rep. 2021. PMID: 34344945 Free PMC article.
-
A Raman spectral marker for the iso-octyl chain structure of cholesterol.Anal Sci Adv. 2023 Dec 4;5(1-2):2300057. doi: 10.1002/ansa.202300057. eCollection 2024 Feb. Anal Sci Adv. 2023. PMID: 38828085 Free PMC article.
-
Emphatic visualization of sphingomyelin-rich domains by inter-lipid FRET imaging using fluorescent sphingomyelins.Sci Rep. 2017 Dec 1;7(1):16801. doi: 10.1038/s41598-017-16361-x. Sci Rep. 2017. PMID: 29196620 Free PMC article.
-
Raman Spectroscopy as a Tool to Study the Pathophysiology of Brain Diseases.Int J Mol Sci. 2023 Jan 25;24(3):2384. doi: 10.3390/ijms24032384. Int J Mol Sci. 2023. PMID: 36768712 Free PMC article. Review.
-
Imaging Endocannabinoids and Bioactive Lipid Messengers in Basic Research and Biomedical Application.Cells. 2022 May 26;11(11):1756. doi: 10.3390/cells11111756. Cells. 2022. PMID: 35681451 Free PMC article.
References
-
- Simons K, Ikonen E. Functional rafts in cell membranes. Nature. 1997;387(6633):569–572. - PubMed
-
- Lingwood D, Simons K. Lipid rafts as a membrane-organizing principle. Science. 2010;327(5961):46–50. - PubMed
-
- Simons K, Gerl MJ. Revitalizing membrane rafts: New tools and insights. Nat Rev Mol Cell Biol. 2010;11(10):688–699. - PubMed
-
- Ahmed SN, Brown DA, London E. On the origin of sphingolipid/cholesterol-rich detergent-insoluble cell membranes: Physiological concentrations of cholesterol and sphingolipid induce formation of a detergent-insoluble, liquid-ordered lipid phase in model membranes. Biochemistry. 1997;36(36):10944–10953. - PubMed
Publication types
MeSH terms
Substances
LinkOut - more resources
Full Text Sources
Other Literature Sources
