. 2015 Mar 30:6:6623.
doi: 10.1038/ncomms7623.

Enriched environment reduces glioma growth through immune and non-immune mechanisms in mice

Affiliations

Enriched environment reduces glioma growth through immune and non-immune mechanisms in mice

Stefano Garofalo et al. Nat Commun. .

Abstract

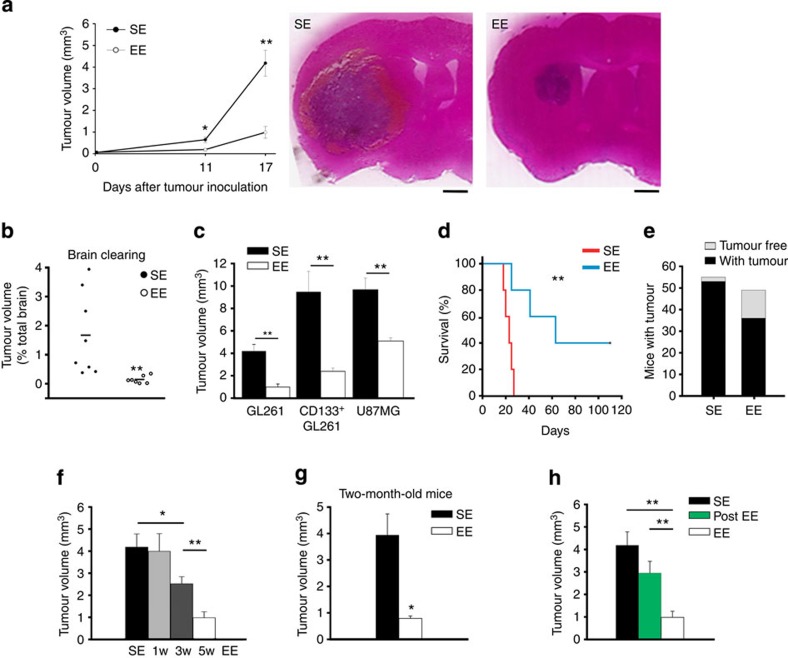
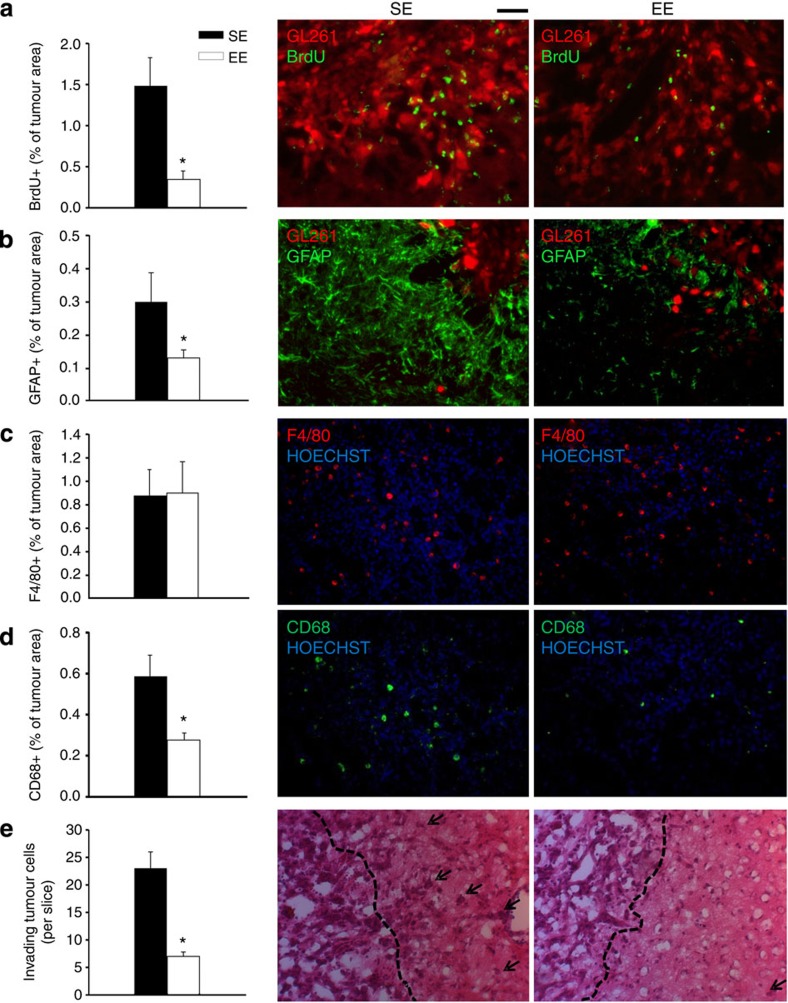
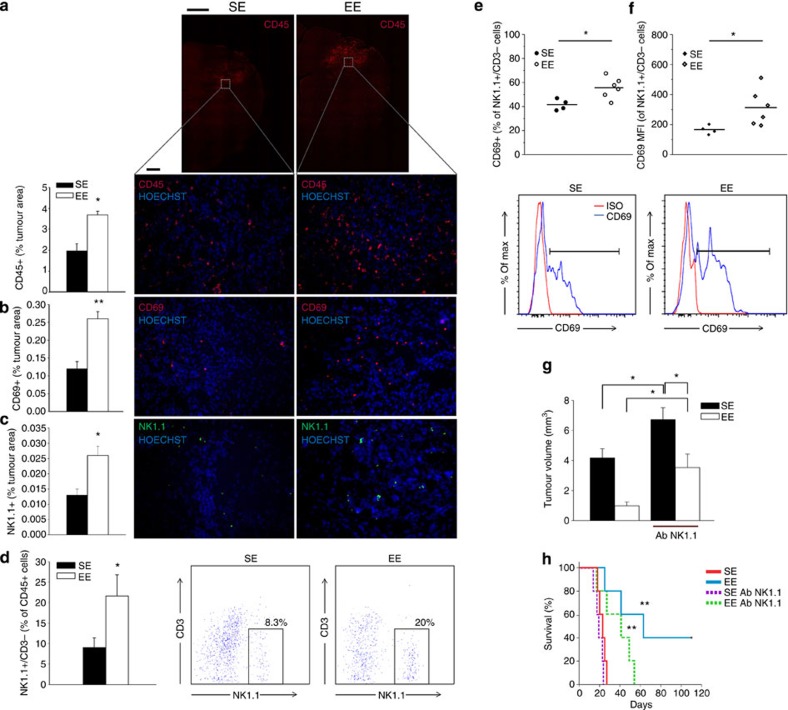
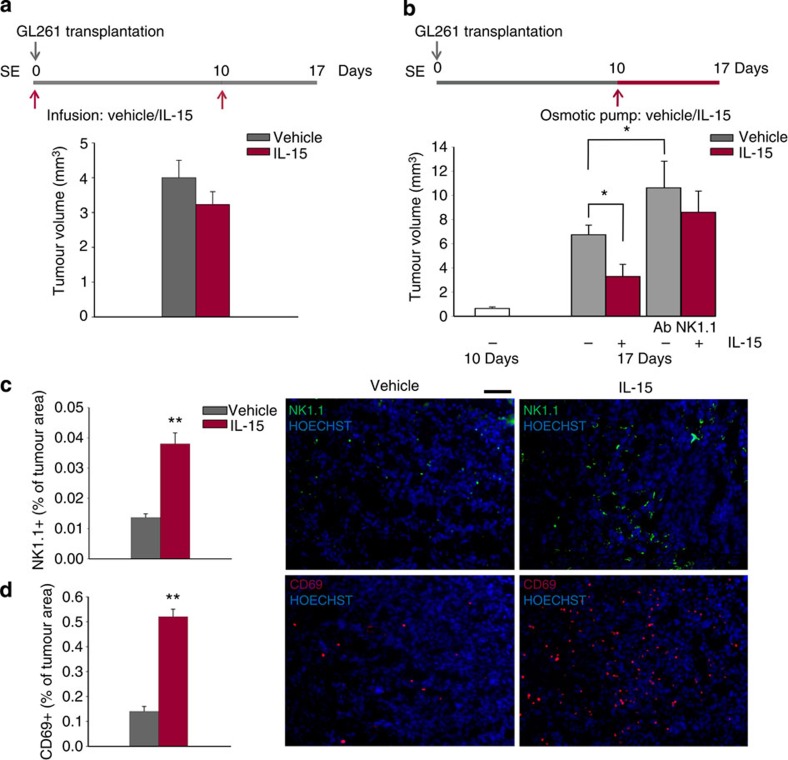
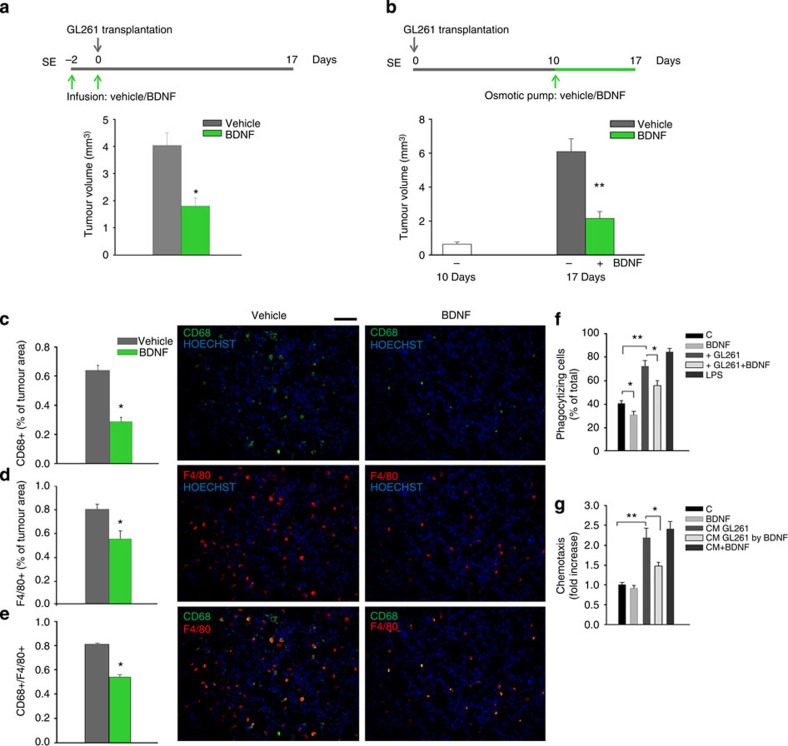
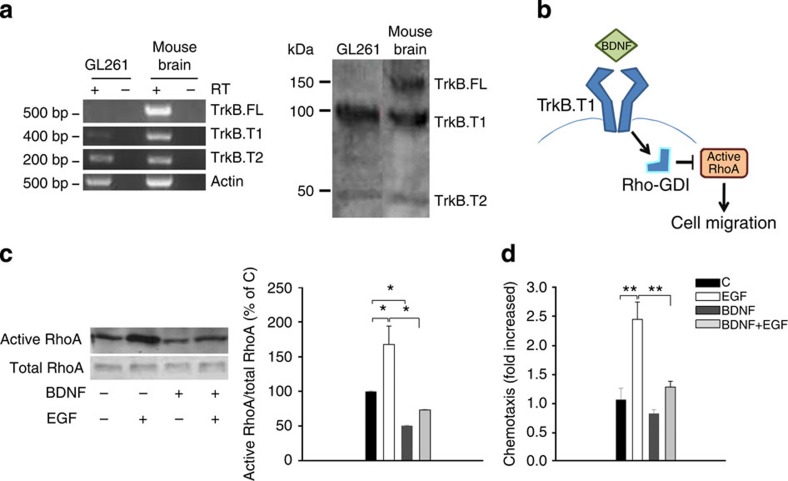
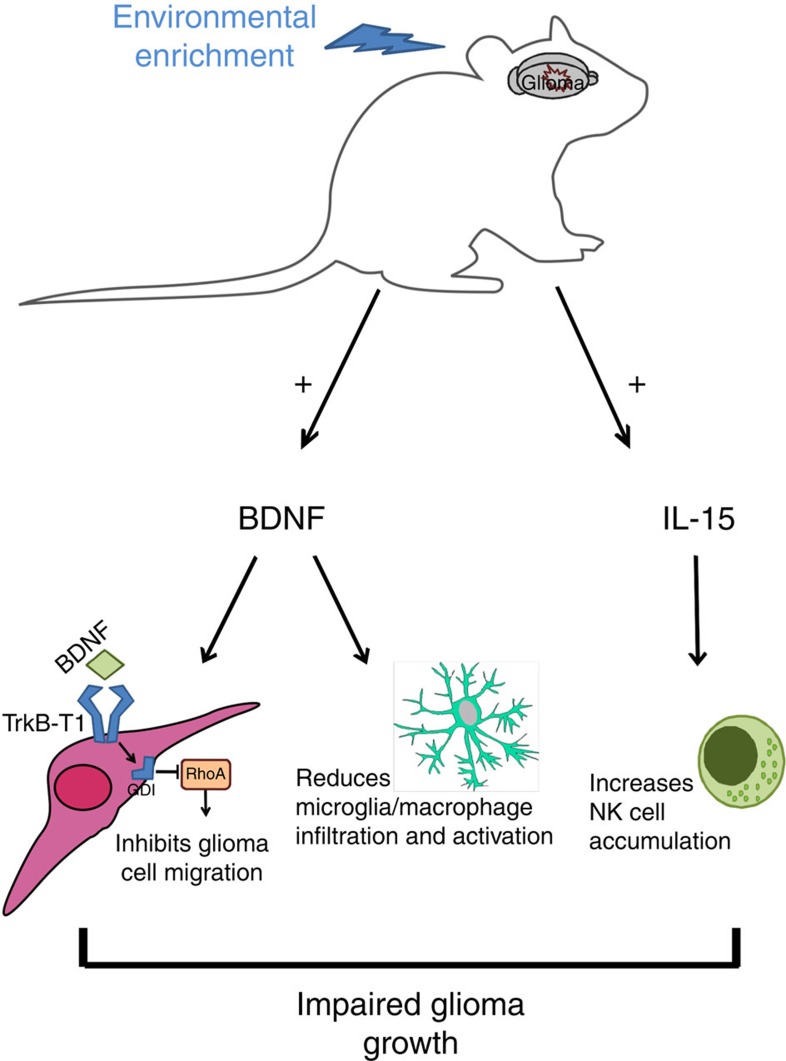
Mice exposed to standard (SE) or enriched environment (EE) were transplanted with murine or human glioma cells and differences in tumour development were evaluated. We report that EE exposure affects: (i) tumour size, increasing mice survival; (ii) glioma establishment, proliferation and invasion; (iii) microglia/macrophage (M/Mφ) activation; (iv) natural killer (NK) cell infiltration and activation; and (v) cerebral levels of IL-15 and BDNF. Direct infusion of IL-15 or BDNF in the brain of mice transplanted with glioma significantly reduces tumour growth. We demonstrate that brain infusion of IL-15 increases the frequency of NK cell infiltrating the tumour and that NK cell depletion reduces the efficacy of EE and IL-15 on tumour size and of EE on mice survival. BDNF infusion reduces M/Mφ infiltration and CD68 immunoreactivity in tumour mass and reduces glioma migration inhibiting the small G protein RhoA through the truncated TrkB.T1 receptor. These results suggest alternative approaches for glioma treatment.


Figures

Figure 1
Figure 1. Exposure to EE reduces glioma growth and prolongs survival.
(a) The mean tumour volumes at 11 and 17 days after implantation of glioma cells into the striatum of C57BL/6 mice, housed in SE or EE, as indicated, from at least 11 mice per conditions. *P<0.05, **P<0.01, Student’s t-test. Representative coronal brain sections are shown on the right for each condition at 17 days. Scale bar, 1 mm. (b) Quantification of tumour volumes under the same experimental conditions as in a, at 17 days, with the brain-clearing technique (n=7–8; **P<0.001 Student’s t-test). Representative Movies are shown as Supplementary Material.(c) The mean tumour volumes (±s.e.m.) at 17 days after implantation of GL261, purified CD133+ GL261 or U87MG glioma cells into the striatum of C57BL/6, or SCID mice housed in SE or EE, as indicated; seven animals per condition. **P<0.01, Student’s t-test. (d) Kaplan–Meier survival curves of SE (red) and EE (blue) GL261 glioma-bearing mice (n=5 per group; log-rank test **P<0.01). (e) Tumour resistance in SE and EE mice expressed as total number of mice with (black) and without (grey) brain tumour 17 days after GL261 transplantation. (f) ‘Dose dependency’ of EE exposure on tumour volume (n=7 per group; *P<0.05; **P<0.01, one-way ANOVA. (g) Effect of SE or EE housing on 2-month-old mice transplanted with glioma (n=5 per group; *P<0.05, Student’s t-test). (h) Effect of housing in SE and EE before (EE, for 5 weeks) or after tumour transplantation (post-EE, for 17 days) on tumour volume (all mice analysed 17 days after tumour transplantation). Data are from at least five mice per group. **P<0.01, Student’s t-test.
Figure 2
Figure 2. EE modulates tumour microenvironment.
(a) The mean (±s.e.m.) area of BrdU+ cells in tumour area (as % of the tumour area) at 17 days after tagRFP-GL261 implantation in mice housed in SE or EE, as indicated (*P<0.05; Student’s t-test; n=4 mice per condition). Representative immunofluorescence of proliferating BrdU+ cells (green) under the two experimental conditions are shown on the right. Red: tagRFP-GL261 cells. (b) The mean (±s.e.m.) area of GFAP+ cells (as % of the tumour area, *P<0.05, Student’s t-test, n=4 mice per condition) 17 days after tagRFP-GL261 transplantation in mice housed in SE or EE, as indicated. Representative immunofluorescences of astrogliosis, seen as GFAP+ cells (green) are shown on the right for the two experimental conditions. Red: tagRFP-GL261 cells. (c,d) The mean (±s.e.m.) area of F4/80+ (c) and CD68+ (d) cells (as % of the tumour area, n=3–4 mice per condition) 17 days after GL261 transplantation in mice housed in SE or EE, as indicated. Right: representative immunofluorescences of M/Mφ glioma infiltration (c, F4/80 in red) and activation (d, CD68 in green, *P<0.05 Student’s t-test) 17 days after GL261 transplantation. Nuclei are evidenced with Hoechst (blu). (e) The mean number (±s.e.m.) of glioma cells invading the brain parenchyma for more than 150 μm beyond tumour border 17 days after glioma cell transplantation in SE or EE (n=4 mice per condition; *P<0.05 Student’s t-test). Right: representative coronal brain sections stained with haematoxylin/eosin. Black arrows indicate glioma cells invading the brain parenchyma beyond the main tumour border (dashed line) for more than 150 μm. For all the panels: scale bars, 10 μm.
Figure 3
Figure 3. EE increases NK cell infiltration in the tumour area.
(a) CD45+ cells increased in the tumour area of EE-housed mice (n=4; *P<0.05 Student’s t-test). Representative immunofluorescence is shown on the right, at low (× 4, top, scale bar 1 mm) and high (× 20, bottom, scale bar 0.1 mm also for b and c) magnification. (b) CD69+ cells increased in the tumour area of EE-housed mice (n=4; **P<0.01 Student’s t-test). Representative immunofluorescence is shown on the right. (c) Analysis of NK1.1 cell infiltration in tumour, expressed as % NK1.1+ cells in the tumour area (±s.e.m.; *P<0.05 Student’s t-test; n=3–4 mice per condition). Representative immunofluorescence of NK1.1+ cells (green) 17 days after glioma-cell transplantation in mice housed in SE or EE are shown on the right. (d) CD3/NK1.1+cells increased in the brain hemisphere injected with glioma on housing in EE (n=6; *P<0.05 Student’s t-test). Representative FACS analysis of CD3/NK1.1+ cells is shown on the right. (e) Percentage of CD69+ cells in the CD3/NK1.1+ cell population obtained from the brain of SE or EE mice (n=6; *P<0.05, Student’s t-test). Representative FACS analyses are shown below. (f) Mean fluorescence intensity (MFI) of CD69 staining in CD3/NK1.1+ cell population obtained from the brain of SE or EE mice (n=6; *P<0.05, Student’s t-test). (g) Analysis of tumour volume (expressed as mm3±s.e.m.) in vehicle and NK1.1 Ab-treated mice, housed in SE or EE; n=5; *P<0.05, two-way ANOVA). (h) Kaplan–Meier curve of glioma-transplanted mice exposed to SE or EE on NK1.1 Ab treatment; n=5; log-rank test **P<0.01.
Figure 4
Figure 4. IL-15 administration impairs glioma growth and increases NK cell infiltration.
(a) Effects on tumour volume of IL-15 or vehicle infusion into the striatal region of the glioma-injected hemisphere in SE mice, administrated as described in the scheme on top. Brains were analysed 17 days after glioma transplantation. Graph bars illustrate the mean tumour volume (±s.e.m.; n=4 mice per condition). (b) Effects of intrastriatal infusion of vehicle or IL-15 with micro-osmotic pumps starting 10 days after glioma cell transplantation and for 7 days, in SE mice, as described on top (mean tumour volume±s.e.m.; *P<0.05 Student’s t-test; n=4–6 mice per condition). (c,d) NK cell infiltration (c, NK1.1) and activation (d, CD69) in the glioma of mice treated with vehicle or IL-15, with the protocol shown in b. Graph bars represent the mean area (±s.e.m.) as percentage of total tumour area. Representative immunofluorescences are shown on the right (scale bar, 100μm. **P<0.01 Student’s t-test; n=3–4 mice per condition).
Figure 5
Figure 5. BDNF administration impairs glioma growth and reduces M/Mφ infiltration and activation.
(a) Effects of BDNF (or vehicle) infusion into the ipsilateral striatum on tumour volume of SE mice, administrated as shown in the scheme on top. Data are shown as tumour volume (in mm3)±s.e.m.; *P<0.05, Student’s t-test; n=4 mice per condition. (b) Effects of intrastriatal infusion of vehicle or BDNF with micro-osmotic pumps starting 10 days after glioma cell transplantation and for 7 days, in SE mice, as described on top. Graph bars illustrate the mean tumour volume in mm3 (±s.e.m.; **P<0.01 Student’s t-test; n=4–6 mice per condition). (ce) M/Mφ activation (c, CD68) and infiltration (d, F4/80) in the glioma of mice treated with BDNF or vehicle, as shown in b, at the end of treatment (17 days from glioma transplantation); (e) merged images of F4/80 and CD68 staining. Graph bars represent the mean (±s.e.m.) area as percentage of total tumour area. Representative immunofluorescences are shown on the right (scale bar, 100μm. *P<0.05 Student’s t-test; n=3–4 mice per condition). (f) Phagocytic activity of microglia co-cultured or not for 24 h with GL261 in the presence or in the absence of BDNF (100 ng ml−1). LPS (500 ng ml−1) was used as positive control. Results are expressed as % of phagocytizing cells, considering positive only cells with more than four FluoSpheres in the cytoplasm (n=5; *P<0.05; **P<0.01 one-way ANOVA). (g) Microglia chemotaxis towards the control medium (C), BDNF (100 ng ml−1) or GL261-conditioned medium (CM) in the presence or absence of BDNF, for 18 h. Control for a direct effect of BDNF/CM was performed by assaying chemotaxis towards GL261 CM supplemented with BDNF only during the chemotaxis assay. Results are expressed as fold increases in comparison with C (n=5; *P<0.05, **P<0.01 one-way ANOVA).
Figure 6
Figure 6. BDNF impairs glioma cell motility in vitro by the activation of TrkB-T1.
(a) RT–PCR (left) and western blot (right) analyses of TrkB isoform expression in GL261 and the mouse brain. (b) Proposed model to illustrate TrkB.T1 signalling on BDNF binding, impairing RhoA activation and cell migration. (c) Analysis of active RhoA in GL261 glioma cells on BDNF (100 ng ml−1) and/or EGF (100 ng ml−1) stimulation (5 min). Representative experiment is shown on the left. Data were normalized to total RhoA and expressed as percentage of untreated cells (C; n=4; *P<0.05 one-way ANOVA). (d) GL261 cell chemotaxis (18 h) towards BDNF (100 ng ml−1) and/or EGF (100 ng ml−1). Chemotaxis is expressed as the fold increase in comparison with C (n=5; **P<0.01 one-way ANOVA).
Figure 7
Figure 7. Model of EE-induced mechanisms impairing glioma growth through BDNF and IL-15.
Housing in EE induced brain increase of IL-15 and BDNF. IL-15 modulates NK cell accumulation and activation in the brain. BDNF has direct effects on the glioma, impairing chemotaxis, and indirect effects on M/Mφ, reducing cell infiltration in the brain parenchyma and phagocytic activity. All these effects contribute to reducing glioma growth in the mouse brain. See discussion for details.

Similar articles

Cited by

References

    1. Nithianantharajah J. & Hannan A. J. The neurobiology of brain and cognitive reserve: mental and physical activity as modulators of brain disorders. Prog. Neurobiol. 89, 369–382 (2009) . - PubMed
    1. Van Praag H., Christie B. R., Senjnowski T. J. & Gage F. H. Running enhances neurogenesis, learning, and long-term potentiation in mice. Proc. Natl Acad. Sci. USA 96, 13427–13431 (1999) . - PMC - PubMed
    1. Sale A., Berardi N. & Maffei L. Environment and brain plasticity: towards an endogenous pharmacotherapy. Physiol. Rev. 94, 189–234 (2014) . - PubMed
    1. Cao L. et al.. Environmental and genetic activation of a brain-adipocyte BDNF/leptin axis causes cancer remission and inhibition. Cell 142, 52–64 (2010) . - PMC - PubMed
    1. Nachat-Kappes R. et al.. Effects of enriched environment on COX-2, leptin and eicosanoids in a mouse model of breast cancer. PLoS ONE 7, e51525 (2012) . - PMC - PubMed

Publication types

MeSH terms

LinkOut - more resources