

The in vivo dynamics of antigenic variation in Trypanosoma brucei
- PMID: 25814582
- PMCID: PMC4514441
- DOI: 10.1126/science.aaa4502
The in vivo dynamics of antigenic variation in Trypanosoma brucei
Abstract
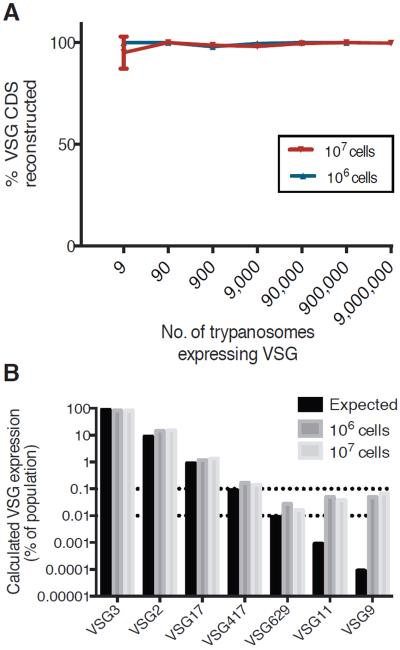
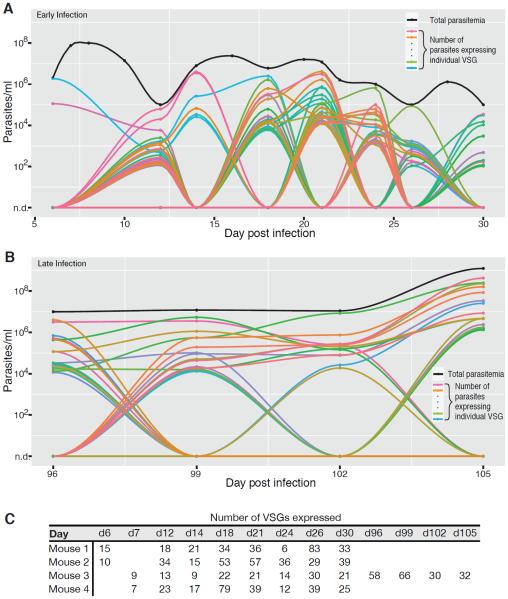
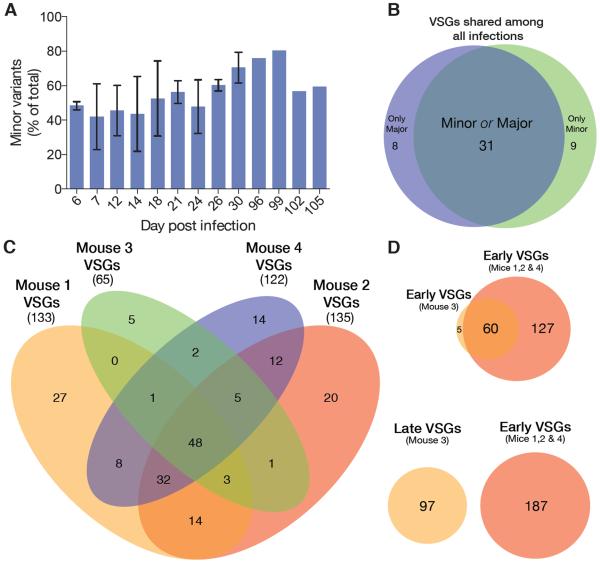
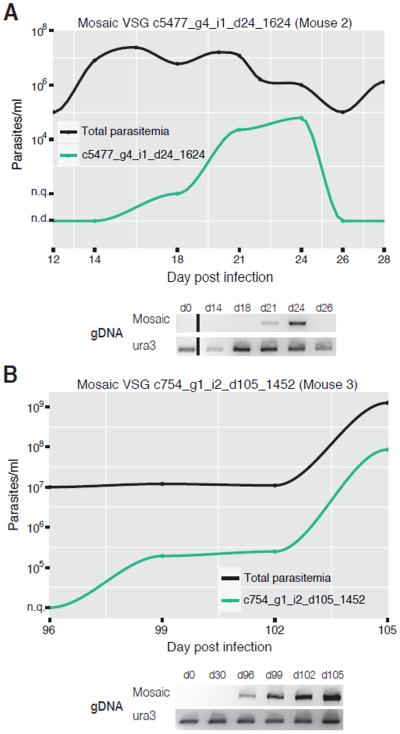
Trypanosoma brucei, a causative agent of African Sleeping Sickness, constantly changes its dense variant surface glycoprotein (VSG) coat to avoid elimination by the immune system of its mammalian host, using an extensive repertoire of dedicated genes. However, the dynamics of VSG expression in T. brucei during an infection are poorly understood. We have developed a method, based on de novo assembly of VSGs, for quantitatively examining the diversity of expressed VSGs in any population of trypanosomes and monitored VSG population dynamics in vivo. Our experiments revealed unexpected diversity within parasite populations and a mechanism for diversifying the genome-encoded VSG repertoire. The interaction between T. brucei and its host is substantially more dynamic and nuanced than previously expected.
Copyright © 2015, American Association for the Advancement of Science.
Figures
Similar articles
-
A Host-Pathogen Interaction Reduced to First Principles: Antigenic Variation in T. brucei.Results Probl Cell Differ. 2015;57:23-46. doi: 10.1007/978-3-319-20819-0_2. Results Probl Cell Differ. 2015. PMID: 26537376 Review.
-
Application of long read sequencing to determine expressed antigen diversity in Trypanosoma brucei infections.PLoS Negl Trop Dis. 2019 Apr 3;13(4):e0007262. doi: 10.1371/journal.pntd.0007262. eCollection 2019 Apr. PLoS Negl Trop Dis. 2019. PMID: 30943202 Free PMC article.
-
VSGs Expressed during Natural T. b. gambiense Infection Exhibit Extensive Sequence Divergence and a Subspecies-Specific Bias towards Type B N-Terminal Domains.mBio. 2022 Dec 20;13(6):e0255322. doi: 10.1128/mbio.02553-22. Epub 2022 Nov 10. mBio. 2022. PMID: 36354333 Free PMC article.
-
Variant surface glycoprotein density defines an immune evasion threshold for African trypanosomes undergoing antigenic variation.Nat Commun. 2017 Oct 10;8(1):828. doi: 10.1038/s41467-017-00959-w. Nat Commun. 2017. PMID: 29018220 Free PMC article.
-
Antigenic variation during the developmental cycle of Trypanosoma brucei.J Protozool. 1984 Feb;31(1):41-7. J Protozool. 1984. PMID: 6204043 Review.
Cited by
-
DNA damage drives antigen diversification through mosaic Variant Surface Glycoprotein (VSG) formation in Trypanosoma brucei.bioRxiv [Preprint]. 2024 Aug 30:2024.03.22.582209. doi: 10.1101/2024.03.22.582209. bioRxiv. 2024. PMID: 39253459 Free PMC article. Preprint.
-
The VEXing problem of monoallelic expression in the African trypanosome.Proc Natl Acad Sci U S A. 2016 Jun 28;113(26):7017-9. doi: 10.1073/pnas.1608546113. Epub 2016 Jun 17. Proc Natl Acad Sci U S A. 2016. PMID: 27317742 Free PMC article. No abstract available.
-
Emerging challenges in understanding trypanosome antigenic variation.Emerg Top Life Sci. 2017 Dec 22;1(6):585-592. doi: 10.1042/ETLS20170104. Emerg Top Life Sci. 2017. PMID: 30271884 Free PMC article.
-
Effector variation at tandem gene arrays in tissue-dwelling coccidia: who needs antigenic variation anyway?Curr Opin Microbiol. 2018 Dec;46:86-92. doi: 10.1016/j.mib.2018.09.001. Epub 2018 Oct 11. Curr Opin Microbiol. 2018. PMID: 30317151 Free PMC article. Review.
-
A quorum sensing-independent path to stumpy development in Trypanosoma brucei.PLoS Pathog. 2017 Apr 10;13(4):e1006324. doi: 10.1371/journal.ppat.1006324. eCollection 2017 Apr. PLoS Pathog. 2017. PMID: 28394929 Free PMC article.
References
-
- Cross GAM, Kim HS, Wickstead B. Capturing the variant surface glycoprotein repertoire (the VSGnome) of Trypanosoma brucei Lister 427. Mol Biochem Parasitol. 2014;195:59–73. - PubMed
-
- Ross R, Thomson D. A Case of Sleeping Sickness Studied by Precise Enumerative Methods: Regular Periodical Increase of the Parasites Disclosed. Proceedings of the Royal Society B: Biological Sciences. 1910;82:411–415.
-
- Turner CM, Barry JD. High frequency of antigenic variation in Trypanosoma brucei rhodesiense infections. Parasitology. 1989;99(Pt 1):67–75. - PubMed
-
- Turner CM. The rate of antigenic variation in fly-transmitted and syringe-passaged infections of Trypanosoma brucei. FEMS Microbiol Lett. 1997;153:227–231. - PubMed
Publication types
MeSH terms
Substances
Associated data
Grants and funding
LinkOut - more resources
Full Text Sources
Other Literature Sources
