. 2015 Mar 25;35(12):4903-16.
doi: 10.1523/JNEUROSCI.3081-14.2015.

Spatially heterogeneous choroid plexus transcriptomes encode positional identity and contribute to regional CSF production

Affiliations

Spatially heterogeneous choroid plexus transcriptomes encode positional identity and contribute to regional CSF production

Melody P Lun et al. J Neurosci. .

Erratum in

  • J Neurosci. 2015 Jun 3;35(22):8686. Adelita, Tai [corrected to Adelita, Tais]

Abstract

A sheet of choroid plexus epithelial cells extends into each cerebral ventricle and secretes signaling factors into the CSF. To evaluate whether differences in the CSF proteome across ventricles arise, in part, from regional differences in choroid plexus gene expression, we defined the transcriptome of lateral ventricle (telencephalic) versus fourth ventricle (hindbrain) choroid plexus. We find that positional identities of mouse, macaque, and human choroid plexi derive from gene expression domains that parallel their axial tissues of origin. We then show that molecular heterogeneity between telencephalic and hindbrain choroid plexi contributes to region-specific, age-dependent protein secretion in vitro. Transcriptome analysis of FACS-purified choroid plexus epithelial cells also predicts their cell-type-specific secretome. Spatial domains with distinct protein expression profiles were observed within each choroid plexus. We propose that regional differences between choroid plexi contribute to dynamic signaling gradients across the mammalian cerebroventricular system.

Keywords: cerebrospinal fluid; choroid plexus; next-generation sequencing.


Figures

Figure 1.
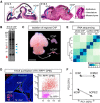
Figure 1.
Next-generation mRNA sequencing reveals regional heterogeneity between telencephalic and hindbrain choroid plexi. A, Left, H&E staining of sagittal E12.5 mouse brain. Right, H&E staining of sagittal E18.5 mouse brain and hChP (inset). Patency of lateral ventricle (LV), third ventricle (3V), and fourth ventricle (4V) changes dramatically with development, and the Aqueduct of Sylvius (Aq) constricts prior to birth. Blue arrows indicate tChP and hChP. Scale bar, 2 mm. High-magnification of hChP in E18.5 (inset) shows ChP structure with epithelial cells enveloping a core of vascular and mesenchymal cells. B, Silver stain of LV and 4V CSF, E18.5 mouse. Although some proteins are present at similar levels in the CSF of both ventricles (black arrowhead), others are more enriched in the CSF of the LV (red arrowhead) or of the 4V (blue arrowhead), suggesting regional differences in CSF protein composition between ventricles despite potential mixing between compartments due to CSF flow. C, Whole tChP and hChP were dissected from wild-type and Ttr::RFP transgenic mice at E18.5. Scale bar, 2 mm. D, ChP from Ttr::RFP mice were dissociated and FACS-sorted to purify the CPECs. Left, Sagittal view of tChP and hChP (inset) from E18.5 Ttr::RFP transgenic mouse. Sections were immunostained with anti-AQP1 (green) and Hoechst (blue), and imaged along with native RFP (red). Right, Representative FACS plot showing the purification of RFP+ CPEC. E, F, RNA was isolated from either whole ChP or purified CPEC from two biological replicates of each (embryonic litters) and processed for RNA sequencing. E, Euclidean distance matrix and clustering dendrogram indicating the correlation across all eight samples. F, PCA of gene expression estimates, with circles representing tChP and triangles representing hChP, and ellipses indicating the 99% confidence interval for the SE of the centroid for each region. Both PCA and clustering indicate that a large proportion of variance (42%) is attributed to tissue type (whole ChP vs purified CPEC), whereas a smaller but highly significant proportion of variance (22%) is due to regional gene expression differences between tChP and hChP, with both effects strongly outweighing the variability between biological replicates.
Figure 2.
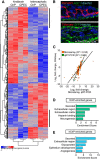
Figure 2.
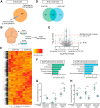
Transcriptional heterogeneity reveals regional choroid plexus identity. A, Hierarchical clustering of all ∼2500 genes showing significant regional differential expression between hChP (1426 genes) and tChP (1102 genes) at FDR < 0.05. Among these, 684 genes showed at least a two-fold regional enrichment. Red and blue indicate relatively higher and lower expression, with genes independently scaled to a mean of zero and 1 SD for display purposes. Vertical bars at the right of the heatmap highlight clusters of epithelial cell-specific or -enhanced regional expression differences. B, Top, Section from E18.5 mouse immunostained with anti-PECAM1 (red), anti-AQP1 (green), and Hoechst (blue). PECAM1 expression was enriched in the vascular component of the ChP. Bottom, Section from E16.5 mT/mG/FoxJ1Cre+/− reporter mice, which show recombination (GFP-positive staining cells) in nearly all ChP epithelial cells, were immunostained with anti-GFP (green) and Hoechst (blue). FOXJ1 expression was enriched in purified ChP epithelial cells. C, Linear regression of log2 fold-change in expression values for tChP- and hChP-enriched genes by RNA-seq, compared with gene expression microarray (orange) or qRT-PCR (green) reveals positive correlations in fold-change values between the three technologies, providing high confidence in our RNA-seq sample size, data quality, and analysis. D, E, Gene ontology analysis of tChP- and hChP-enriched genes compared with the reference mouse transcriptome reveals significant overrepresentation of genes encoding putative secreted factors. The top five functional clusters for each ChP are plotted (FDR < 0.05).
Figure 3.
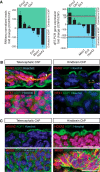
Figure 3.
Transcriptional heterogeneity elucidates distinct positional identities for choroid plexi. A, Left, Cufflinks-estimated RNA-seq FPKM counts from ChP (n = 4) for differentially expressed transcription factors represented as mean fold-change (tChP/hChP) ± SEM (Emx2, 142.67 ± 23.23, t test, p = 0.0009; Six3, 48.61 ± 4.75, t test, p < 0.0001; Otx1, 17.067 ± 2.10, t test, p = 0.0003; En2, −29.69 ± 3.56, t test, p < 0.0001; Meis1, −67.99 ± 7.18, t test, p = 0.0002; HoxA2, −177.50 ± 13.47, t test, p < 0.0001). Right, qRT-PCR validation of differentially expressed transcription factors in whole dissected tChP and hChP from E18.5 mouse represented as mean fold-change (tChP/hChP) ± SEM (Emx2, 205.40 ± 85.98, t test, p < 0.0001; Otx1, 14.36 ± 0.621, t test, p = 0.0061; Six3, 1.993 ± 0.113, t test, p = 0.0085; Meis1, −33.85 ± 9.57, t test, p = 0.0016; En2, −167.34 ± 19.42, t test, p = 0.0011; HoxA2, −1065.464 ± 302.98, t test, p = 0.0308). B, Immunostaining of E16.5 ChP with anti-EMX2 (red, top) and anti-OTX1 (red, bottom) antibodies reveals higher EMX2 and OTX1 expression in tChP than hChP. Also shown: anti-AQP1 (green) staining for apical surface of choroid plexus epithelium and Hoechst (blue). EMX2 staining of the vasculature marked by an arrowhead, weak EMX2 signal detected in hChP, indicated with asterisks. C, Immunostaining of E16.5 ChP with anti-HOXA2 (red, top) and anti-MEIS1 (red, bottom; whole mount ChP) antibodies reveals higher HOXA2 and MEIS1 expression in hChP than tChP. Also shown: anti-AQP1 (green) and Hoechst (blue). Scale bar, 20 μm.
Figure 4.
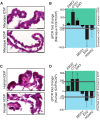
Figure 4.
Positional identities of telencephalic and hindbrain choroid plexi are conserved in macaque and human brain. A, H&E staining of 13-year-old macaque tChP and hChP. Scale bar, 50 μm. B, qRT-PCR validation of transcription factor expression in six samples of macaque tChP and three samples of hChP, including two paired sets of tChP and hChP from the same animal, confirms that positional identity is evolutionarily conserved. Gene expression in macaque tChP and hChP is represented as mean fold-change (tChP/hChP) ± SEM. EMX2, OTX1, and SIX3 expression were enriched in tChP compared with hChP: EMX2, 69.310 ± 15.467, p = 0.019; OTX1, 509.212 ± 54.897, p = 0.0004; SIX3, 179.401 ± 83.648; not detected in 1 of 3 hChPs tested; p = 0.287), whereas MEIS1, EN2, and HOXA2 expression were enriched in hChP compared with tChP: MEIS1, −64.673 ± 9.168, p < 0.0001; EN2, −666.360 ± 586.365, p < 0.0001; HOXA2, −269.846 ± 269.145, p = 0.171. C, H&E staining of 36-year-old human tChP and hChP. Scale bar, 50 μm. D, qRT-PCR validation of transcription factor expression in human tChP and hChP confirms that positional identity is conserved among primates. Gene expression in human tChP and hChP (n = 5, paired samples) is represented as mean fold-change (tChP/hChP) ± SEM: EMX2, 5.540 ± 2.953, p = 0.0007; OTX1, 308.947 ± 294.251, p < 0.0001; SIX3, 312.103 ± 242.809, p < 0.0001; MEIS1, −9.070 ± 5.420, p = 0.174; EN2, −150.898 ± 95.988, p = 0.157; HOXA2, −113.994 ± 100.118, p = 0.292.
Figure 5.
Figure 5.
Mass spectrometry reveals distinct proteomes between telencephalic and hindbrain choroid plexus-conditioned media. A, Schematic representing mass spectrometry analysis of E18.5 mouse native CSF compared with E18.5 mouse ChP transcriptome. A total of 598 proteins were identified in E18.5 mouse CSF, and 33 of these proteins did not have their corresponding transcript detected in the E18.5 ChP transcriptome. B, Schematic illustrating approach for preparing ChP-conditioned medium for MS analyses. C, Heatmap of normalized spectral counts reveals differential protein availability in replicates of conditioned media obtained from pooled biological samples of conditioned media from tChP (n = 3) and hChP (n = 2). Each conditioned medium sample was run in duplicate, as represented by each lane in the heatmap (tChP, 6 technical runs; hChP, 4 technical runs). Spectral counts were centered and scaled across each row (protein) for display purposes. Red and yellow indicate relatively higher and lower number of spectral counts respectively. D, Schematic representing the numbers of proteins identified as shared and region-specific between conditions analyzed in C. E, Volcano plot showing distribution of proteins obtained by plotting log2(fold-change tChP/hChP) versus −log10(p value from two-tailed t test) of the averages of normalized spectral counts from sample replicates analyzed in C. Blue vertical lines: 2- and 0.5-fold cutoffs. Red horizontal lines: Log2 of Bonferroni-corrected p value cutoff [log2(0.05/1388) = 4.33], log2 of uncorrected p value cutoff [log2(0.05) = 1.3]. F, Functional clustering of differentially expressed proteins identified by MS with fold-change ≥1.5, p = 0.05 (tChP-enriched proteins = 57; hChP-enriched proteins = 137). The top five enriched functional clusters are shown (FDR < 0.05). G, Spectral counts show more abundant availability of ALDH1A2 and ALDH1L1 in hChP-conditioned medium (blue circles) than tChP-conditioned medium (green circles; hChP ALDH1A2 = 3.827 ± 0.346, tChP ALDH1A2 = not detected, t test, p = 0.002; hChP ALDH1L1 = 3.312 ± 1.020, tChP ALDH1L1 = 0.190 ± 0.190, t test, p = 0.046). A similar trend is observed for RBP1 (hChP RBP1 = 10.926 ± 1.096, tChP RBP1 = 7.038 ± 0.797, t test, p = 0.101). Differential expression of these proteins corresponds to similar trends at the transcript level as detected by RNA-seq (mean normalized read counts from DESeq ± SEM; Aldh1a2, hChP = 248.188 ± 125.197, tChP = 13.381 ± 5.824, FDR = 0.260; Aldh1l1, hChP = 236.645 ± 37.892, tChP = 93.027 ± 17.053, FDR = 0.029; Rbp1, hChP = 6811.561 ± 465.403, tChP = 3590.211 ± 151.407, FDR = 0.001). Graphed points represent individual replicates obtained from pooled samples of ChP-conditioned medium. Statistical analyses were performed on pooled samples of ChP-conditioned medium. Dotted line denotes mean. H, Spectral counts show more abundant availability of Cystatin C (CSTC), Cathepsin B (CTSB), and Cathpsin D (CTSD) in tChP-conditioned medium than hChP-conditioned medium (tChP CSTC = 4.466 ± 0.452, hChP CSTC = 2.441 ± 0.208, t test, p = 0.018; tChP CTSB = 4.698 ± 0.576; hChP CTSB = 2.356 ± 0.424, t test, p = 0.006; tChP CTSD = 6.904 ± 0.606, hChP CTSD = 3.286 ± 0.168, t test, p = 0.010). Data graphed and analyzed as described in G.
Figure 6.
Figure 6.
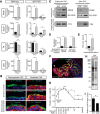
Differential protein expression and secretion between telencephalic and hindbrain choroid plexi establish anterior–posterior gradients in an age-dependent manner. A, Left, RNA-seq normalized read counts from DESeq analysis (Penk: tChP = 170.21 ± 296.22, hChP = 11132.09 ± 1815.991, FDR = 3.26 × 10⁻¹⁹; Sod3: tChP = 260.48 ± 85.500, hChP = 1039.99 ± 96.738, FDR = 4.55 × 10⁻¹²; Ttr: tChP = 4455,127.72 ± 514,497.268, hChP = 3239,035.52 ± 322,273.113, FDR = 3.42 × 10−01; Shh: tChP = 3.93 ± 2.097, hChP = 229.19 ± 40.774, FDR = 1.55 × 10⁻¹³). Right, qRT-PCR validation of differentially expressed genes Penk, Sod3, Shh, and similarly expressed gene Ttr at E18.5 represented as mean ± SEM, with tChP expression = 1.00. (Penk tChP, 1.00, Penk hChP, 78.75 ± 9.65, n = 4, t test, p = 0.0002; Sod3 tChP, 1.00, Sod3 hChP, 5.20 ± 1.46, n = 4, t test, p = 0.035; Ttr tChP, 1.00, Ttr hChP, 0.90 ± 0.04, n = 4, t test, p = 0.074; Shh tChP, 1.00, Shh hChP, 198.55 ± 50.53, n = 4, t test, p = 0.008; Table 2). qRT-PCR analyses in adult ChP demonstrates overall downregulation of Penk, Sod3, Ttr, and Shh gene expression. Additional comparisons between tChP and hChP in adults reveals that Penk is more abundantly expressed in adult tChP than hChP, the pattern of differential Sod3 expression between adult tChP and hChP is maintained, and Ttr is more abundantly expressed by adult hChP than tChP. Adult fold expression is represented as mean ± SEM, with E18.5 tChP expression = 1.00. (Adult Penk tChP, 4.824 ± 1.194, Adult Penk hChP, 0.818 ± 0.312, n = 3, t test, p = 0.031; Adult Sod3 tChP, 0.996 ± 0.134, Adult Sod3 hChP, 2.940 ± 0.362, n = 3, t test, p = 0.007; Adult Ttr tChP, 0.147 ± 0.012, Adult Ttr hChP, 0.249 ± 0.005, n = 3, t test, p = 0.001; Adult Shh tChP, 0.010 ± 0.004, Shh hChP, 0.018 ± 0.002, n = 5, t test, p = 0.130). B, Immunostaining of E16.5 ChP with anti-PENK, anti-EC-SOD, anti-TTR, anti-AQP1, and Hoechst. Top, Expression of PENK (red) was enriched in hChP epithelium. Middle, Expression of EC-SOD (red) was enriched in hChP epithelium. Bottom, Expression of TTR (red) was similar in tChP and hChP epithelia. C, Left, E16.5 mouse tChP and hChP were cultured for 24 h in equal volumes of base medium per ChP. Equal volumes of ChP-conditioned medium were immunoblotted with antibodies for PENK, EC-SOD, and TTR. Secretion of PENK and EC-SOD was greater by hChP than tChP. Secretion of TTR was similar between tChP and hChP. Right, Adult mouse tChP and hChP were cultured and analyzed as described above. Secretion of PENK was greater by tChP than hChP, secretion of EC-SOD was greater by adult hChP than tChP, and secretion of TTR was greater by adult hChP than tChP. D, Quantification of embryonic PENK and EC-SOD immunoblots normalized to TTR, shown in C. Data are represented as mean ± SEM (PENK tChP = 0.167 ± 0.056; hChP = 1.0, n = 4, t test, p < 0.0001; EC-SOD tChP = 0.146 ± 0.073; hChP = 1.0, n = 3, t test, p < 0.001). E, E14.5 mouse tChP and hChP were cultured for 24 h in equal volumes of base medium per ChP. Equal volumes of ChP-conditioned medium were measured for Shh concentration by ELISA, represented as mean concentration (pg/ml) ± SEM (tChP = 11.58 ± 0.65, hChP = 56.83 ± 16.79; n = 3, t test, p = 0.027). F, Immunostaining of hChP with anti-EC-SOD reveals cellular gradient of enriched expression. Section taken at level of gestational day 18 sagittal plate 10 from Prenatal Mouse Brain Atlas (Schambra, 2008). Arrowhead indicates region of enhanced EC-SOD expression along the ventral region of the hChP. Asterisks mark ChP vasculature. Double-headed arrow orients along dorsal (D)–ventral (V) axis. Scale bar, 100 μm. G, Total CSF protein concentration over the course of mouse embryonic and postnatal development represented as mean ± SEM (E10.5, 1.8 ± 0.09, n = 6; E12.5, 2.67 ± 0.08, n = 7; E14.5, 2.97 ± 0.06, n = 4; E16.5, 3.15 ± 0.16, n = 6; E18.5/P0, 3.01 ± 0.18, n = 7; P2, 2.48 ± 0.14, n = 3; P7, 1.37 ± 0.06, n = 6; adult, 1.37 ± 0.12, n = 3). CSF protein concentration increases following development of choroid plexi at E11–E12 (indicated by arrow; E10.5 vs E12.5, t test, p = 0.00003; E12.5 vs E14.5, t test, p = 0.031), declines postnatally (P2 vs P7, t test, p = 0.00004; and remains stable between P7 and adulthood, t test, p = 0.984). H, Silver stain of 1 μl of E17 and adult rat CSF. Total CSF protein complexity decreases in adulthood. I, Relative SOD activity decreases in rat CSF with age (E17 CSF, 11.3 ± 0.7; Adult CSF, 7.1 ± 0.1; n = 3, t test, p < 0.05).

Similar articles

Cited by

References

    1. Anders S, Huber W. Differential expression analysis for sequence count data. Genome Biol. 2010;11:R106. doi: 10.1186/gb-2010-11-10-r106. - DOI - PMC - PubMed
    1. Anders S, McCarthy DJ, Chen Y, Okoniewski M, Smyth GK, Huber W, Robinson MD. Count-based differential expression analysis of RNA sequencing data using R and bioconductor. Nat Protoc. 2013;8:1765–1786. doi: 10.1038/nprot.2013.099. - DOI - PubMed
    1. Awatramani R, Soriano P, Rodriguez C, Mai JJ, Dymecki SM. Cryptic boundaries in roof plate and choroid plexus identified by intersectional gene activation. Nat Genet. 2003;35:70–75. doi: 10.1038/ng1228. - DOI - PubMed
    1. Bateman RJ, Munsell LY, Morris JC, Swarm R, Yarasheski KE, Holtzman DM. Human amyloid-beta synthesis and clearance rates as measured in cerebrospinal fluid in vivo. Nat Med. 2006;12:856–861. doi: 10.1038/nm1438. - DOI - PMC - PubMed
    1. Brinker T, Stopa E, Morrison J, Klinge P. A new look at cerebrospinal fluid circulation. Fluids Barriers CNS. 2014;11:10. doi: 10.1186/2045-8118-11-10. - DOI - PMC - PubMed

Publication types