. 2015 Oct;230(10):2533-42.
doi: 10.1002/jcp.24990.

Cell cycle gene expression networks discovered using systems biology: Significance in carcinogenesis

Affiliations

Cell cycle gene expression networks discovered using systems biology: Significance in carcinogenesis

Robert E Scott et al. J Cell Physiol. 2015 Oct.

Abstract

The early stages of carcinogenesis are linked to defects in the cell cycle. A series of cell cycle checkpoints are involved in this process. The G1/S checkpoint that serves to integrate the control of cell proliferation and differentiation is linked to carcinogenesis and the mitotic spindle checkpoint is associated with the development of chromosomal instability. This paper presents the outcome of systems biology studies designed to evaluate if networks of covariate cell cycle gene transcripts exist in proliferative mammalian tissues including mice, rats, and humans. The GeneNetwork website that contains numerous gene expression datasets from different species, sexes, and tissues represents the foundational resource for these studies (www.genenetwork.org). In addition, WebGestalt, a gene ontology tool, facilitated the identification of expression networks of genes that co-vary with key cell cycle targets, especially Cdc20 and Plk1 (www.bioinfo.vanderbilt.edu/webgestalt). Cell cycle expression networks of such covariate mRNAs exist in multiple proliferative tissues including liver, lung, pituitary, adipose, and lymphoid tissues among others but not in brain or retina that have low proliferative potential. Sixty-three covariate cell cycle gene transcripts (mRNAs) compose the average cell cycle network with P = e(-13) to e(-36) . Cell cycle expression networks show species, sex and tissue variability, and they are enriched in mRNA transcripts associated with mitosis, many of which are associated with chromosomal instability.


Conflict of interest statement

No Conflict of Interest

Figures

Figure 1
Figure 1. BXD female mouse liver
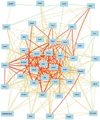
Cell cycle expression network for Cdc20 covariates with correlation coefficients >0.50. The 75 cell cycle mRNAs that comprise this network are: Cdc20, Lig1, Ube2c, Mapre3, Cdca8, Casc5, 9930021A08Rik (Ubr2), Fancm, Sgol2, Jtb, Ptp4a1, 2410004L17Rik (Esco2), Pkmyt1, Sgol1, Mcm5, Cryaa, Psrc1, Ccng2, Chtf18, 5830426I05Rik (Ncapg2), Ska3, 1500003O22Rik (Rrp8), Melk, Plk1, Mastl, Birc5, Cdca5, Nek2, Rec8, Sept9, 4930563F16Rik (Dixdc1), Ncapg, Trip13, Aurkb, Ncapd2, Cenpe, Mcm2, Sept5, Kif20b, Npm1, BC027246 (Rfwd3), 1700022L09Rik (Dsn1), Cit, Ccnb2, Incenp, Spag5, Cdc25c, Cdkn1c, BC025462 (Fanci), Zwilch, Ccna2, Mcm7, Mki67, Stmn1, Nuf2, Ect2, Cdk1, Anapc2, Uhrf1, Ckap2, Aurka, Cenpf, Nusap1, Zfp318, Prc1, Plk4, Cenph, Ccnb1, Tpx2, Cdca2, Fignl1, Racgap1, Ptpn6, Pml, and 7330406P05Rik (Appl1). In the following network graph and in subsequent graphs, the various mRNA transcripts of the network can show an either positive (red and orange) or negative (blue and green) covariance. Correlation coefficients for these cell cycle gene transcript interactions are: red + >0.7, orange + >0.5 and blue - >0.7, green - >0.5.
Figure 2
Figure 2. BXD male mouse liver
Cell cycle expression network for Cdc20 covariates with correlation coefficients >0.50. The 44 cell cycle mRNAs that comprise this network are: Cdc20, Ube2c, Ccnb2, Spag5, 120008O12Rik (Cep55), Cdca8, Cdc25c, D1Ertd8e (Sgol2), Ccna2, Cul4a, Mki67, Stmn1, Nuf2, Sgol1, Mcm5, Ect2, Cdc2a (Cdk1), Psrc1, Uhrf1, Asz1, Aurka, Cenpf, Nusap1, Plk1, Prc1, Rbl1, Dscc1, Plk4, Birc5, Cdca5, Nek2, Tpx2, Cenph, Ncapg, Fignl1, Aurkb, Mcm4, Cenpe, Racgap1, Mcm2, Fem1b, Kif20b (Mphosh1), Cyp26b1, and Sept11.
Figure 3
Figure 3. BHHBF2 male mouse liver
Cell cycle expression network for Cdc20 covariates with correlation coefficients >0.50. The 70 cell cycle mRNAs that comprise this network are: Cdc20, Lig1, Exo1, Cep192, Ube2c, Cdca8, Casc5, Sgol2, Pkmyt1, Sgol1, Psrc1, Mcm6, Chtf18, Tacc3, Kntc2 (Ndc80), Melk, Plk1, Anin, Rad51, Aspm, Kif2c, Cdca5, Birc5, Nek2, Ncapg, Trip13, Ncapd2, 2810433K01Rik (Ska1), Cenpe, Mcm2, Mphosph1 (Kif20b), Cdcc99, 3000004O01Rik (Kif18b), 1700022L09Rik (Dsn1), Clspn, E2f1, Ccnb2, Kif11, BC025462 (Fanci), Ccna2, Zwilch, Mki67, Stmn1, Nuf2, Ect2, Cdc2a (Cdk1), 2310007D09Rik (Fam83d), Uhrf1, Ckap2, Aurka, Prkce, D3Ertd750e, 2610040C18Rik (Apitd1), Erc6l, Nusap1, Cdc7, Mad2l1, Bccip, UNg2 (Ccno), Mx1, Cdca3, Ccnb1, Fignl1, Racgap1, Anapc5, Cenpa, 1700007E06Rik (Syce3), Dbf4, Espl1, and Fgf10.
Figure 4
Figure 4. Mouse Diversity Panel Liver
Cell cycle expression network for Plk1 covariates with correlation coefficients >0.50. The 29 cell cycle mRNAs that comprise this network are: Plk1, Lig1, Pard6g, Nusap1, Cenpf, Exo1, Cdc20, 2600017H08Rik (Spc25), Prc1, Ube2c, Spag5, Kif2c, Cdca8, Cdc25c, Cdca5, Birc5, Tgfa, Ccna2, Tpx2, Mki67, Gpsm2, 241994I17Rik (Esco2), Nuf2, Sgol1, Aurkb, Cenpe, Cdk1, Hmg20b, and Mcm6.
Figure 5
Figure 5. Rat HXBBXH Liver
Cell cycle expression network for Cdc20 covariates with correlation coefficients >0.50. The 93 cell cycle mRNAs that comprise this network are: Cdc20, Apbb2, Aspm, Cdkn2c, Cdkn3, Cdt1, Cenpk, Cenpm, Aurka, Aurkb, BG377427 (Cenpf), Pim3, Plk1, Plk3, Bric5, Brca2, Bub1, Ccdc5, Ccdc99, Ccnb2, Mcm7, Mdc1, Melk, Mki67, Ccnd1, Cdc16, Cdc2, Ckap2, Cks2, Clk4, Dact1, Digap5, Dscc1, Rrm2, Smc2, Sox4, Spag5, Dynlt1, E2f1, Ect2, Espl1, Ezh2, Fancd2, Foxm1, Lig1, Mad2l1, Map4, Mcm2, Gadd45g, Gmnn, Hmgb2, Itgb3bp, Kif11, Kif20b, Kif23, Kif2c, Kifc1, LOC689399 (Cenpw), Mcm4, Mcm5, Mcm6, Mphosph10, Myc, Ncaph, Cdc45l, Cdca2, Nuf2, Nusap1, Prc1, Pttg1, Racgap1, Rad51, Ddx11, Dgkz, Rassf4, Rbl1, Spc25, Tacc3, Taf1, Top2a, Ccna2, Ccnb1, Traf4af1, Trip13, Tsc2, Ube2c, Ufd1l, Cdc37, Cdca3, Cdca7, Usp2, Znf655, and Zwilch.
Figure 6
Figure 6. BXD lung
Cell cycle expression network for Cdc20 covariates with correlation coefficients >0.50. The 102 cell cycle mRNAs that comprise this network are: Cdc20, C12orf32 (Rhno1), Cdk2, Kif23, Spc25, Ube2c, Cdca8, Cep55, C79407 (Mis18bp1), Sgol2, Gpsm2, Esco2, Sgol1, Mcm5, Chek1, 5830416I05Rik (Ncapg2), Klhl13, Tacc3, Ndc80 (Kntc2), Melk, Slbp, Casp3, E2f7, Plk1, Anin, Mastl, 8430435B07Rik (Gas213), Rad51, Aspm, Kif2c, Gsg2, Birc5, Cdca5, D030034H08 (Iqgap3), Cdc45, Mapre2, 5730507H05Rik (Ncapg), Trip13, Aurkb, 2810433K01Rik (Ska1), Cenpe, Kif20b, Cpeb1, Cdkn3 2600001J17Rik (Ccdc99), 2810047L02Rik (Dtl), Usp2, 3000004C01Rik (Kif18b), Rfwd3, Adam17, Clspn, Ncaph (Brrn1) Ccnb2, Incenp, Spag5, Fbxo5, Cks1b, Kif11, Ccna2, Mki67, Mcm7, Stmn1, Abl1, Cdca1 (Nuf2), Sox4, Ect2, Cdc2a (Cdk1), Smc2, Uhrf1, Rb1cc1, Marveld1, Ckap2, Aurka, D2Ertd750e, Brca1, 4432406C08Rik (E2f8), Ezh2, BC004701 (Ercc61), Mad2l1, Nusap1, Cenpf, Prc1, 2610036L11Rik (Cenpw), Plk4, Wee1, 2410030K01Rik (Spc24), Cdca3, Ccnb1, Tpx2, E2f3, H2afx, Pole, Cdca2, Fignl1, Racgap1, Bub1, Ccnf, Cenpa, Hells, Espl1, Mapk12, and Foxm1.
Figure 7
Figure 7. BXD pituitary
Cell cycle expression network for Cdc20 covariates with correlation coefficients >0.50. The 32 cell cycle mRNAs that comprise this network are: Cdc20, Kif18b, Kif23, Spc25, Ube2c, Ncaph (Brnn1), Ube2s, Cep55, C79407 (Mis18bp1), Sgol2, Mki67, Kntc1, Mcm5, Ect2, Cdk1, Anapc2(Affy_10342641), Aurka, Pmf1, Plk1, Wfs1, Prc1, Katnb1, Digap5, Cdc45, Cdca3, Cenpe, Cdt1, Mcm2, Bub1, Cenpa, Ddb1, and Dtl.
Figure 8
Figure 8. BHHBF2 mouse adipose tissue
a. Cell cycle expression network in females for Cdc20 covariates with correlation coefficients >0.70. The 42 cell cycle mRNAs that comprise this network are: Cdc20, 300004C01Rik (Kif18b), Exo1, Clspn, Cit, Ncaph, Ccnb2, Cdca8, Casc5, Csk2, Sgol2, BC025462 (Facni), Kif11, Ccna2, Mki67, Kntc1, Cdca1 (Nuf2), Sgol1, Cdk1, Psrc1, Uhrf1, Aurka, D2Ertd750e, Tacc3, E2f8, Melk, Plk1, Rad51, Aspm, Cdca5, Birc5, Cdca3, Cenph, Trip13, Fignl1, 2810443K01Rik (Ska1), Cenpe, Racgap1, Kif20b (Mphosph1), Ccdc99, Dbf4, and Espl1. b. Cell cycle expression network in males for Cdc20 covariates with correlation coefficients >0.70. The 42 cell cycle mRNAs that comprise this network are: Cdc20, Exo1, Clspn, Cit, Ccnb2, Cdca8, Csk2, Kif11, BC025462 (Fanci), Ccna2, Sgol1, Aif1, Nuf2 (Cdca1), Mcm5, Psrc1, Cdk1, Mcm6, Uhrf1, Aurka, Tacc3, D2Ertd750e, E2f8, Melk, Plk1, Rad51, Aspm, Cdca5, Birc5, Gmnn, Cdca3, Cenph, Trip13, Fignl1, Mcm4, Cenpe, Racgap1, Mcm2, Cenpa, Ptpn6, Ccdc99, Dbf4 and Espl1.
Figure 9
Figure 9. Human lymphoblasts
Cell cycle expression network of 57 Cdc20 covariates with correlation coefficients >0.50. These mRNAs include: Cdc20, Casp3, Pdcd6ip, Hjurp, Tubb4b, Dynlt3, Cenpf, Cdca8, Tpx2, Smarca4, Kif23, Gsg2, Gpsm2, Kif2c, Spag5, Ckap5, Rcc2, Ccna2, Setd8, Prc1, Kif22, Ppm1a, Kntc1, Cdc25b, Uhrf1, Trip13, Tacc3, Hcfc1, Plk1, Cenpa, Tnfaip3, Rps27l, Kif20a, Aspm, Pbk, Miki67, Cdca2, Kif20b, Pbrm1, Aurkb, Pole, Birc5, Rbl1, Tfdp1, H2afx, Hdac1, Aurka, Cenpe, Ube2s, Nup37, Ube2c, E2f2, Ccnb2, Espl1, Ctbp1, Suv39h1, and Melk.

Similar articles

Cited by

References

    1. Aguilar R, Grandy R, Meza D, Sepulveda H, Pihan P, van Wijnen AJ, Lian JB, Stein GS, Stein JL, Montecino M. A functional N-terminal domain in C/EBPbeta-LAP* is required for interacting with SWI/SNF and to repress Ric-8B gene transcription in osteoblasts. J. Cell. Physiol. 2014;229:1521–1528. - PMC - PubMed
    1. Asghar U, Witkiewicz AK, Turner NC, Knudsen ES. The history and future of targeting cyclin-dependent kinases in cancer therapy. Nat. Rev. Drug Discov. 2015;14:130–146. - PMC - PubMed
    1. Aziz F, van Wijnen aJ, Stein JL, Stein GS. HiNF-D (CDP-cut/CDC2/cyclin A/pRB-complex) influences the timing of IRF-2-dependent cell cycle activation of human histone H4 gene transcription at the G1/S phase transition. J. Cell. Physiol. 1998;177:453–464. doi:10.1002/(SICI)1097-4652(199812)177:3<453::AID-JCP8>3.0.CO;2-F. - PubMed
    1. Bertoli C, Skotheim JM, de Bruin RAM. Control of cell cycle transcription during G1 and S phases. Nat. Rev. Mol. Cell Biol. 2013;14:518–528. - PMC - PubMed
    1. Blagosklonny MV, Pardee AB. The restriction point of the cell cycle. cc. 2002;1:103–110. - PubMed

Publication types

Substances

LinkOut - more resources