. 2015 Mar 30;208(7):913-29.
doi: 10.1083/jcb.201411047. Epub 2015 Mar 23.

YB-1 regulates stress granule formation and tumor progression by translationally activating G3BP1

Affiliations

YB-1 regulates stress granule formation and tumor progression by translationally activating G3BP1

Syam Prakash Somasekharan et al. J Cell Biol. .

Abstract

Under cell stress, global protein synthesis is inhibited to preserve energy. One mechanism is to sequester and silence mRNAs in ribonucleoprotein complexes known as stress granules (SGs), which contain translationally silent mRNAs, preinitiation factors, and RNA-binding proteins. Y-box binding protein 1 (YB-1) localizes to SGs, but its role in SG biology is unknown. We now report that YB-1 directly binds to and translationally activates the 5' untranslated region (UTR) of G3BP1 mRNAs, thereby controlling the availability of the G3BP1 SG nucleator for SG assembly. YB-1 inactivation in human sarcoma cells dramatically reduces G3BP1 and SG formation in vitro. YB-1 and G3BP1 expression are highly correlated in human sarcomas, and elevated G3BP1 expression correlates with poor survival. Finally, G3BP1 down-regulation in sarcoma xenografts prevents in vivo SG formation and tumor invasion, and completely blocks lung metastasis in mouse models. Together, these findings demonstrate a critical role for YB-1 in SG formation through translational activation of G3BP1, and highlight novel functions for SGs in tumor progression.


Figures

Figure 1.
Figure 1.
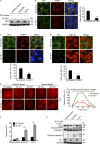
YB-1 kd impairs SG assembly and sensitizes cells to oxidative stress. (A–C) U2OS cells transfected with siControl or siYB-1 siRNAs were treated with vehicle alone, arsenite (0.5 mM), or H2O2 (0.5 mM) for 1 h and immunoblotted using anti–YB-1 or anti-GAPDH antibodies (A). SGs were detected by IF in arsenite- (B) or H2O2-treated (C) siControl or siYB-1 U2OS cells using the indicated antibodies. Slides were counterstained with DRAQ5 to detect nuclei. SGs were quantified using ImageJ software by counting cells containing SGs divided by total cells, and represented by bar graphs. (D) Arsenite (0.5 mM)-treated siControl or siYB-1 U2OS cells were subjected to in situ hybridization using 5-FAM-oligodT and counterstained with anti–YB-1 antibodies. SGs were quantified as in B. (E) U2OS cells transfected with siControl or siYB-1 siRNAs were treated with arsenite (0.5 mM) for 60 min, then placed in full media without arsenite for another 60 min. Cells were fixed at the indicated time points and subjected to IF using anti–TIA-1 antibodies. SGs were quantified as in B. (F) U2OS cells transfected with siControl or siYB-1 siRNAs were treated with arsenite (0.5 mM) or H2O2 (0.5 mM) for 5 h, and apoptosis was measured by Annexin V-FITC flow cytometry. (G) Cell lysates from F were subjected to immunoblotting using the indicated antibodies. Mean values ± SD (error bars) are shown for three independent experiments. *, P < 0.05; **, P < 0.01; ***, P < 0.001. Bars, 10 µm.
Figure 2.
Figure 2.
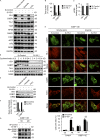
YB-1 regulates G3BP1 mRNA translation. (A) U2OS cells transfected with siControl or siYB-1 siRNAs were treated with vehicle alone, arsenite (0.5 mM), or H2O2 (0.5 mM) for 1 h. Lysates were analyzed by immunoblotting using the indicated antibodies. (B) Band intensities from A were quantified by densitometry. Mean values ± SD (error bars) are shown for three independent experiments. **, P < 0.01. (C) Total RNA isolated from siControl and siYB-1 U2OS cells under ambient conditions was subjected to RT-PCR using primers for YB-1 and G3BP1. Mean values ± SD (error bars) are shown for three independent experiments. ns, nonsignificant. (D) U2OS cells transfected with siControl or siYB-1 siRNAs were incubated with CHX for the indicated times, and lysates were immunoblotted using the indicated antibodies. (E) U2OS cells transfected with siControl or siYB-1 siRNAs were treated with vehicle alone, arsenite (0.5 mM), or H2O2 (0.5 mM) for 1 h in the presence of AHA to capture newly synthesized proteins, and immunoblotted using the indicated antibodies. (F) Band intensities from E were quantified using densitometry. Mean values ± SD (error bars) are shown for three independent experiments. **, P < 0.01. (G) siControl or siYB-1 kd U2OS cells were transfected with Myc-G3BP1 (G3BP1 overexpression [OE]), and treated with vehicle alone (VA) or arsenite (AR; 0.5 mM) for 1 h. Lysates were then prepared and immunoblotted using antibodies against G3BP1, YB-1, and GRB2. (H) The same cells were fixed and subjected to IF using the indicated antibodies. SGs were quantified as in Fig. 1 B. Mean values ± SD (error bars) are shown for three independent experiments. **, P < 0.01. ns, nonsignificant. Bars, 10 µm.
Figure 3.
Figure 3.
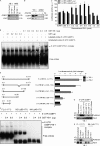
YB-1 regulates G3BP1 translation through the G3BP1 5′ UTR. (A) mRNA transcripts bound to YB-1 were riboimmunoprecipitated (RIPed) using anti–YB-1 antibodies or normal rabbit serum (NRS) from siControl and siYB-1 kd cell lysates. Captured mRNAs were reverse-transcribed and PCR amplified using primers specific for G3BP1 or XIAP as a control. (B) YB-1–bound mRNAs were RIPed using anti–YB-1 or control anti-GRB2 antibodies from polysomes prepared from vehicle alone and arsenite-treated U2OS cells, and subjected to semiquantitative RT-PCR using G3BP1- and XIAP-specific primers. (C) Constructs containing 5′ UTR sequences of G3BP1 (black) or β-Globin (gray) fused in frame to Luciferase were used for in vitro coupled transcription translation. Increasing concentrations of recombinant YB-1 were added to the assay mixture, and luciferase activity was measured. Error bars indicate SD. (D) RNA EMSA analysis to measure direct binding of YB-1 to the full-length G3BP1 5′ UTR. Biotin-labeled full-length G3BP1 5′ UTR mixed with recombinant GST-YB-1 was subjected to EMSA. The arrowhead indicates a probe mobility shift in the presence of 0.4 µg of GST-YB-1, and enhanced intensity at 0.8 µg of GST-YB-1. A 200-fold molar excess concentration of unlabeled full-length G3BP1 5′ UTR was added to demonstrate specificity of 5′ UTR G3BP1/YB-1 complex formation. As a control, recombinant GST was used in place of GST-YB-1. The broken line indicates that intervening lanes have been spliced out. (E) The full-length 5′ UTR G3BP1 (FL, 1–171) or deletion mutants (M1, Δ105–112; M2, Δ141–171; M3, Δ99–171; and M4, Δ141–171) were cloned in frame with Luciferase and used for in vitro coupled transcription/translation assays ±0.5 pmol YB-1 as described in C. Error bars indicate SD. (F) RNA EMSA showing that YB-1 binds to the full-length (FL, 1–171) G3BP1 5′ UTR but not M3 and M4 mutants. (G) Biotin end-tagged full length or the indicated deletion mutants of the G3BP1 5′ UTR were subjected to RNA affinity chromatography from U2OS lysates using Streptavidin beads. Affinity-purified proteins were immunoblotted using anti–YB-1 antibodies. Biotin end-tagged 5′ UTR of β-Globin was used as a control. (H) Full-length G3BP1 5′ UTR or the M4 deletion mutant (Δ48–171) were transfected into siControl or siYB-1 kd U2OS cells. Lysates were prepared and subjected to RNA affinity chromatography and immunoblotted as described in G to detect 5′ UTR–bound YB-1. Untransfected cells served as controls.
Figure 4.
Figure 4.
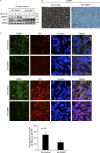
YB-1 regulates G3BP1 expression in vivo. (A) MNNG shControl or shYB-1 kd cells were implanted under the renal capsules of three independent pairs of NOD/SCID mice, and primary site tumors were collected 4–5 wk after implantation. Viable regions of tumors were cryosectioned and subjected to IF with anti–YB-1 (green) or anti-G3BP1 (red) antibodies, and counterstained with DRAQ5 to detect nuclei. Insets show fivefold higher magnification of indicated areas. 10 high-power fields (HPF) of representative tumor sections from each implantation site tumor (n = 3 per group) were used for quantification of SGs as in Fig. 1 B, as shown below with a bar graph. Mean values ± SD (error bars) are shown for three independent tumors. **, P < 0.01. Bars: (main panels) 10 µm; (enlarged insets) 1 µm. (B) Lysates extracted from tumor tissues from A were subjected to immunoblot analysis using the indicated antibodies.
Figure 5.
Figure 5.
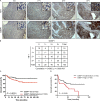
Expression of G3BP1 correlates with YB-1 and is linked to poor outcomes. (A) Serial sections of three TMAs containing 153 different human sarcoma cases were subjected to sequential IHC using antibodies to YB-1 or G3BP1 as indicated. Panels show expression of YB-1 and G3BP1 by IHC in four different representative sarcoma cases. Insets show 10-fold higher magnification of representative areas. Immunostaining for each protein was scored as no (0), low (1+), moderate (2+), or high expression (3+) as indicated. Bars: (main panels) 100 µm; (enlarged insets) 20 µm. (B) Tabulated values from IHC scoring of A, with a Spearman’s rank correlation coefficient between expression of each protein of 0.4963 and a p-value of 0.0001437. (C and D) Kaplan-Meier estimates for overall survival (event = deceased) in relation to G3BP1 expression for Ewing sarcoma patients with localized disease (high and medium vs. low G3BP1 expression; C) and metastatic disease (high vs. low and medium G3BP1 expression; D).
Figure 6.
Figure 6.
G3BP1 regulates SG formation in vivo. (A) MNNG shControl or shG3BP1 cells were implanted under the renal capsules of NOD/SCID mice (eight mice per group), and primary site tumors were collected 4–5 wk after implantation. Lysates extracted from tumor tissues were immunoblotted using the indicated antibodies. (B) Viable regions of shControl and shG3BP1 tumors were cryosectioned and subjected to G3BP1 IHC. Bars, 100 µm. (C) Viable regions of tumors were cryosectioned and subjected to IF with the indicated antibodies and DRAQ5 to counterstain nuclei. Insets show fivefold higher magnification of representative areas. Quantification of SGs as in Fig. 1 B is shown below as a bar graph, in which 20 high-power fields of representative tumor sections from each tumor group (n = 5) were used for SG quantification. Mean values ± SD (error bars) are shown. *, P < 0.05. Bars: (main panels) 10 µm; (enlarged insets) 1 µm.
Figure 7.
Figure 7.
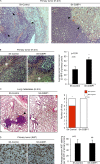
G3BP1 kd inhibits local invasion and lung metastasis. (A) H&E-stained representative sections of implantation site tumors from NOD/SCID mice bearing renal subcapsular tumor xenografts of MNNG cell lines with (shG3BP1) or without (shControl) G3BP1 kd. Arrowheads show highly invasive growth pattern of shControl tumors (left) and noninvasive borders of shG3BP1 tumors (right). (B) H&E-stained sections of MNNG shControl and shG3BP1 tumors, with asterisks showing microscopic areas of necrosis. The latter is quantitated (bar graph, right) by measuring average percent geographical necrosis in 20 high-power fields from each tumor type (n = 5 tumors per group). Mean values ± SD (error bars) are shown. *, P < 0.05. (C) H&E-stained lung sections from mice bearing renal subcapsular tumor xenografts of MNNG cells with (shG3BP1) or without (shControl) G3BP1 kd. The arrowhead (left) shows a metastatic pulmonary lesion. The bar graph shows the total number of mice with at least one lung metastasis (Mets positive, red) in the indicated groups (n = 8 mice/group). Mean values ± SD (error bars) are shown. *, P < 0.05. (D) Primary site tumors with (shG3BP1) or without (shControl) G3BP1 kd were stained with antibodies to the Ki67 proliferation marker. The percentage of Ki67-positive cells in each group is quantitated in the bar graph (right) by counting cells in 20 high-power fields from each tumor type (n = 5 tumors per group). ns, nonsignificant. Error bars indicate SD. Bars, 100 µm.

Similar articles

Cited by

References

    1. Anderson P., and Kedersha N.. 2006. RNA granules. J. Cell Biol. 172:803–808 10.1083/jcb.200512082 - DOI - PMC - PubMed
    1. Anderson P., and Kedersha N.. 2008. Stress granules: the Tao of RNA triage. Trends Biochem. Sci. 33:141–150 10.1016/j.tibs.2007.12.003 - DOI - PubMed
    1. Anderson P., and Kedersha N.. 2009. RNA granules: post-transcriptional and epigenetic modulators of gene expression. Nat. Rev. Mol. Cell Biol. 10:430–436 10.1038/nrm2694 - DOI - PubMed
    1. Araujo P.R., Yoon K., Ko D., Smith A.D., Qiao M., Suresh U., Burns S.C., and Penalva L.O.. 2012. Before it gets started: Regulating translation at the 5′ UTR. Comp. Funct. Genomics. 2012:475731 10.1155/2012/475731 - DOI - PMC - PubMed
    1. Arimoto K., Fukuda H., Imajoh-Ohmi S., Saito H., and Takekawa M.. 2008. Formation of stress granules inhibits apoptosis by suppressing stress-responsive MAPK pathways. Nat. Cell Biol. 10:1324–1332 10.1038/ncb1791 - DOI - PubMed

Publication types

MeSH terms