. 2015 Apr;17(4):386-96.
doi: 10.1038/ncb3139. Epub 2015 Mar 23.

The suture provides a niche for mesenchymal stem cells of craniofacial bones

Affiliations

The suture provides a niche for mesenchymal stem cells of craniofacial bones

Hu Zhao et al. Nat Cell Biol. 2015 Apr.

Abstract

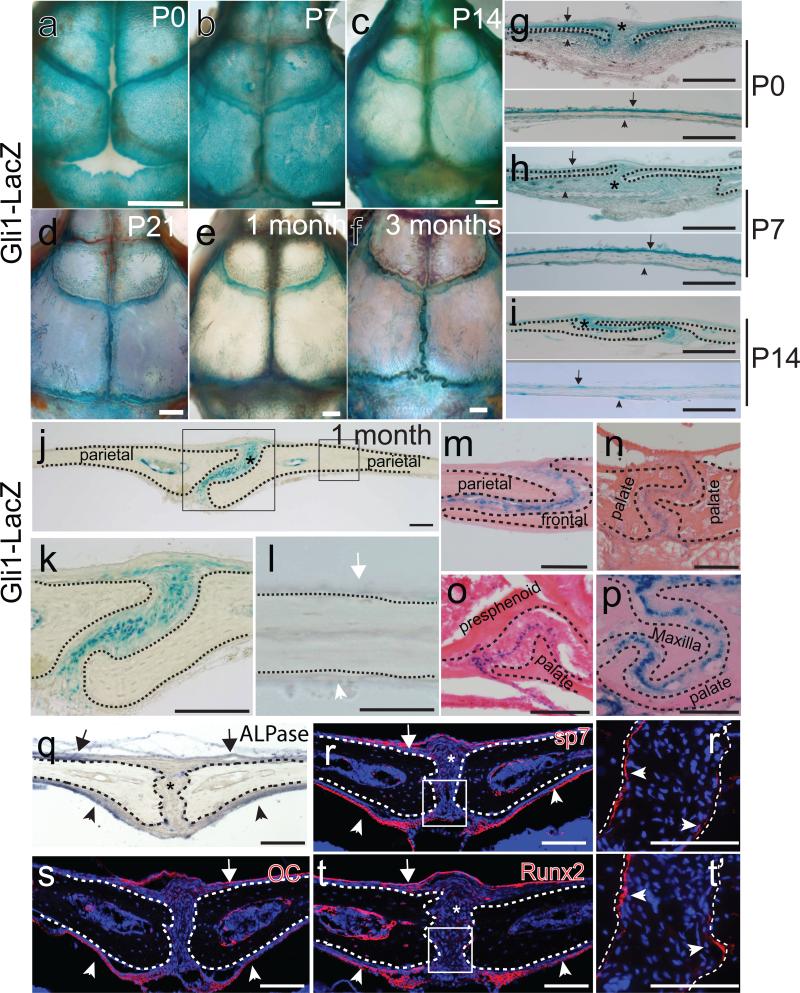
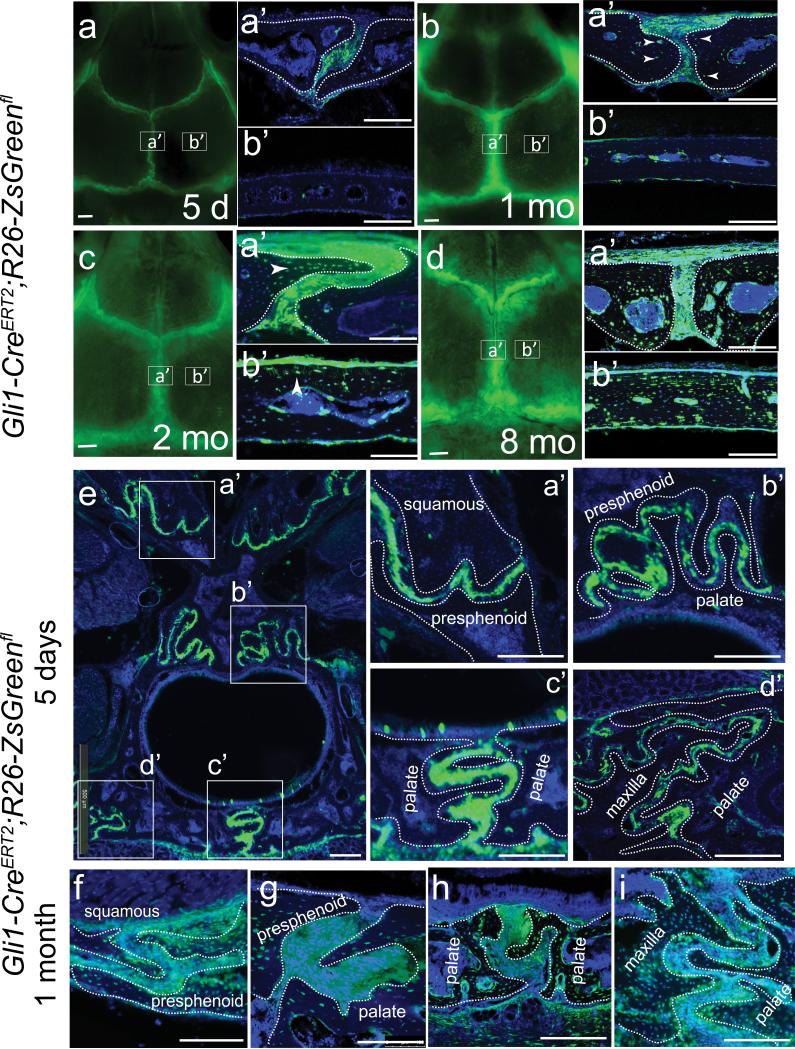
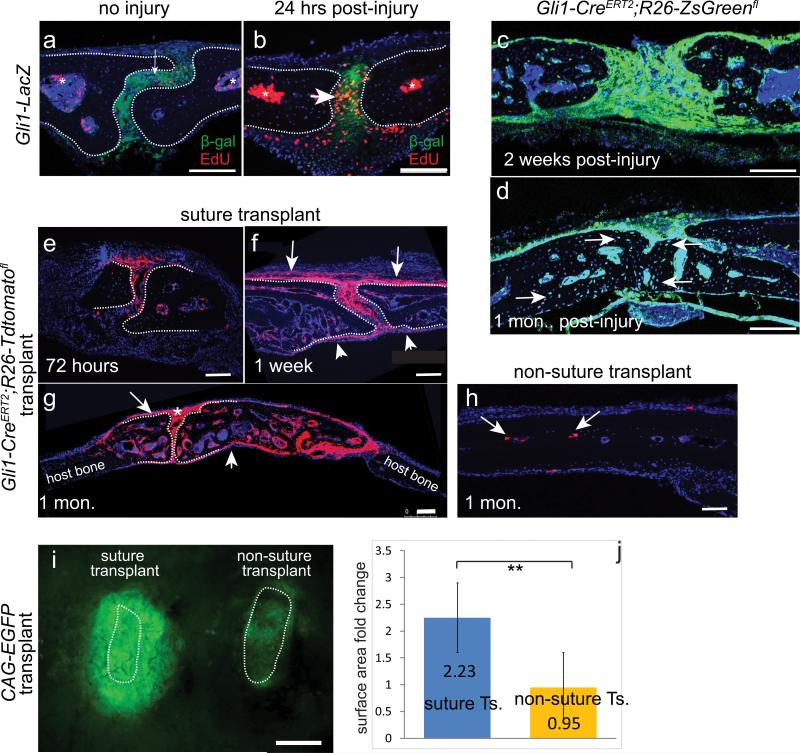
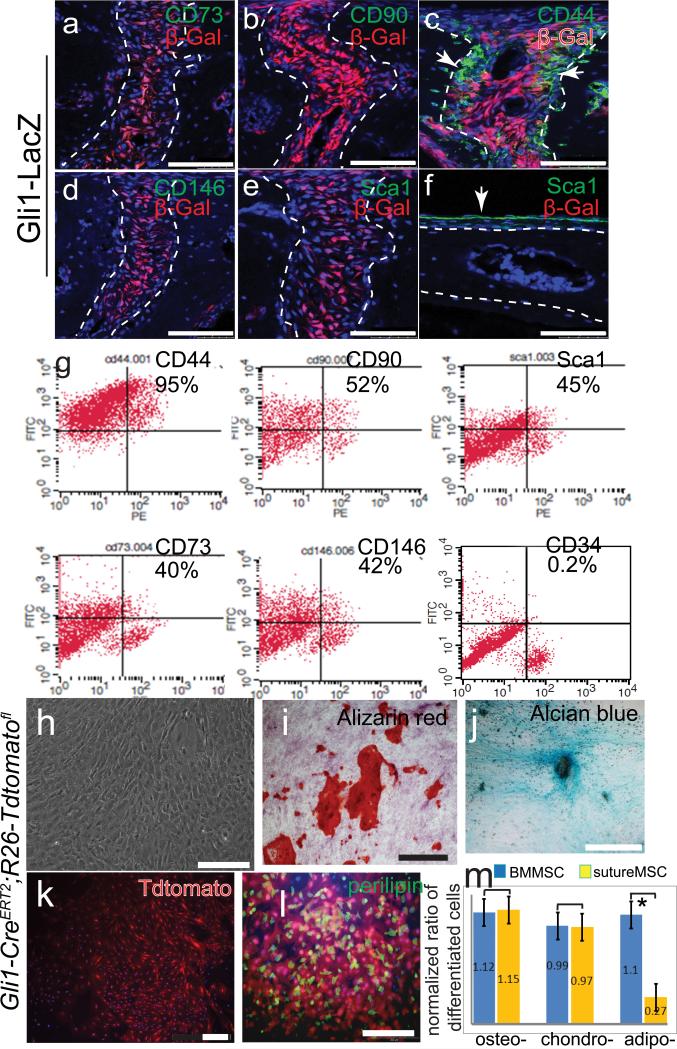
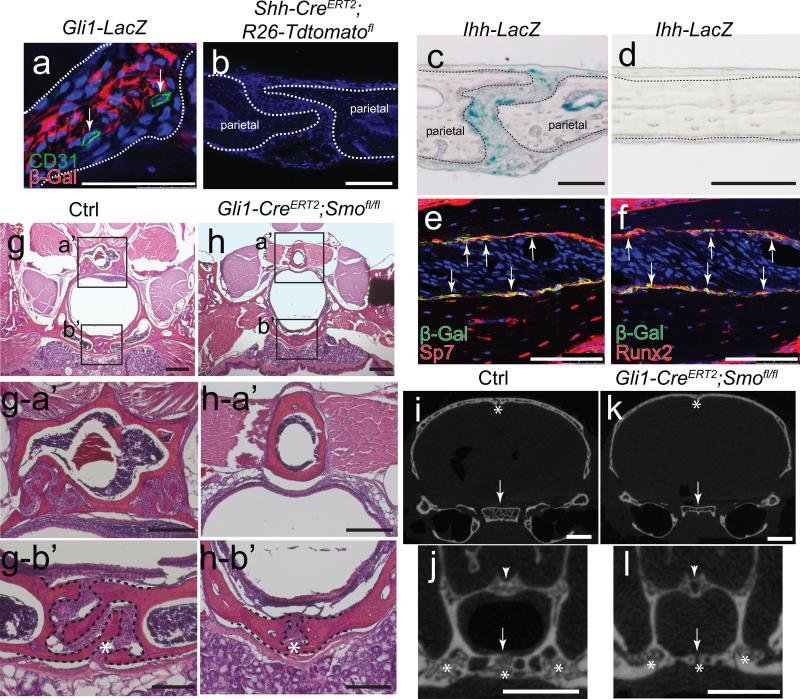
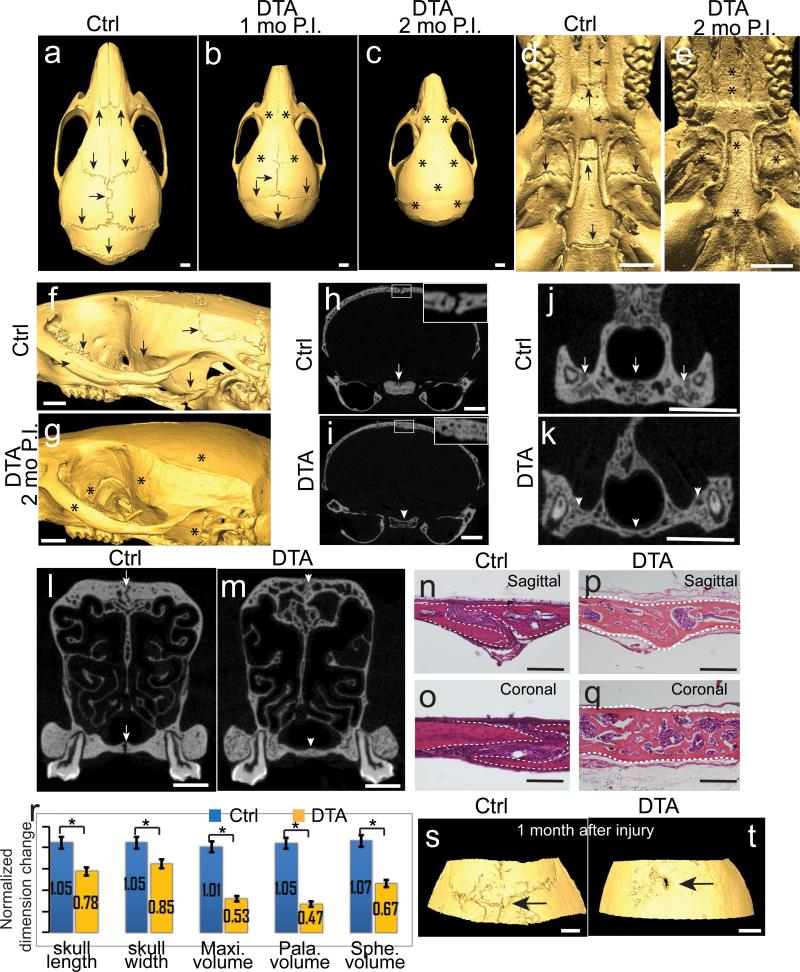
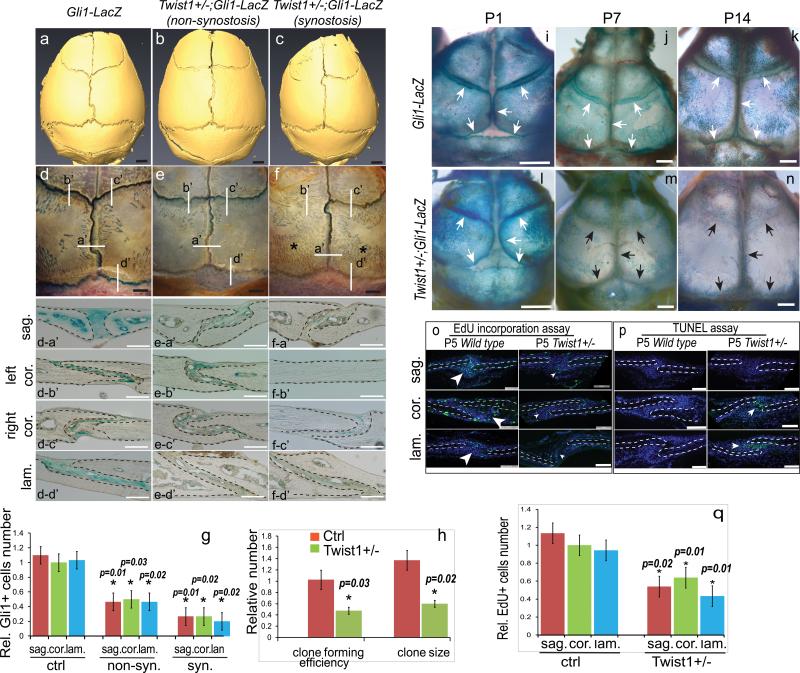
Bone tissue undergoes constant turnover supported by stem cells. Recent studies showed that perivascular mesenchymal stem cells (MSCs) contribute to the turnover of long bones. Craniofacial bones are flat bones derived from a different embryonic origin than the long bones. The identity and regulating niche for craniofacial-bone MSCs remain unknown. Here, we identify Gli1+ cells within the suture mesenchyme as the main MSC population for craniofacial bones. They are not associated with vasculature, give rise to all craniofacial bones in the adult and are activated during injury repair. Gli1+ cells are typical MSCs in vitro. Ablation of Gli1+ cells leads to craniosynostosis and arrest of skull growth, indicating that these cells are an indispensable stem cell population. Twist1(+/-) mice with craniosynostosis show reduced Gli1+ MSCs in sutures, suggesting that craniosynostosis may result from diminished suture stem cells. Our study indicates that craniofacial sutures provide a unique niche for MSCs for craniofacial bone homeostasis and repair.


Figures

Figure 1
Figure 1
Gli1+ cells are restricted to the suture mesenchyme of craniofacial bones and are undifferentiated cells. (a-f) Whole mount LacZ staining (blue) of calvarial bones of newborn (P0), 7, 14 and 21 day old (P7, P14, P21) and one- and three-month-old Gli1-LacZ mice. (g-i) LacZ staining of sections of sagittal sutures and parietal bones of P0, P7 and P14 mice indicates Gli1+ cells are present in the suture mesenchyme (asterisks), periosteum (arrows) and dura (arrowheads). (j-l) LacZ staining of sections of the sagittal suture of one-month-old Gli1-LacZ mice. Asterisk indicates exclusive Gli1 expression within the suture mesenchyme. No positive staining is detectable in the periosteum (white arrow) and dura (white arrowhead). Boxed areas in j are displayed in k and l. (m-p) LacZ staining of the mid-suture mesenchyme in the coronal (m), interpalatal (n), presphenoid-palatal (o) and maxilla-palatal (p) sutures of one-month-old Gli1-LacZ mice. (q-t) ALPase (blue) and immunohistochemical (red) staining of sagittal sutures of one-month-old mice. Osteogenic markers including ALPase (q), Sp7 (r), osteocalcin(OC) (s) and Runx2 (t) are not detectable in the suture mesenchyme (asterisks). The periosteum (arrows) and dura (arrowheads) strongly express these markers. Boxed areas in r and t are enlarged in panels r’ and t’, respectively, showing positive expression in the osteogenic fronts (arrowheads). Dotted lines outline margins of craniofacial bones. Scale bars in panels a-f, 1mm; other scale bars, 100 μm.
Figure 2
Figure 2
Gli1+ cells in the suture mesenchyme contribute to adult craniofacial bone turnover. Gli1-CE;R26ZsGreenfl mice were induced at 1 month of age with tamoxifen. (a-d) Gli1+ cells in the adult sagittal suture mesenchyme 5 days and 1, 2 and 8 months after induction. Arrowheads indicate positively labeled osteocytes. Boxes indicate the approximate positions of sections shown in the right panels (a' and b'). (e-i) Five days (e, a'-d') and one month (f-i) after induction, fluorescently labeled cells are detectable in the craniofacial sutures (low magnification image in e) including the squamous-presphenoid (panels a', f), presphenoid-palatal (panels b', g), interpalatal (panels c', h) and maxilla-palatal (panels d', i) sutures. Dotted lines outline craniofacial bones. Scale bars in panel a-d, 1mm; other scale bars, 100 μm.
Figure 3
Figure 3
Gli1+ cells in the suture mesenchyme contribute to injury repair and support transplant growth. (a,b) EdU incorporation (red) in the suture mesenchyme of Gli1-LacZ (green) mice uninjured or twenty-four hours after injury. Post-injury, many Gli1+ cells are activated into proliferation (arrow in b). Asterisks indicate proliferating blood cells in the bone marrow space. Dotted lines outline margins of parietal bones. (c,d) Visualization of sutures in Gli1-CE;R26ZsGreen mice two weeks and one month after induction with tamoxifen at 1 month of age and injury five days later. Arrows indicate fluorescently labeled osteocytes in the reparative region. (e-g) Transplantation of sagittal sutures without the periosteum and dura from Gli1-CE;R26-Tdtomatofl mice into nude mice. Samples collected 72 hours (e), 1 week (f) and 1 month (g) after transplantation indicate Gli1+ cells in the suture mesenchyme gradually contribute to the formation of new periosteum (arrows), new dura (arrowheads) and new bone. Asterisk indicates patent suture in the transplant. Dotted lines outline the parietal bones. (h) Transplantation of parietal bone without sutures from Gli1-CE;R26-Tdtomatofl mice into nude mice (control). One month later, Gli1+ cells in the bone marrow space (arrows) do not contribute to the formation of new periosteum, dura or osteocytes. (i) Visualization one month after transplantation of sagittal sutures or parietal bones without sutures (non-suture transplant) dissected from CAG-EGFP mice together with the intact periosteum and dura. Dotted lines outline the original size of the transplants. (j) Quantification of the fold change of the transplant surface area from (i). Values are plotted as mean ±SEM. The numbers indicate mean fold change. Student's t-test was performed, **, p=0.006, n=12 transplants. Scale bar in panel i, 1mm; other scale bars, 100 μm.
Figure 4
Figure 4
Gli1+ cells are MSCs in vitro. (a-f) Immunohistochemical staining of MSC markers CD73 (a), CD90 (b), CD44 (c), CD146 (d) and Sca1 (e) in the suture mesenchyme of Gli1-LacZ mice. Sca1 expression is also detectable in the periosteum (f). Arrows indicate expression. Dotted lines outline bone margins. (g) FACS analysis of suture mesenchymal cells harvested from one-month-old Gli1-CE;R26Tdtomato mice induced with tamoxifen. (h-l) Gli1+ cells form clones in culture. Positive clones were picked based on their fluorescence (k). Alizarin red (i), Alcian blue (j), and perilipin (l) staining indicates that cells from single clones can undergo tri-lineage osteogenic (osteo), chondrogenic (chondro), and adipogenic (adipo) differentiation. (m) Quantitation of the fraction of differentiated cells in the suture MSC culture normalized to that of BMMSCs under the same conditions. Values are plotted as mean ±SEM. *, student t-test, p=0.02, n=5 cultures derived from different mice. Scale bars, 100 μm.
Figure 5
Figure 5
IHH secreted from the osteogenic front signals to Gli1+ cells in the suture mesenchyme and regulates osteogenic lineage differentiation. (a) Immunohistochemical staining of CD31 (green) in the sagittal suture in Gli1-LacZ mice. CD31 labels vasculature. Dotted line outlines the parietal bone. (b) Suture mesenchyme in Shh-CreERT2;Tdtomatofl mice. One-month-old mice were induced and samples were collected two weeks later. (c,d) LacZ staining of the sagittal suture of Ihh-LacZ mice at 1 month of age. Ihh+ cells are detectable at the osteogenic front of the parietal bone (c) but not in the periosteum or dura (d). Dotted line outlines the parietal bone margin. (e,f) Immunohistochemical staining (red) of Sp7 (e) and Runx2 (f) in the suture mesenchyme of one-month-old Ihh-LacZ mice. Yellow indicates colocalization of fluorescent staining (arrows). (g-l) HE staining (g,h) and microCT analysis (i-l) of one-month-old Gli1-CreERT2;Smofl/fl and Gli1-CreERT2 (ctrl) mice after induction with tamoxifen. Samples were collected 8 months later. Boxed areas in g and h are displayed in the lower panels. MicroCT images in i and k are at the basosphenoid bone position. Arrows indicate basosphenoid bone; asterisks indicate patent sutures. MicroCT images in j and l are at the palatal bone position. Arrows indicate palatal bones; arrowheads indicate presphenoid bones; asterisks indicate patent sutures. Scale bars in panels i, j, k and l, 1mm; other scale bars, 100 μm.
Figure 6
Figure 6
Gli1+ cell ablation leads to craniosynostosis, skull growth arrest, osteoporosis and compromised injury repair. (a-g) Top views (a-c), bottom views (d,e) and side views (f,g) of microCT reconstructed images of Gli1-CE (Ctrl) and Gli1-CE;R26DTAf/f (DTA) mice induced with tamoxifen at one month of age. Samples were collected 1 month (b) or 2 months (c and all other panels) post-injection (P.I). Arrows indicate normal patent sutures. Asterisks indicate fused sutures in DTA samples. (h-i) MicroCT slices showing sagittal sutures in control and DTA mice. Basosphenoid bone in the DTA sample shows severe osteoporosis (arrowhead) compared with the control (arrow). Boxed areas are displayed in the insets. (j-m) MicroCT images showing interpalatal and maxilla-palatal sutures (j,k) and frontal and intermaxillary sutures (l,m) from control and DTA mice. Arrows indicate patent sutures and arrowheads indicate fused sutures. (n-q) HE staining of sagittal and coronal sutures in control and DTA mice. Dotted lines outline margins of the bone. (r) Quantification of anterior-posterior skull length, left-right skull width, bone volume of the maxillary (maxi), palatal (pala) and basosphenoid (sphe) bone of control and DTA mice. Values are plotted as mean ±SEM. *, p<0.05. Student t-test analyses were performed to compare the skull length (p=0.02, n=5 skulls), skull width (p=0.01, n=5 skulls), maxillary bone volume (p=0.02, n=5 skulls), palatal bone volume (p=0.02, n=5 skulls) and sphenoid bone volume (p=0.01, n=5 skulls). (s, t) MicroCT images of one-month-old control and DTA mice injured five days after induction. Arrows in samples collected one month later indicate complete healing in the control sample and incomplete healing in the DTA sample. Scale bars in panels n-q, 200μm; other scale bars, 1mm.
Figure 7
Figure 7
Gli1+ cell numbers are significantly reduced in sutures of Twist1+/− mice. MicroCT (a-c) and whole mount LacZ staining (d-f) of one-month-old control Gli1-LacZ and Twist1+/−;Gli1-LacZ +/− mice, with and without synostosis. Sagittal (sag), coronal (cor) and lamboid (lam) sections of each suture are displayed in the lower panels. White lines in d-f indicate the approximate positions of the sections. Dotted lines outline the margins of calvarial bones. Numbers of Gli1+ cells are quantified in (g). Values are plotted as mean ±SEM. ANOVA analysis was performed. *, p values are indicated in the figure, n=5 skulls. (h) Quantification of clone-forming efficiency and relative average clone size of sagittal suture mesenchymal cells from control (ctrl) and Twist1+/− mice. Values are plotted as mean ±SEM. Student t-test analysis was performed. *, p values are indicated in the figure, n=4 skulls. (i-n) LacZ staining of the calvarial bones of Gli1-LacZ and Twist1+/−;Gli1-LacZ mice at P1, P7 and P14. White arrows indicate LacZ staining and black arrows indicate reduced or diminished LacZ staining. (o-p) Edu incorporation and TUNEL assays in sagittal (sag), coronal (cor) and lambdoid (lam) sutures of control and Twist1+/− mice at P5. Dotted lines outline bone surface. Arrowheads indicate EdU+ cells or TUNEL+ apoptotic cells. EdU+ cell ratios are quantified in (q). Values are plotted as mean ±SEM. Student t-test analysis was performed. *, p values are indicated in the figure, n=6 skulls. Scale bars in panels a-f and i-n, 1mm; other scale bars, 100 μm.

Similar articles

Cited by

References

    1. Chai Y, Maxson RE., Jr. Recent advances in craniofacial morphogenesis. Dev Dyn. 2006;235:2353–2375. - PubMed
    1. Clark BR, Keating A. Biology of bone marrow stroma. Annals of the New York Academy of Sciences. 1995;770:70–78. - PubMed
    1. Riminucci M, Remoli C, Robey PG, Bianco P. Stem cells and bone diseases: New tools, new perspective. Bone. 2015;70C:55–61. - PMC - PubMed
    1. Zhou BO, Yue R, Murphy MM, Peyer JG, Morrison SJ. Leptin-receptor-expressing mesenchymal stromal cells represent the main source of bone formed by adult bone marrow. Cell Stem Cell. 2014;15:154–168. - PMC - PubMed
    1. Mendez-Ferrer S, et al. Mesenchymal and haematopoietic stem cells form a unique bone marrow niche. Nature. 2010;466:829–834. - PMC - PubMed

Publication types

MeSH terms