. 2015 May 8;290(19):12184-94.
doi: 10.1074/jbc.M115.649301. Epub 2015 Mar 19.

UV Light Potentiates STING (Stimulator of Interferon Genes)-dependent Innate Immune Signaling through Deregulation of ULK1 (Unc51-like Kinase 1)

Affiliations

UV Light Potentiates STING (Stimulator of Interferon Genes)-dependent Innate Immune Signaling through Deregulation of ULK1 (Unc51-like Kinase 1)

Michael G Kemp et al. J Biol Chem. .

Abstract

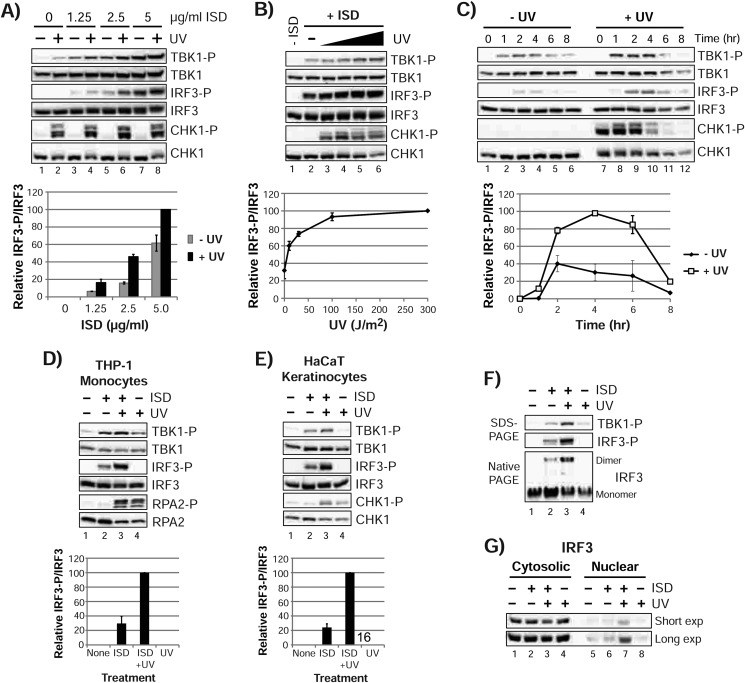
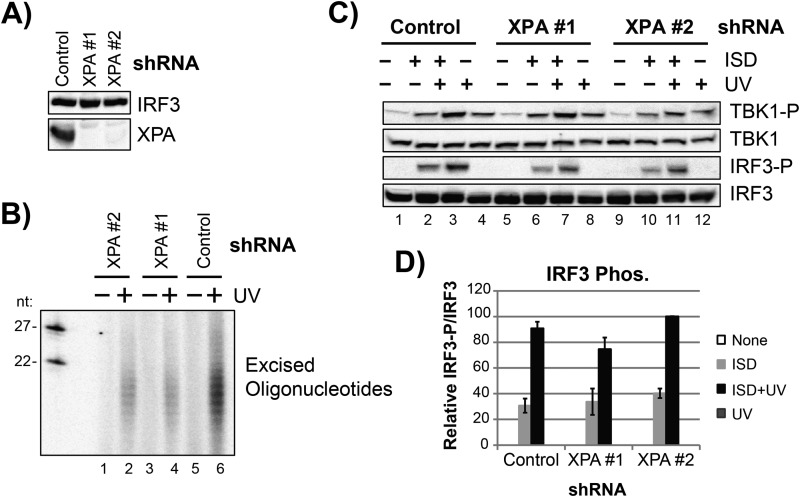
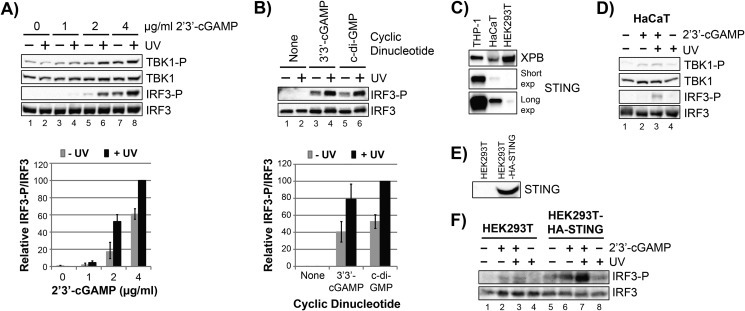
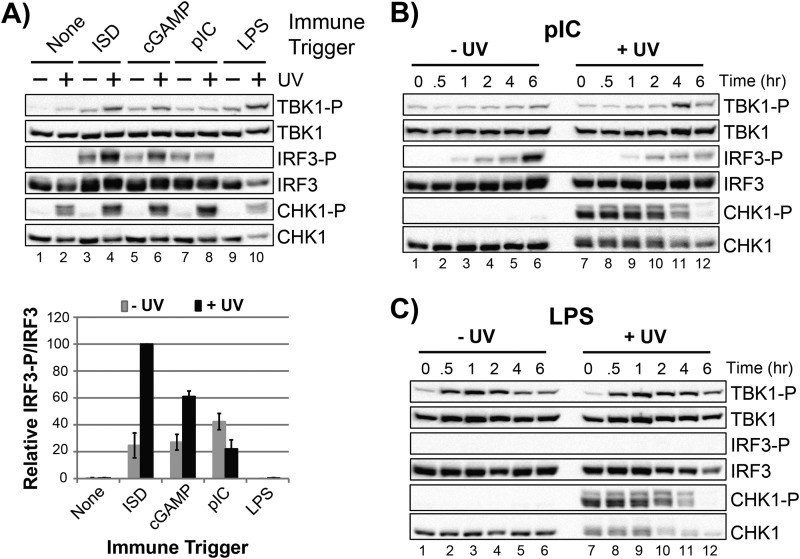
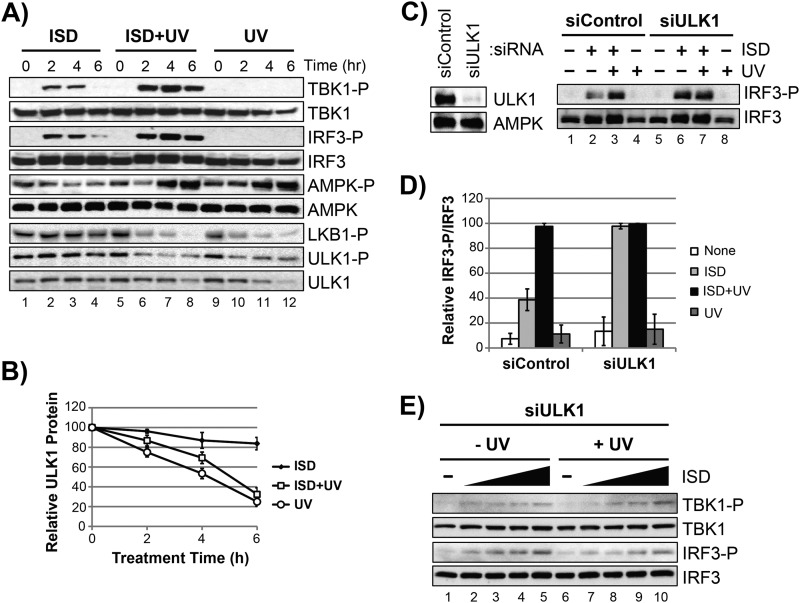
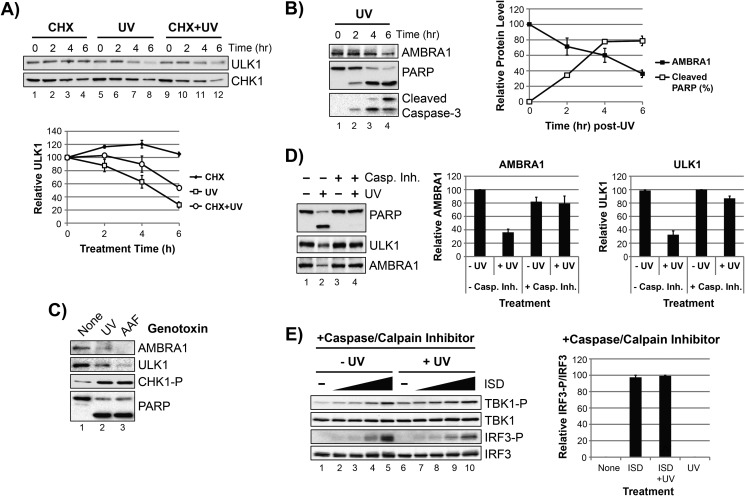
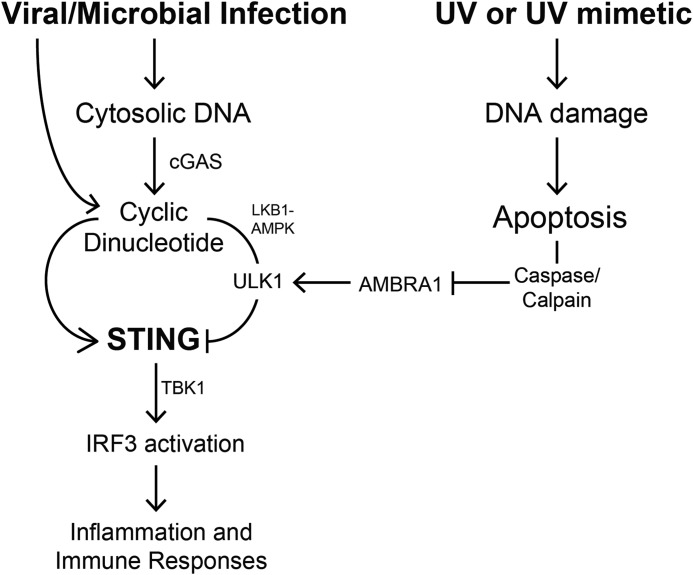
The mechanism by which ultraviolet (UV) wavelengths of sunlight trigger or exacerbate the symptoms of the autoimmune disorder lupus erythematosus is not known but may involve a role for the innate immune system. Here we show that UV radiation potentiates STING (stimulator of interferon genes)-dependent activation of the immune signaling transcription factor interferon regulatory factor 3 (IRF3) in response to cytosolic DNA and cyclic dinucleotides in keratinocytes and other human cells. Furthermore, we find that modulation of this innate immune response also occurs with UV-mimetic chemical carcinogens and in a manner that is independent of DNA repair and several DNA damage and cell stress response signaling pathways. Rather, we find that the stimulation of STING-dependent IRF3 activation by UV is due to apoptotic signaling-dependent disruption of ULK1 (Unc51-like kinase 1), a pro-autophagic protein that negatively regulates STING. Thus, deregulation of ULK1 signaling by UV-induced DNA damage may contribute to the negative effects of sunlight UV exposure in patients with autoimmune disorders.

Keywords: Apoptosis; Autoimmunity; Autophagy; Cell Signaling; DNA Damage; DNA Damage Response; DNA Repair; Innate Immunity; Interferon; Nucleotide Excision Repair.


Figures

FIGURE 1.
FIGURE 1.
UV radiation does not directly activate IRF3. A, THP-1 monocytes were irradiated with increasing fluences of UV radiation (0, 10, 30, 100, and 300 J/m2) or were transfected with ISD (2.5 μg/ml). Cells were harvested after 3.5 h and processed for detection of the excised oligonucleotide products of nucleotide (nt) excision repair and the phosphorylation of IRF3 on Ser-396. B, THP-1 monocytes were exposed to 100 J/m2 of UV radiation and then harvested after the indicated periods of time. Cell lysates were prepared and analyzed with the indicated antibodies. Phospho-Chk1 (Ser-345) antibody was used as a positive control to show a cellular response to UV radiation. As an additional control, cells were transfected with ISD as described in A.
FIGURE 2.
FIGURE 2.
UV stimulates cytosolic DNA-dependent TBK1-IRF3 signaling. A, THP-1 monocytes were irradiated with 50 J/m2 of UV and then transfected with the indicated amounts of ISD. Cell lysates were prepared 3.5 h after transfection and analyzed by immunoblotting. The IRF3-P and IRF3 signals were quantified by densitometry. The IRF3-P/IRF3 ratio was determined for each condition and then normalized to the highest value for each blot, which was set to an arbitrary value of 100. The graphs represent the average and S.E. from two independent experiments. B, THP-1 cells were exposed to increasing fluences of UV (0, 10, 30, 100, and 300 J/m2), transfected with 2.5 μg/ml ISD and then harvested 3 h later for immunoblot analysis. IRF3-P/IRF3 signals were quantified as described in A. C, THP-1 cells were irradiated with 100 J/m2 of UV and then transfected with 2.5 μg/ml ISD 20 min later. Cells were harvested at the indicated time points and analyzed by immunoblotting. IRF3-P/IRF3 signals were quantified as described in A. D, THP-1 monocytes were irradiated with UV (100 J/m2) and/or transfected with ISD (2.5 μg/ml) as indicated. Cells were harvested after 3.5–4 h and analyzed by immunoblotting. Quantified data show the average and S.E. from nine independent experiments. E, HaCaT cells were treated as in D. The graph shows the average and S.E. from three independent experiments. F, THP-1 cells were treated as in D except that cell lysates were analyzed by SDS-PAGE and native-PAGE before immunoblot analysis. G, THP-1 cells treated as in D were fractionated to separate the cytosolic and nuclear material before SDS-PAGE and immunoblot analysis.
FIGURE 3.
FIGURE 3.
The UV-mimetic chemical carcinogens BPDE and AAF potentiate cytosolic DNA-dependent TBK1-IRF3 signaling. A, THP-1 monocytes were exposed to the indicated genotoxin (100 J/m2 UV, 10 μm AAF, or 10 μm BPDE) 20 min before transfection with ISD. Cells were harvested 3.5 h later and processed for immunoblot analysis. The graph shows the average (+S.E.) IRF3-P/IRF3 signal in ISD-transfected cells exposed to the indicated genotoxins from two independent experiments. B, THP-1 cells were exposed to increasing concentrations of AAF (0, 0.3, 1, 3, and 10 μm), transfected with ISD for 3.5 h, and then analyzed by immunoblotting. C, THP-1 cells were exposed to increasing concentrations of BPDE (0, 0.3, 1, 3, and 10 μm) and are described in B.
FIGURE 4.
FIGURE 4.
UV stimulation of cytosolic DNA-dependent TBK1-IRF3 signaling is independent of nucleotide excision repair. A, lysates from THP-1 monocytes stably expressing XPA shRNA-expressing vectors or an empty vector (control) were analyzed by immunoblotting. B, the indicated THP-1 cell lines were exposed to UV (100 J/m2) and harvested 3.5 h later for analysis of nucleotide excision repair. Excised oligomers were radiolabeled, electrophoresed on a denaturing gel, and visualized with by phosphorimaging. C, the indicated cells lines were exposed to UV radiation and/or transfected with ISD as indicated. Lysates were analyzed by immunoblotting. D, quantitative analysis of experiments performed as in C. The graph shows the average and S.E. from three independent experiments.
FIGURE 5.
FIGURE 5.
Stimulation of TBK1-IRF3 signaling by cyclic dinucleotides is STING-dependent. A, THP-1 monocytes were irradiated or not with UV (100 J/m2) and then transfected with the indicated concentration of 2′,3′-cGAMP. Cell lysates were prepared 3 h later and analyzed by immunoblotting. The graph shows the average IRF3-P/IRF3 signal (with S.E.) from three independent experiments. B, THP-1 cells were treated as in A except that 3′,3′-cGAMP or c-di-GMP were transfected into the cells. The graph shows the average and S.E. from three to four independent experiments. C, cell lysates from the indicated cell lines was analyzed by immunoblotting with the indicated antibodies. D, HaCaT cells were treated as shown, and cell lysates were examined by immunoblotting. E, lysates from HEK293T or HEK293T cells stably expressing an HA epitope-tagged STING construct were analyzed by immunoblotting with an anti-STING antibody. F, the indicated cells were irradiated with UV (100 J/m2) and/or transfected with 2′,3′-cGAMP (12 μg/ml) as indicated. Cell lysates were prepared 3.5 h later and analyzed by immunoblotting.
FIGURE 6.
FIGURE 6.
UV does not stimulate TBK1-IRF3 signaling in response to RNA or LPS. A, THP-1 cells were irradiated with UV and treated with the indicated trigger of immune signaling. Cell lysates were prepared and analyzed by immunoblotting. The graph shows the average (with S.E.) IRF3-P/IRF3 signal for each condition. B, THP-1 cells were exposed or not to UV and then transfected with pIC. Cells were harvested at the indicated time points and analyzed by immunoblotting. C, cells were processed as described in B except that LPS was added to the culture medium.
FIGURE 7.
FIGURE 7.
UV modulates LKB1-AMPKα-ULK1 signaling and impacts ULK1 protein levels. A, THP-1 cells were treated as shown and then harvested at the indicated time points for immunoblot analysis. B, ULK1 protein level at each time point was quantified from at least three experiments described in A. Signals were normalized to the ULK1 signal at time 0. Error bars represent S.E. C, THP-1 monocytes were transfected with the indicated siRNAs as described under in “Experimental Procedures” and then treated with UV and or ISD. D, the average IRF3-P/IRF3 signals (with S.E.) from two independent experiments is presented in the graph. E, THP-1 monocytes transfected with ULK1 siRNA were exposed or not to UV radiation and then transfected with increasing concentrations of ISD (0, 0.625, 1.25, 2.5, or 5 μg/ml). Cells were harvested after 3.5 h and analyzed by immunoblotting.
FIGURE 8.
FIGURE 8.
UV-induced apoptotic signaling destabilizes ULK1 and AMBRA1 and is required for UV to potentiate STING-dependent IRF3 activation. A, THP-1 cells were preincubated or not for 15 min with cycloheximide (CHX) before UV irradiation. Cells were harvested at the indicated time points. Cell lysates were prepared and then analyzed by immunoblotting with anti-ULK1 or anti-Chk1 antibodies. B, THP-1 monocytes were exposed to UV (100 J/m2) and then harvested at the indicated time points. Cell lysates were prepared and examined by immunoblotting. The graph shows the average level of AMBRA1 protein and the percentage of cleaved poly(ADP-ribose) polymerase (PARP; relative to full-length plus cleaved) at each time point relative to the 0-h time point. Error bars represent the S.E. from two to five independent experiments. C, THP-1 monocytes were exposed to UV (100 J/m2) or AAF (20 μm) and then incubated for 6 h. Cell lysates were analyzed by immunoblotting. D, THP-1 monocytes were preincubated for 15 min with caspase and calpain inhibitors (abbreviated Casp. Inh.) before UV irradiation. Cells were harvested 6 h later, and cell lysates were analyzed by immunoblotting. The graphs show the relative levels of AMBRA1 and ULK1 protein under each condition, with the signals normalized to the highest value for each blot (average and S.E. from two to six independent experiments). E, THP-1 monocytes treated with caspase and calpain inhibitors were irradiated or not with UV and then transfected with increasing amounts of ISD (0, 0.38, 0.63, 1.25, 2.5 μg/ml). Cells were harvested after 3.5 h and analyzed by immunoblotting. The graph shows the average relative IRF3-P/IRF3 signal (using 2.5 μg/ml ISD) from two independent experiments. Error bars show the S.E.
FIGURE 9.
FIGURE 9.
Model for the role of UV radiation in the modulation of STING-dependent IRF3 activation. Cyclic dinucleotides (3′,3′-cGAMP and c-di-GMP) released during microbial infection or 2′,3′-cGAMP produced by cGAS upon binding to cytosolic DNA following viral or microbial infection stimulate STING to mediate phosphorylation and activation of IRF3 by TBK1, which results in inflammatory and immune responses. These cyclic dinucleotides also stimulate an LKB1-AMPKα-ULK1 signaling pathway that inhibits the STING pathway. In cells exposed to UV or a UV-mimetic, high levels of DNA damage induce apoptotic signaling (mediated by caspases and calpains) that destabilize AMBRA1 and ULK1. This loss of the STING negative regulator ULK1 results in an amplified response to cytosolic DNA and cyclic dinucleotides.

Similar articles

Cited by

References

    1. Baer R. L., Harber L. C. (1965) Photobiology of lupus erythematosus. Arch. Dermatol. 92, 124–128 - PubMed
    1. Epstein J. H., Tuffanelli D., Dubois E. L. (1965) Light sensitivity and lupus erythematosus. Arch. Dermatol. 91, 483–485 - PubMed
    1. Barbhaiya M., Costenbader K. H. (2014) Ultraviolet radiation and systemic lupus erythematosus. Lupus 23, 588–595 - PubMed
    1. O'Neill L. A. (2013) Immunology. Sensing the dark side of DNA. Science 339, 763–764 - PubMed
    1. Cai X., Chiu Y. H., Chen Z. J. (2014) The cGAS-cGAMP-STING pathway of cytosolic DNA sensing and signaling. Mol. Cell 54, 289–296 - PubMed

Publication types

MeSH terms

Substances