MiR-34a regulates blood-tumor barrier function by targeting protein kinase Cε
- PMID: 25788289
- PMCID: PMC4436826
- DOI: 10.1091/mbc.E14-10-1474
MiR-34a regulates blood-tumor barrier function by targeting protein kinase Cε
Abstract
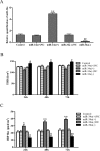
MicroRNA-34a (miR-34a) functions to regulate protein expression at the posttranscriptional level by binding the 3' UTR of target genes and regulates functions of vascular endothelial cells. However, the role of miR-34a in regulating blood-tumor barrier (BTB) permeability remains unknown. In this study, we show that miR-34a overexpression leads to significantly increased permeability of BTB, whereas miR-34a silencing reduces the permeability of the BTB. In addition, miR-34a overexpression significantly down-regulates the expression and distribution of tight junction-related proteins in glioma endothelial cells (GECs), paralleled by protein kinase Cε (PKCε) reduction. Moreover, luciferase reporter gene analysis shows that PKCε is the target gene of miR-34a. We also show that cotransfection of miR-34a and PKCε inversely coregulates BTB permeability and protein expression levels of tight junction-related proteins. Pretreatment of ψεRACK, a PKCε-specific activator, decreases BTB permeability in miR-34a-overexpressed GECs and up-regulates expression levels of tight junction proteins. In contrast, pretreatment of εV1-2, a specific PKCε inhibitor, gives opposite results. Collectively, our findings indicate that miR-34a regulates BTB function by targeting PKCε; after phosphorylation, PKCε is activated and contributes to regulation of the expression of tight junction-related proteins, ultimately altering BTB permeability.
© 2015 Zhao et al. This article is distributed by The American Society for Cell Biology under license from the author(s). Two months after publication it is available to the public under an Attribution–Noncommercial–Share Alike 3.0 Unported Creative Commons License (http://creativecommons.org/licenses/by-nc-sa/3.0).
Figures


Similar articles
-
Long non-coding RNA NEAT1 regulates permeability of the blood-tumor barrier via miR-181d-5p-mediated expression changes in ZO-1, occludin, and claudin-5.Biochim Biophys Acta Mol Basis Dis. 2017 Sep;1863(9):2240-2254. doi: 10.1016/j.bbadis.2017.02.005. Epub 2017 Feb 7. Biochim Biophys Acta Mol Basis Dis. 2017. PMID: 28185956
-
MiR-18a increased the permeability of BTB via RUNX1 mediated down-regulation of ZO-1, occludin and claudin-5.Cell Signal. 2015 Jan;27(1):156-67. doi: 10.1016/j.cellsig.2014.10.008. Epub 2014 Oct 29. Cell Signal. 2015. PMID: 25452107
-
Overexpression of miR-18a negatively regulates myocyte enhancer factor 2D to increase the permeability of the blood-tumor barrier via Krüppel-like factor 4-mediated downregulation of zonula occluden-1, claudin-5, and occludin.J Neurosci Res. 2015 Dec;93(12):1891-902. doi: 10.1002/jnr.23628. Epub 2015 Aug 27. J Neurosci Res. 2015. PMID: 26356851
-
MiR-34a and endothelial biology.Life Sci. 2023 Oct 1;330:121976. doi: 10.1016/j.lfs.2023.121976. Epub 2023 Jul 24. Life Sci. 2023. PMID: 37495076 Review.
-
The substrates and binding partners of protein kinase Cepsilon.Biochem J. 2010 Mar 29;427(2):189-96. doi: 10.1042/BJ20091302. Biochem J. 2010. PMID: 20350291 Free PMC article. Review.
Cited by
-
MiR-34a Interacts with Cytochrome c and Shapes Stroke Outcomes.Sci Rep. 2020 Feb 24;10(1):3233. doi: 10.1038/s41598-020-59997-y. Sci Rep. 2020. PMID: 32094435 Free PMC article.
-
Aging-regulated PNUTS maintains endothelial barrier function via SEMA3B suppression.Commun Biol. 2024 May 7;7(1):541. doi: 10.1038/s42003-024-06230-5. Commun Biol. 2024. PMID: 38714838 Free PMC article.
-
The Role of miR-330-3p/PKC-α Signaling Pathway in Low-Dose Endothelial-Monocyte Activating Polypeptide-II Increasing the Permeability of Blood-Tumor Barrier.Front Cell Neurosci. 2017 Dec 19;11:358. doi: 10.3389/fncel.2017.00358. eCollection 2017. Front Cell Neurosci. 2017. PMID: 29311822 Free PMC article.
-
MicroRNAs in central nervous system diseases: A prospective role in regulating blood-brain barrier integrity.Exp Neurol. 2020 Jan;323:113094. doi: 10.1016/j.expneurol.2019.113094. Epub 2019 Oct 30. Exp Neurol. 2020. PMID: 31676317 Free PMC article. Review.
-
Mast cells-derived MiR-223 destroys intestinal barrier function by inhibition of CLDN8 expression in intestinal epithelial cells.Biol Res. 2020 Mar 24;53(1):12. doi: 10.1186/s40659-020-00279-2. Biol Res. 2020. PMID: 32209121 Free PMC article.
References
-
- Bazzoni G, Dejana E. Endothelial cell-to-cell junctions: molecular organization and role in vascular homeostasis. Physiol Rev. 2004;84:869–901. - PubMed
-
- Besson A, Wilson TL, Yong VW. The anchoring protein RACK1 links protein kinase Cepsilon to integrin beta chains. Requirements for adhesion and motility. J Biol Chem. 2002;277:22073–22084. - PubMed
-
- Brandman R, Disatnik MH, Churchill E, Mochly-Rosen D. Peptides derived from the C2 domain of protein kinase C epsilon (epsilon PKC) modulate epsilon PKC activity and identify potential protein-protein interaction surfaces. J Biol Chem. 2007;282:4113–4123. - PubMed
Publication types
MeSH terms
Substances
LinkOut - more resources
Full Text Sources

