FLIPPER, a combinatorial probe for correlated live imaging and electron microscopy, allows identification and quantitative analysis of various cells and organelles
- PMID: 25786736
- PMCID: PMC4379394
- DOI: 10.1007/s00441-015-2142-7
FLIPPER, a combinatorial probe for correlated live imaging and electron microscopy, allows identification and quantitative analysis of various cells and organelles
Abstract
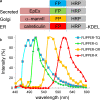
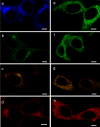
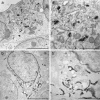
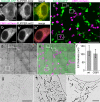
Ultrastructural examination of cells and tissues by electron microscopy (EM) yields detailed information on subcellular structures. However, EM is typically restricted to small fields of view at high magnification; this makes quantifying events in multiple large-area sample sections extremely difficult. Even when combining light microscopy (LM) with EM (correlated LM and EM: CLEM) to find areas of interest, the labeling of molecules is still a challenge. We present a new genetically encoded probe for CLEM, named "FLIPPER", which facilitates quantitative analysis of ultrastructural features in cells. FLIPPER consists of a fluorescent protein (cyan, green, orange, or red) for LM visualization, fused to a peroxidase allowing visualization of targets at the EM level. The use of FLIPPER is straightforward and because the module is completely genetically encoded, cells can be optimally prepared for EM examination. We use FLIPPER to quantify cellular morphology at the EM level in cells expressing a normal and disease-causing point-mutant cell-surface protein called EpCAM (epithelial cell adhesion molecule). The mutant protein is retained in the endoplasmic reticulum (ER) and could therefore alter ER function and morphology. To reveal possible ER alterations, cells were co-transfected with color-coded full-length or mutant EpCAM and a FLIPPER targeted to the ER. CLEM examination of the mixed cell population allowed color-based cell identification, followed by an unbiased quantitative analysis of the ER ultrastructure by EM. Thus, FLIPPER combines bright fluorescent proteins optimized for live imaging with high sensitivity for EM labeling, thereby representing a promising tool for CLEM.
Figures


Similar articles
-
A small protein probe for correlated microscopy of endogenous proteins.Histochem Cell Biol. 2018 Mar;149(3):261-268. doi: 10.1007/s00418-018-1632-6. Epub 2018 Jan 11. Histochem Cell Biol. 2018. PMID: 29327239 Free PMC article.
-
Correlative light-electron microscopy a potent tool for the imaging of rare or unique cellular and tissue events and structures.Methods Enzymol. 2012;504:201-19. doi: 10.1016/B978-0-12-391857-4.00010-0. Methods Enzymol. 2012. PMID: 22264536 Review.
-
3D HDO-CLEM: cellular compartment analysis by correlative light-electron microscopy on cryosection.Methods Cell Biol. 2012;111:95-115. doi: 10.1016/B978-0-12-416026-2.00006-6. Methods Cell Biol. 2012. PMID: 22857925
-
Live CLEM imaging to analyze nuclear structures at high resolution.Methods Mol Biol. 2015;1262:89-103. doi: 10.1007/978-1-4939-2253-6_6. Methods Mol Biol. 2015. PMID: 25555577
-
Fluorescing the electron: strategies in correlative experimental design.Methods Cell Biol. 2014;124:23-54. doi: 10.1016/B978-0-12-801075-4.00002-1. Methods Cell Biol. 2014. PMID: 25287835 Review.
Cited by
-
Quantitative techniques for imaging cells and tissues.Cell Tissue Res. 2015 Apr;360(1):1-4. doi: 10.1007/s00441-015-2149-0. Cell Tissue Res. 2015. PMID: 25773453 Free PMC article. No abstract available.
-
Multicolor Electron Microscopy for Simultaneous Visualization of Multiple Molecular Species.Cell Chem Biol. 2016 Nov 17;23(11):1417-1427. doi: 10.1016/j.chembiol.2016.10.006. Epub 2016 Nov 3. Cell Chem Biol. 2016. PMID: 27818300 Free PMC article.
-
CryoAPEX - an electron tomography tool for subcellular localization of membrane proteins.J Cell Sci. 2019 Mar 18;132(6):jcs222315. doi: 10.1242/jcs.222315. J Cell Sci. 2019. PMID: 30886003 Free PMC article.
-
Large-scale Scanning Transmission Electron Microscopy (Nanotomy) of Healthy and Injured Zebrafish Brain.J Vis Exp. 2016 May 25;(111):53635. doi: 10.3791/53635. J Vis Exp. 2016. PMID: 27285162 Free PMC article.
-
A small protein probe for correlated microscopy of endogenous proteins.Histochem Cell Biol. 2018 Mar;149(3):261-268. doi: 10.1007/s00418-018-1632-6. Epub 2018 Jan 11. Histochem Cell Biol. 2018. PMID: 29327239 Free PMC article.
References
-
- Boassa D, Berlanga ML, Yang MA, Terada M, Hu J, Bushong EA, Hwang M, Masliah E, George JM, Ellisman MH. Mapping the subcellular distribution of alpha-synuclein in neurons using genetically encoded probes for correlated light and electron microscopy: implications for Parkinson’s disease pathogenesis. J Neurosci. 2013;33:2605–2615. doi: 10.1523/JNEUROSCI.2898-12.2013. - DOI - PMC - PubMed
Publication types
MeSH terms
Substances
LinkOut - more resources
Full Text Sources
Other Literature Sources
Miscellaneous

