. 2015 Feb 28;6(6):3563-77.
doi: 10.18632/oncotarget.2969.

p19ARF is a critical mediator of both cellular senescence and an innate immune response associated with MYC inactivation in mouse model of acute leukemia

Affiliations

p19ARF is a critical mediator of both cellular senescence and an innate immune response associated with MYC inactivation in mouse model of acute leukemia

Alper Yetil et al. Oncotarget. .

Abstract

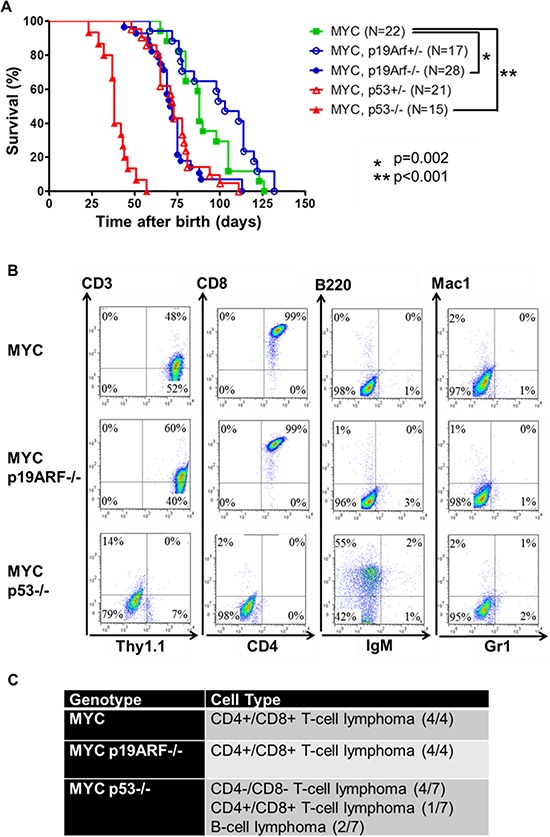
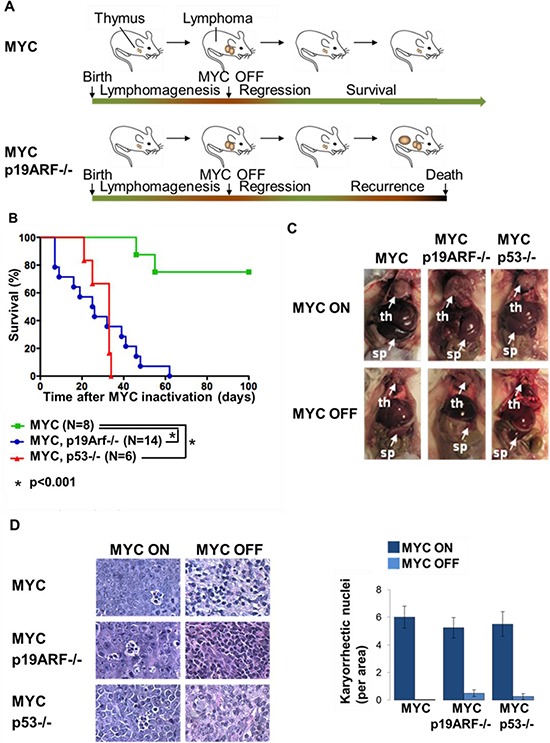
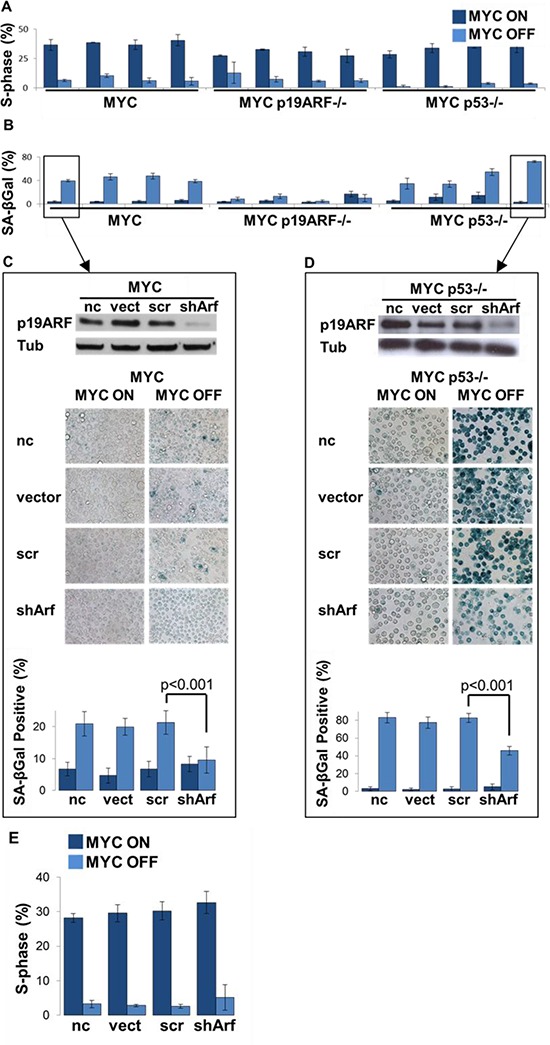
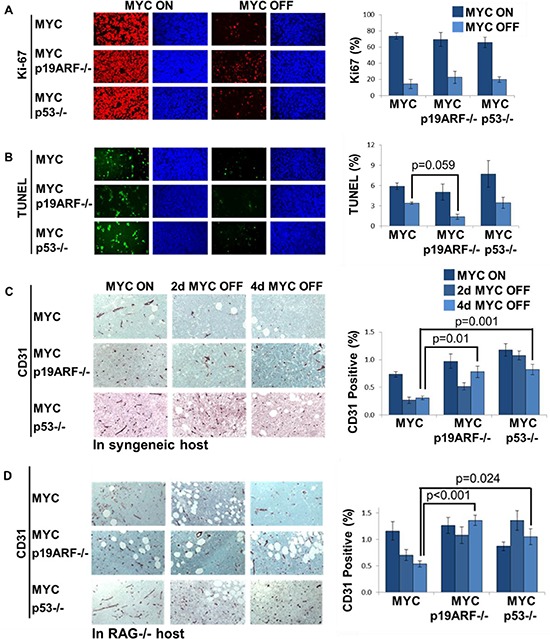
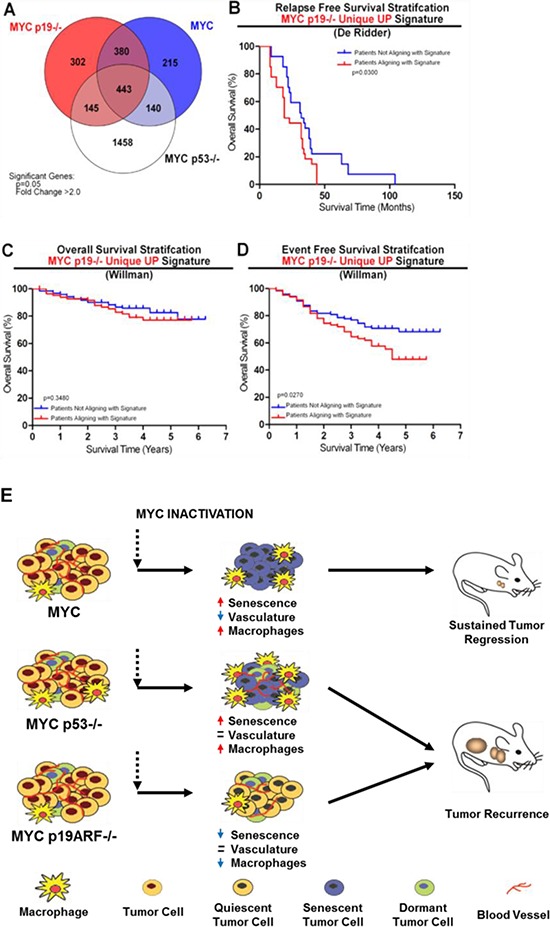
MYC-induced T-ALL exhibit oncogene addiction. Addiction to MYC is a consequence of both cell-autonomous mechanisms, such as proliferative arrest, cellular senescence, and apoptosis, as well as non-cell autonomous mechanisms, such as shutdown of angiogenesis, and recruitment of immune effectors. Here, we show, using transgenic mouse models of MYC-induced T-ALL, that the loss of either p19ARF or p53 abrogates the ability of MYC inactivation to induce sustained tumor regression. Loss of p53 or p19ARF, influenced the ability of MYC inactivation to elicit the shutdown of angiogenesis; however the loss of p19ARF, but not p53, impeded cellular senescence, as measured by SA-beta-galactosidase staining, increased expression of p16INK4A, and specific histone modifications. Moreover, comparative gene expression analysis suggested that a multitude of genes involved in the innate immune response were expressed in p19ARF wild-type, but not null, tumors upon MYC inactivation. Indeed, the loss of p19ARF, but not p53, impeded the in situ recruitment of macrophages to the tumor microenvironment. Finally, p19ARF null-associated gene signature prognosticated relapse-free survival in human patients with ALL. Therefore, p19ARF appears to be important to regulating cellular senescence and innate immune response that may contribute to the therapeutic response of ALL.


Figures

Figure 1
Figure 1. Loss of p19ARF or p53 cooperates with MYC
(A) Survival plot showing that loss of both alleles of p19ARF or loss of one or two alleles of p53 accelerates lymphomagenesis. MYC mice develop lymphoma in 89 days (n = 22), while MYC p19ARF+/− mice in 100 days (n = 17, p = 0.1), MYC p19ARF−/− mice in 73 days (n = 28, p = 0.002), MYC p53−/− mice in 40 days (n = 15, p = 0.001), MYC p53+/− mice in 74 days (n = 21, 0.004). (B) Flow cytometry analysis of cell surface markers of lymphomas from MYC, MYC p19ARF−/−, MYC p53−/−. The cells were analyzed by FACS for Thy1.1, CD2, CD4, CD8, B220, IgM, Gr1 and Mac1. (C) Lymphomas in MYC (n = 4) and MYC p19ARF−/− mice (n = 4) were CD4+/CD8+ T-cell lymphoma, while those in MYC p53−/− mice (n = 7) were CD4+/CD8+ T-cell lymphoma (14%), CD4−/CD8− T-cell lymphoma (56%) or B-cell lymphoma (28%).
Figure 2
Figure 2. Loss of p19ARF or p53 facilitates lymphoma recurrence
(A) Schematic showing the experimental design. MYC and MYC p19ARF−/− mice develop lymphomas when MYC is expressed from the time of conception. MYC is turned off when the mice develop lymphoma. The mice are monitored for lymphoma recurrence following the initial lymphoma regression. (B) Survival curve showing the percentage of mice versus time from MYC inactivation to death. Only 25% of MYC mice (n = 8) had spontaneous recurrence of lymphoma, while 100% of the MYC p19ARF+/− (n = 14), MYC p19ARF−/− (n = 14), MYC p53+/− (n = 14) and MYC p53−/− (n = 6) mice had recurrence. The survival time after MYC inactivation was 27 days in MYC p19ARF−/− mice, which was shorter than the survival time in MYC p19ARF+/− mice (35 days, p = 0.094) and MYC p53+/− mice (49 days, p = 0.014), but was not different from the survival time in MYC p53−/− mice (30 days, p = 0.6). (C) MYC, MYC p19ARF−/− and MYC p53−/− mice show similar pathology with enlarged thymus and spleen due to lymphoma. Upon 5 days of MYC inactivation, thymus and spleen shrink. (D) Hematoxylin-eosin staining shows that lymphoma in the thymuses of MYC, MYC p19ARF−/− and MYC p53−/− mice show similar histology at the microscopic level. The lymphoma sections include many apoptotic cells with fragmented nuclei. Upon 5 days of MYC inactivation, we note decrease in apoptotic cells.
Figure 3
Figure 3. Loss of p19ARF prevents MYC inactivation induced senescence in a p53-independent manner
(A) MYC inactivation induces proliferative arrest in MYC, MYC p19ARF−/− and MYC p53−/− lymphoma cells. Graph shows that after 2 days of MYC inactivation in vitro, S-phase fraction measured by flow cytometry on PI-stained cells drops to 7%, 8% and 3% in MYC, MYC p19ARF−/− and MYC p53−/− cells, respectively. (B) MYC inactivation induces increased SA-beta-galactosidase activity in MYC and MYC p53−/− lymphoma cells, but not in MYC p19ARF−/− cells. Graph shows that upon MYC inactivation percentage of cells that are SA-beta-galactosidase positive increased in MYC MYC p53−/− cells. SA-beta-galactosidase positivity was much lower in MYC p19ARF−/− cells and was unchanged before or after MYC inactivation. (C) Western blot showing knockdown of p19ARF expression by shRNA in a MYC p53−/− lymphoma cell line. Alpha-tubulin serves as loading control. shRNA targets exon1β of CDKN2A, hence it is specific to p19ARF. (D) Knockdown of p19ARF even in the absence of p53 curbs the increase in SA-beta-galactosidase activity when MYC is turned off. One MYC p53−/− cell line was transfected with an empty vector, a vector expressing control shRNA or p19ARF shRNA. Cells were stained with SA-beta-galactosidase assay in MYC on condition or 2 days after MYC inactivation. Graph showing percentage of cells that are positive for SA-beta-galactosidase activity. After 2 days of MYC inactivation, p19ARF knockdown cells (shArf) had significantly lower percentage of SA-beta-galactosidase positive cells as compared to uninfected (p = 0.001), empty vector (p = 0.001) and control shRNA cells (p = 0.001). (E) PI staining of S-phase cell cycle data, revealing that MYC p53−/− tumors do not demonstrate cell cycle arrest upon knockdown of p19ARF with shRNA.
Figure 4
Figure 4. Shutdown of angiogenesis, but not proliferative arrest, upon MYC inactivation in vivo is diminished by the loss of p19ARF or p53
(A) Proliferation analysis by Ki67 immunofluorescence on sections of primary lymphoma. Graph shows Ki67 positive area as normalized to DAPI. Upon 5 days of MYC inactivation, Ki67 positive cells decreased from 74%, 69%, 66% to 14%, 22%, 20% in MYC, MYC p19ARF−/− and MYC p53−/− lymphoma, respectively. There was no significant difference between MYC p19ARF−/− and MYC (MYC off, p = 0.4) or MYC p53−/− and MYC lymphomas (MYC off, p = 0.5). MYC inactivation leads to a decrease in proliferation in MYC, MYC p19ARF−/− and MYC p53−/− lymphomas. (B) Apoptosis analysis by TUNEL staining on sections of primary lymphoma. MYC inactivation leads to a decrease in apoptosis in MYC, MYC p19ARF−/− and MYC p53−/− lymphomas. Graph shows TUNEL positive area as normalized to DAPI. Upon 5 days of MYC inactivation, TUNEL positive cells decreased in MYC, MYC p19ARF−/− and MYC p53−/− lymphoma. There was no significant difference between MYC p53−/− and MYC lymphomas (MYC off, p = 0.9) or between MYC p19ARF−/− and MYC lymphomas (MYC off, p = 0.059). (C) Tumor vessel density assessed by CD31 immunohistochemistry on transplanted lymphoma cell lines in syngeneic hosts before and during MYC inactivation time course. Graph shows percentage of CD31 positively stained area. MYC tumors exhibit dramatically reduced CD31 staining upon MYC inactivation. MYC p19ARF−/− and MYC p53−/− tumors show elevated CD31 staining compared to MYC tumors both before and after MYC inactivation. (D) Tumor vessel density assessed by CD31 immunohistochemistry on transplanted lymphoma cell lines in immunodeficient RAG−/− hosts.
Figure 5
Figure 5. Loss of p19ARF prevents MYC inactivation induced senescence in vivo
(A) SA-beta-galactosidase staining on sections of primary lymphoma. MYC inactivation induces SA-beta-galactosidase activity in MYC and MYC p53−/−, but not MYC p19ARF−/− lymphoma. Graph shows quantitation of SA-beta-galactosidase positivity. After MYC inactivation, MYC p19ARF−/− lymphoma had significantly lower SA-beta-galactosidase activity than MYC lymphoma (p = 0.002), while MYC p53−/− lymphoma was not significantly different from MYC lymphoma (p = 0.3). (B) p16INK4A immunohistochemistry on sections of primary lymphoma. MYC inactivation induces an increase in p16INK4A levels in MYC lymphoma, and to a lesser extent, in MYC p53−/− lymphoma, but not in MYC p19ARF−/− lymphoma. Graph shows quantitation of p16INK4A expression. After MYC inactivation, MYC p19ARF−/− lymphoma had significantly lower p16INK4A expression than MYC lymphoma (p = 0.025), while MYC p53−/− lymphoma was not significantly different from MYC lymphoma (p = 0.4). (C) H3K9 trimethylation increased upon MYC inactivation in MYC tumors, but not in MYC p53−/− and MYC p19ARF−/− tumors as measured by Western blot.
Figure 6
Figure 6. Microarray suggests deregulation of senescence and innate immune cell infiltration into MYC p19ARF−/− tumors
Microarray analysis was performed before and after 24 hours of MYC inactivation in MYC, MYC p19ARF−/−, and MYC 53−/− lymphoma cells derived from primary tumors. (A) Hierarchal clustering of MYC transactivation targets (top panel) and hierarchal clustering of MYC transrepression targets (bottom panel). No global differences were seen in regulation of MYC target genes between MYC, MYC p19ARF−/−, and MYC p53−/−. (B) RT-qPCR results of specific MYC target genes. No significant difference was seen in the expression of these target genes between MYC, MYC p53−/−, and MYC p19ARF−/− tumors. (C) Summary table of key Genespring pathway analysis conducted on microarray results for significant differentially expressed genes in the MYC, MYC p53−/−, and MYC p19ARF−/− tumors. Senescence/cell aging pathway and innate immune cell activation/infiltration pathways were found to be significantly enriched in MYC and MYC p53−/− tumors, but not in MYC p19ARF−/− tumors. (D) Immunohistochemistry for F4/80, a marker for macrophages, performed on time course sections from transplanted tumors before and after MYC inactivation. MYC p19ARF−/− tumors exhibit dramatically reduced macrophage infiltration before and after MYC inactivation compared to MYC and MYC p53−/− tumors (MYC off p = 0.001 and p = 0.003, respectively). (E) List of genes associated with macrophages in MYC and MYC p53−/−, but not in MYC p19ARF−/−, tumors.
Figure 7
Figure 7. Microarray signature associated with loss of p19ARF predicts poor event free survival in B- and T-ALL patients and model showing the mode of recurrence of MYC p19ARF−/− and MYC p53−/− lymphomas
(A) Venn diagram shows common and unique genes that are upregulated by MYC in MYC, MYC p19ARF−/− and MYC p53−/− mouse lymphomas. Genes that have a MYC on/MYC off expression ratio of +/− 2-fold in MYC, MYC p19ARF−/− and MYC p53−/− mouse lymphomas are shown. MYC p19ARF−/− unique gene signature was identified. (B) Human B- and T-ALL patients from the cohort collected by the de Ridder laboratory (GSE18497) for the Diagnosis of ALL Relapse study were divided into two groups by k-means clustering according to their expression of the genes within the MYC p19−/− unique gene signature. The two groups were then stratified via Kaplan-Meier survival analysis for relapse free survival, revealing that patients overexpressing the MYC p19−/− unique gene signature display a significantly lower relapse free survival than those that showed lower expression of the signature genes. (C) Human B- and T-ALL patients from the cohort collected by the Willman laboratory (GSE11877) for the Children's Oncology Group Study 9906 for High-Risk Pediatric ALL were divided into two groups by k-means clustering similar to the first data set and then stratified via Kaplan-Meier survival analysis for overall survival, revealing that there was no significant difference between the two patient groups based on overall survival. (D) The two groups were then stratified via Kaplan-Meier survival analysis for event free survival based on the same k-means clustering for C. This analysis revealed that patients overexpressing the MYC p19−/− unique gene signature showed a significantly lower event free survival (shorter time to relapse) than those that showed lower expression of the signature genes. (E) Model showing MYC, MYC p19ARF−/− and MYC p53−/− lymphomas respond to MYC inactivation differently. MYC lymphomas undergo sustained regression and remain in remission due to senescence of lymphoma cells and decrease in microvessel density. MYC p19ARF−/− and MYC p53−/− lymphomas both fail to undergo sustained regression and eventually reoccur; albeit through different mechanisms. MYC p19ARF−/− lymphomas reoccur through evasion of MYC inactivation induced senescence, while MYC p53−/− lymphomas reoccur through sustained angiogenesis despite MYC inactivation.

Similar articles

Cited by

References

    1. Einsiedel HG, von Stackelberg A, Hartmann R, Fengler R, Schrappe M, Janka-Schaub G, Mann G, Hahlen K, Gobel U, Klingebiel T, Ludwig WD, Henze G. Long-term outcome in children with relapsed ALL by risk-stratified salvage therapy: results of trial acute lymphoblastic leukemia-relapse study of the Berlin-Frankfurt-Munster Group 87. J Clin Oncol. 2005;23:7942–7950. - PubMed
    1. Erikson J, Finger L, Sun L, ar-Rushdi A, Nishikura K, Minowada J, Finan J, Emanuel BS, Nowell PC, Croce CM. Deregulation of c-myc by translocation of the alpha-locus of the T-cell receptor in T-cell leukemias. Science. 1986;232:884–886. - PubMed
    1. Felsher DW, Bishop JM. Reversible tumorigenesis by MYC in hematopoietic lineages. Mol Cell. 1999;4:199–207. - PubMed
    1. Weinstein IB. Cancer. Addiction to oncogenes—the Achilles heal of cancer. Science. 2002;297:63–64. - PubMed
    1. Felsher DW. MYC Inactivation Elicits Oncogene Addiction through Both Tumor Cell-Intrinsic and Host-Dependent Mechanisms. Genes Cancer. 2010;1:597–604. - PMC - PubMed

Publication types

MeSH terms

Substances