Enhancement of dynamin polymerization and GTPase activity by Arc/Arg3.1
- PMID: 25783003
- PMCID: PMC4398645
- DOI: 10.1016/j.bbagen.2015.03.002
Enhancement of dynamin polymerization and GTPase activity by Arc/Arg3.1
Abstract
Background: The Activity-regulated cytoskeleton-associated protein, Arc, is an immediate-early gene product implicated in various forms of synaptic plasticity. Arc promotes endocytosis of AMPA type glutamate receptors and regulates cytoskeletal assembly in neuronal dendrites. Its role in endocytosis may be mediated by its reported interaction with dynamin 2, a 100 kDa GTPase that polymerizes around the necks of budding vesicles and catalyzes membrane scission.
Methods: Enzymatic and turbidity assays are used in this study to monitor effects of Arc on dynamin activity and polymerization. Arc oligomerization is measured using a combination of approaches, including size exclusion chromatography, sedimentation analysis, dynamic light scattering, fluorescence correlation spectroscopy, and electron microscopy.
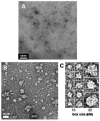
Results: We present evidence that bacterially-expressed His6-Arc facilitates the polymerization of dynamin 2 and stimulates its GTPase activity under physiologic conditions (37°C and 100mM NaCl). At lower ionic strength Arc also stabilizes pre-formed dynamin 2 polymers against GTP-dependent disassembly, thereby prolonging assembly-dependent GTP hydrolysis catalyzed by dynamin 2. Arc also increases the GTPase activity of dynamin 3, an isoform of implicated in dendrite remodeling, but does not affect the activity of dynamin 1, a neuron-specific isoform involved in synaptic vesicle recycling. We further show in this study that Arc (either His6-tagged or untagged) has a tendency to form large soluble oligomers, which may function as a scaffold for dynamin assembly and activation.
Conclusions and general significance: The ability of Arc to enhance dynamin polymerization and GTPase activation may provide a mechanism to explain Arc-mediated endocytosis of AMPA receptors and the accompanying effects on synaptic plasticity.
Keywords: Arc/Arg3.1; Dynamin; GTPase; Self-assembly.
Copyright © 2015 Elsevier B.V. All rights reserved.
Figures


Similar articles
-
The mechanistic link between Arc/Arg3.1 expression and AMPA receptor endocytosis.Semin Cell Dev Biol. 2018 May;77:17-24. doi: 10.1016/j.semcdb.2017.09.005. Epub 2017 Sep 7. Semin Cell Dev Biol. 2018. PMID: 28890421 Review.
-
The proline/arginine-rich domain is a major determinant of dynamin self-activation.Biochemistry. 2010 Dec 21;49(50):10592-4. doi: 10.1021/bi101343p. Epub 2010 Nov 23. Biochemistry. 2010. PMID: 21082776 Free PMC article.
-
Dynamin GTPase domain mutants that differentially affect GTP binding, GTP hydrolysis, and clathrin-mediated endocytosis.J Biol Chem. 2004 Sep 24;279(39):40431-6. doi: 10.1074/jbc.M407007200. Epub 2004 Jul 19. J Biol Chem. 2004. PMID: 15262989
-
Ubiquitously expressed dynamin-II has a higher intrinsic GTPase activity and a greater propensity for self-assembly than neuronal dynamin-I.Mol Biol Cell. 1997 Dec;8(12):2553-62. doi: 10.1091/mbc.8.12.2553. Mol Biol Cell. 1997. PMID: 9398675 Free PMC article.
-
Oligomerization and kinetic mechanism of the dynamin GTPase.Eur Biophys J. 2002 Jul;31(4):275-82. doi: 10.1007/s00249-002-0226-2. Epub 2002 Jun 18. Eur Biophys J. 2002. PMID: 12122474 Review.
Cited by
-
Mimicking Protein Kinase C Phosphorylation Inhibits Arc/Arg3.1 Palmitoylation and Its Interaction with Nucleic Acids.Int J Mol Sci. 2024 Jan 8;25(2):780. doi: 10.3390/ijms25020780. Int J Mol Sci. 2024. PMID: 38255853 Free PMC article.
-
Metastasis Suppressors NME1 and NME2 Promote Dynamin 2 Oligomerization and Regulate Tumor Cell Endocytosis, Motility, and Metastasis.Cancer Res. 2019 Sep 15;79(18):4689-4702. doi: 10.1158/0008-5472.CAN-19-0492. Epub 2019 Jul 16. Cancer Res. 2019. PMID: 31311812 Free PMC article.
-
Palmitoylation-regulated interactions of the pseudokinase calmodulin kinase-like vesicle-associated with membranes and Arc/Arg3.1.Front Synaptic Neurosci. 2022 Jul 28;14:926570. doi: 10.3389/fnsyn.2022.926570. eCollection 2022. Front Synaptic Neurosci. 2022. PMID: 35965782 Free PMC article.
-
Dynamic Arc SUMOylation and Selective Interaction with F-Actin-Binding Protein Drebrin A in LTP Consolidation In Vivo.Front Synaptic Neurosci. 2017 May 10;9:8. doi: 10.3389/fnsyn.2017.00008. eCollection 2017. Front Synaptic Neurosci. 2017. PMID: 28553222 Free PMC article.
-
Palmitoylation and Membrane Binding of Arc/Arg3.1: A Potential Role in Synaptic Depression.Biochemistry. 2018 Feb 6;57(5):520-524. doi: 10.1021/acs.biochem.7b00959. Epub 2017 Dec 26. Biochemistry. 2018. PMID: 29264923 Free PMC article.
References
-
- Bredt DS, Nicoll RA. AMPA receptor trafficking at excitatory synapses. Neuron. 2003;40:361–379. - PubMed
-
- Lyford GL, Yamagata K, Kaufman WE, Barnes CA, Sanders LK, Copeland NG, Gilbert DJ, Jenkins NA, Lanahan AA, Worley PF. Arc, a growth factor and activity-regulated gene, encodes a novel cytoskeleton-associated protein that is enriched in neuronal dendrites. Neuron. 1995;14:433–445. - PubMed
-
- Tzingounis AV, Nicoll RA. Arc/Arg3.1: linking gene expression to synaptic plasticity and memory. Neuron. 2006;53:403–407. - PubMed
Publication types
MeSH terms
Substances
Grants and funding
LinkOut - more resources
Full Text Sources
Other Literature Sources
Molecular Biology Databases
Research Materials

