

Classification of voluntary cough airflow patterns for prediction of abnormal spirometry
- PMID: 25781965
- PMCID: PMC4860154
- DOI: 10.1109/JBHI.2015.2412880
Classification of voluntary cough airflow patterns for prediction of abnormal spirometry
Abstract
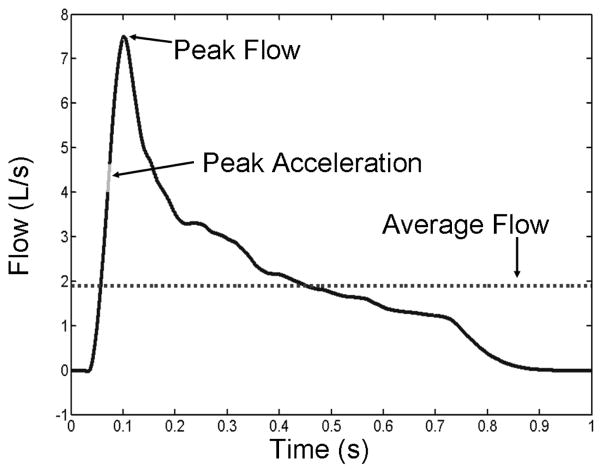
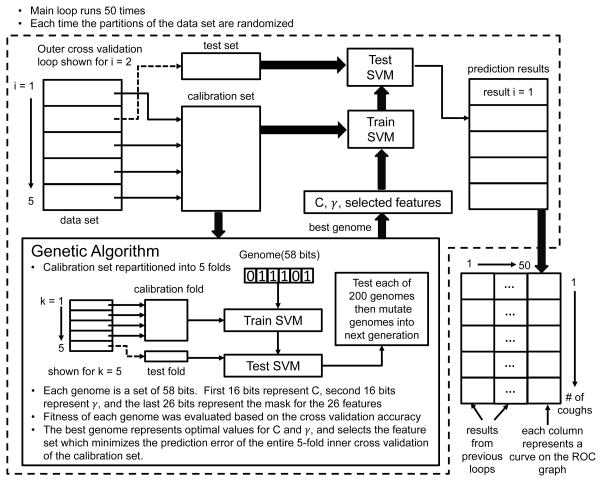
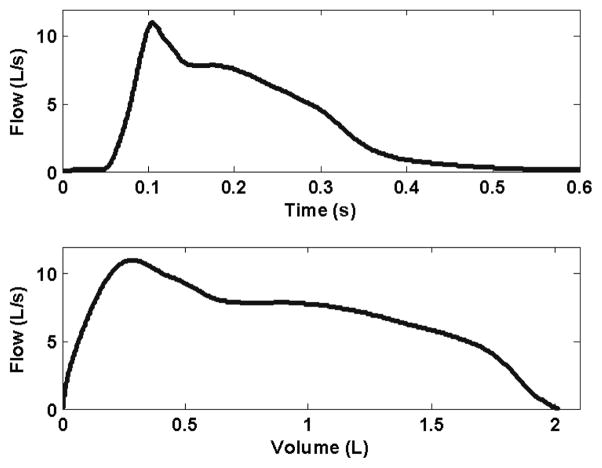
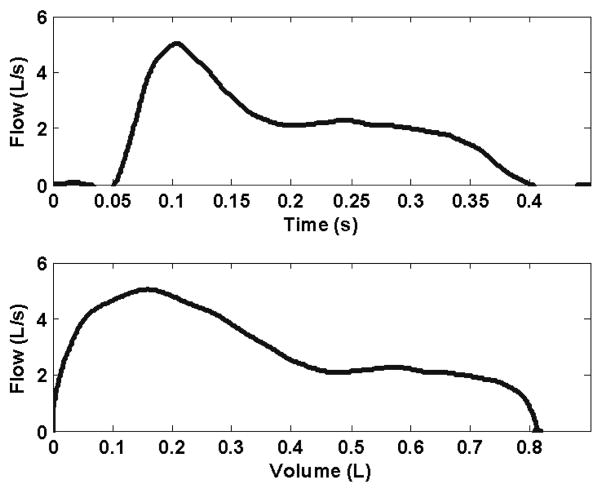
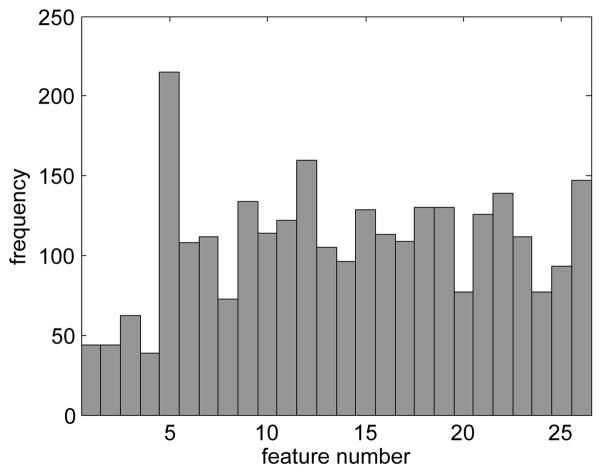
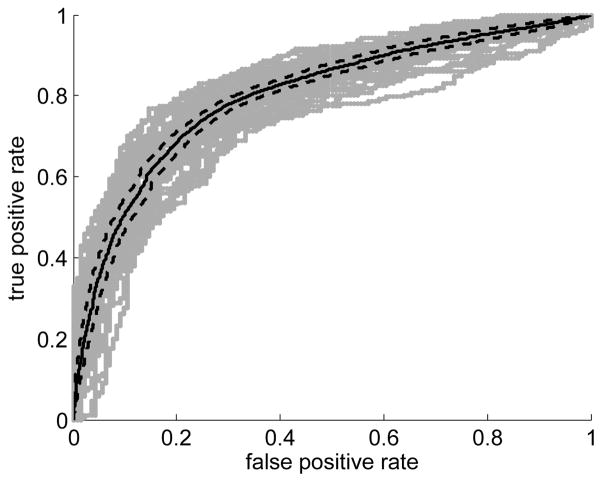
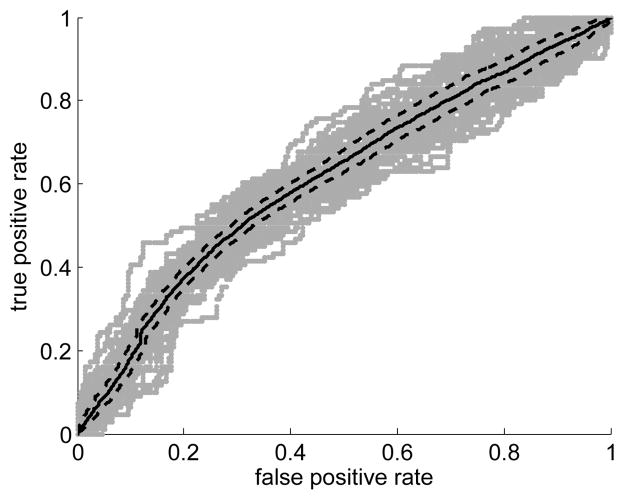
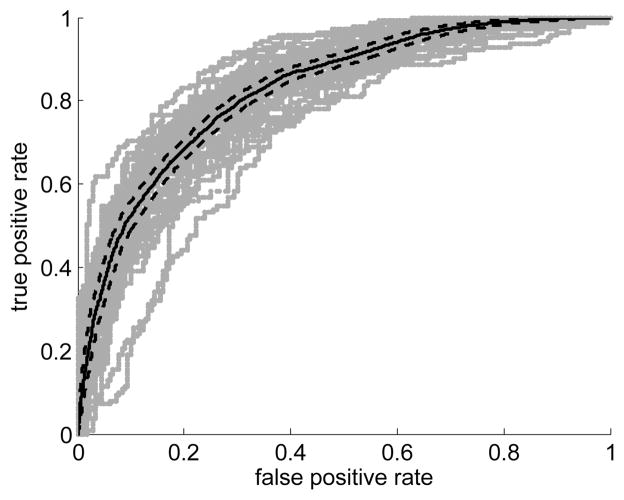
Measurement of partial expiratory flow-volume curves has become an important technique in diagnosing lung disease, particularly in children and in the elderly. The objective of this study was to investigate the feasibility of predicting abnormal spirometry using the partial flow-volume curve generated during a voluntary cough. Here, abnormal spirometry is defined as less than the lower limit of normal (LLN) predicted by standard reference equations [1]. Cough airflow signals of 107 subjects (56 male, 51 female) were previously collected [2] from patients performing spirometry in a pulmonary function clinic. A variety of features were extracted from the airflow signal. A support vector machine (SVM) classifier was developed to predict abnormal spirometry. Airflow signal features and SVM parameters were selected using a genetic algorithm. The ability of the classifier to distinguish between normal and abnormal spirometry based on cough flow was evaluated by comparing the classifiers decisions with the LLN for the given subject's spirometry, including forced expiratory volume in one second (FEV1), forced vital capacity (FV C), and their ratio (FEV1=FV C%). Findings indicated that it was possible to classify patients whose spirometry results were less than the LLN with an overall accuracy of 76% for FEV1, 65% for FV C, and 76% for the ratio FEV1=FV C%. Accuracies were determined by repeated double cross-validation [3]. This study demonstrates the potential of using airflow measured during voluntary coughing to identify test subjects with abnormal spirometry.
Figures
Similar articles
-
Substantial variation exists in spirometry interpretation practices for airflow obstruction in accredited lung function laboratories across Australia and New Zealand.Intern Med J. 2019 Jan;49(1):41-47. doi: 10.1111/imj.14047. Intern Med J. 2019. PMID: 30043534
-
Predicted lower limit of normal reduces misclassification risk of airflow limitation in asymptomatic elderly never-smokers.Chin Med J (Engl). 2013;126(18):3486-92. Chin Med J (Engl). 2013. PMID: 24034095
-
Lung function, forced expiratory volume in 1 s decline and COPD hospitalisations over 44 years of follow-up.Eur Respir J. 2016 Mar;47(3):742-50. doi: 10.1183/13993003.01575-2015. Epub 2015 Dec 2. Eur Respir J. 2016. PMID: 26647443
-
Lower limit of normal or FEV1/FVC < 0.70 in diagnosing COPD: an evidence-based review.Respir Med. 2011 Jun;105(6):907-15. doi: 10.1016/j.rmed.2011.01.008. Epub 2011 Feb 5. Respir Med. 2011. PMID: 21295958 Review.
-
Chronic obstructive pulmonary disease with mild airflow limitation: current knowledge and proposal for future research - a consensus document from six scientific societies.Int J Chron Obstruct Pulmon Dis. 2017 Aug 29;12:2593-2610. doi: 10.2147/COPD.S132236. eCollection 2017. Int J Chron Obstruct Pulmon Dis. 2017. PMID: 28919728 Free PMC article. Review.
Cited by
-
Label Self-Advised Support Vector Machine (LSA-SVM)-Automated Classification of Foot Drop Rehabilitation Case Study.Biosensors (Basel). 2019 Sep 27;9(4):114. doi: 10.3390/bios9040114. Biosensors (Basel). 2019. PMID: 31569694 Free PMC article.
References
-
- Hankinson J, Odencrantz J, Fedan K. Spirometric reference values from a sample of the general u.s. population. Am J Respir Crit Care Med. 1999;159:179–187. - PubMed
-
- Filzmoser P, Liebmann B, Varmuza K. Repeated double cross validation. J Chemometrics. 2009;23:160–171.
-
- Hammer E, Eber E. Pediatric Pulmonary Function Testing (Progress in Respiratory Research) S Karger AG; 2005.
-
- Leith D, Butler J, Sneddon S, Brain J. Handbook of Physiology. The Respiratory System. Control of Breathing. Section 1, Volume II, part 1. American Physiological Socity; 1986. Cough; pp. 315–336.
Grants and funding
LinkOut - more resources
Full Text Sources
Other Literature Sources
