. 2015 Mar 16:6:6379.
doi: 10.1038/ncomms7379.

IRF8 directs stress-induced autophagy in macrophages and promotes clearance of Listeria monocytogenes

Affiliations

IRF8 directs stress-induced autophagy in macrophages and promotes clearance of Listeria monocytogenes

Monica Gupta et al. Nat Commun. .

Abstract

Autophagy, activated by many stresses, plays a critical role in innate immune responses. Here we show that interferon regulatory factor 8 (IRF8) is required for the expression of autophagy-related genes in dendritic cells. Furthermore in macrophages, IRF8 is induced by multiple autophagy-inducing stresses, including IFNγ and Toll-like receptor stimulation, bacterial infection, starvation and by macrophage colony-stimulating factor. IRF8 directly activates many genes involved in various steps of autophagy, promoting autophagosome formation and lysosomal fusion. Consequently, Irf8(-/-) macrophages are deficient in autophagic activity, and excessively accumulate SQSTM1 and ubiquitin-bound proteins. We show that clearance of Listeria monocytogenes in macrophages requires IRF8-dependent activation of autophagy genes and subsequent autophagic capturing and degradation of Listeria antigens. These processes are defective in Irf8(-/-) macrophages where uninhibited bacterial growth ensues. Together these data suggest that IRF8 is a major autophagy regulator in macrophages, essential for macrophage maturation, survival and innate immune responses.


Conflict of interest statement

Conflict of interest: The authors declare that they have no conflict of interest.

Figures

Figure 1
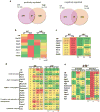
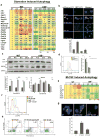
Figure 1. Microarray analyses reveal a role of IRF8 in autophagy
(a) The Venn diagrams depict the number of genes positively and negatively regulated by IRF8 in untreated (UT) DCs and those treated with TLR ligands for 6 h identified by microarray analysis. Overlapped regions represent the number of genes positively or negatively regulated both in untreated and TLR stimulated DCs. See GO classification in Supplementary Fig. 1a,b. (b) IRF8 dependent autophagy genes identified by microarray analysis. Differentially expressed genes were identified by one-way ANOVA (p-value≤0.05 & fold change ≥2). Color gradients indicate average signal intensities of genes in log2 scale. Normalization was performed by GeneChip Operating Software (GCOS) and Expression Console software's. relative to the Untreated (UT). (c) qRT-PCR analysis of IRF8 dependent autophagy genes in DCs. WT and Irf8-/- DCs were stimulated with the TLR ligands for 6 h. The numbers represent transcript levels normalized by gapdh levels. Data represents the average of three independent assays. p-value ≤0.01., Student's t-test. (d) qRT-PCR analysis of IRF8 dependent autophagy genes in MΦs. WT and Irf8-/- MΦs were treated overnight with IFNγ and stimulated with TLR ligands for the indicated times. The number in each box represents transcript levels normalized by the value of untreated WT cells. Values are the average of three independent assays. p-value ≤0.01(Student's t-test). See autophagy genes not affected by IRF8 in Supplementary Fig. 2. (e) Irf8-/- MΦs were transduced with pMSCV retroviral vector containing WT Irf8 or mutant Irf8 (K79E), and stimulated with IFNγ/TLR for 8 h. Relative expression of indicated autophagy genes was detected by qRT-PCR. The numbers represent transcript levels normalized by those of cells transduced with empty vector. Irf8 expression was normalized by gapdh. Values are the average of three experiments. p-value ≤0.05 (Student's t-test). Il12b and Hprt were tested as controls.
Figure 2
Figure 2. IRF8 binds to the promoters of autophagy genes
(a) Consensus IRF8 binding motifs are shown in bold on indicated autophagy gene promoters. (b) IRF8 binding to the above motifs was detected by ChIP for WT and Irf8-/- MΦs (untreated or treated with IFNγ/TLR) normalized by normal IgG binding, and with the β–globin as a negative control. Values represent the average of five independent experiments. *p-value ≤0.05 and **p-value ≤0.01. (Student's t-test). (c) Summary of microarray, rescue experiment and ChIP assays.
Figure 3
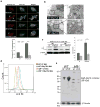
Figure 3. Defective autophagosome formation in Irf8-/- MΦs
(a) LC3 vesicles were visualized in WT and Irf8-/- MΦs expressing mCherry-EGFP-LC3 vector, without (UT) or with IFNγ/TLR stimulation for 8 h. Bafilomycin A1 (200 nM) was added for final 2 h. Cells were counterstained for DNA (blue). The scale bar: 20 μm. Below: The number of cells with more than five mCherry-positive vesicles was counted by microscopic inspection of more than 200 cells. The values represent the percentage of cells with fluorescent vesicles. **p-value ≤0.01 (Student's t-test). See Supplementary Fig. 3a for endogenous staining of LC3. (b) WT and Irf8-/- MΦs treated with IFNγ overnight followed by TLR ligands for 8 h was inspected by transmission electron microscopy. The bracketed region in the left panel was enlarged in the right panel. Arrows indicate autophagic vacuoles. The scale bar: 0.5 μm. (c) Reduced LC3I to LC3II conversion in Irf8-/- MΦs. WT and Irf8-/- MΦs were treated with IFNγ/TLR as above with bafilomycin A1 (200 nM) treatment for the final 2 h. Immunoblot analysis was performed with 10 μg of extracts with β-Tubulin as a control. Right panel: The amounts of LC3II in three independent samples were quantified using the ImageJ software. *p-value ≤0.05 and **p-value ≤0.01(Student's t-test). See Supplementary Fig. 3b for LC3 amount in the absence of bafilomycin A1. (d) Membrane bound LC3 in WT and Irf8-/- MΦs treated with IFNγ/TLR was detected by flow cytometry. Bafilomycin A1 (200 nM) was added for the final 2 h and. The histogram is a representative of three independent experiments. BA1: Bafilomycin A1. See Supplementary Fig. 3c for LC3 amount in the absence of bafilomycin A1. (e) Immunoblot detection of ATG5-ATG12 conjugate. WT and Irf8-/- MΦs were treated as above and immunoblot detection of ATG5-ATG12 conjugate proteins was performed. Ten microgram of extracts was tested with antibody against ATG5 or β-Tubulin.
Figure 4
Figure 4. Defective autophagosome maturation in Irf8-/- MΦs
(a) Immunostaining of LAMP2 in WT and Irf8-/- MΦs stimulated with IFNγ overnight and TLR ligands for 8 h. Cells were counterstained for DNA (blue). The scale bar: 20 μm. (b) Immunoblot detection of LAMP2 in WT and Irf8-/- MΦs. Ten microgram of extracts was tested with antibody against LAMP2 or β-Tubulin. Below: The amounts of LAMP2 in three independent experiments were quantified using the ImageJ software. **p-value ≤0.01 (c) WT and Irf8-/- MΦs were immunostained for LC3 antibody and LysoTracker red to detect LC3-positive and Lysosome-positive structures. Below: Cells with double positive vesicles were quantified as in Fig. 3a. Data represents the average of three independent experiments. p-value ≤0.01 (**).The scale bar: 20 μm.
Figure 5
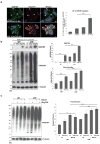
Figure 5. SQSTM1 and ubiquitin-conjugated proteins form aggregates in Irf8-/- MΦs
(a) SQSTM1- and ubiquitin-positive proteins (arrow heads) in WT and Irf8-/- MΦs stimulated with IFNγ overnight and TLR ligands for 8 h were visualized by immunostaining. Bafilomycin A1 (200 nM) was added for final 2 h. Cells were counterstained for DNA (blue). Right panel: The percentage of cells with SQSTM1- and ubiquitin-positive aggregates. Data represent the average of three independent experiments +/- S.D with **p-value ≤0.01 (Student's t-test). (b) Immunoblot detection of SQSTM1- and ubiquitin-positive proteins in WT and Irf8-/- MΦs stimulated with IFNγ or IFNγ/TLR for 8 h. Bafilomycin A1 (200 nM) was added for final 2 h. Right panel: Relative amounts of ubiquitin-bound proteins. Data represent the average of three independent experiments +/- S.D with **p-value ≤ 0.01 (Student's t-test). See Supplementary Fig. 3b for immunoblot detection of SQSTM1 in the absence of bafilomycin A1. (c) Immunoblot detection of ubiquitin-bound proteins in the presence of MG132. WT and Irf8-/- MΦs were stimulated with IFNγ/TLR in the presence of 10 μM of MG132. Right panel: Relative amounts of ubiquitin bound proteins. Data represents the average of three independent experiments +/- S.D with *p-value ≤0.05 and **p-value ≤0.01 (Student's t-test).
Figure 6
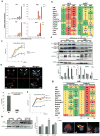
Figure 6. IRF8 is required for autophagic clearance of Listeria
(a) WT and Irf8-/- MΦs (10) were infected with Listeria (5×10) and bacterial transcripts were detected by qRT-PCR, normalized by Gapdh. Data represent the average of three independent experiments. p-value ≤ 0.05 (Student's t-test). (b) Autophagy gene expression in indicated MΦs was detected as above and normalized to those in uninfected WT MΦs. Data represent the average of three independent experiments. p-value ≤ 0.05 (Student's t-test). (c) Bacterial yields tested by the colony forming unit (cfu) assay. Some WT MΦs were treated with bafilomycin A1 (200 nM). Values represent the average of three determinations +/- S.D. (d) Immunoblot analysis of LC3 and SQSTM1 in Listeria infected WT and Irf8-/- MΦs in the presence of bafilomycin A1 (200 nM). Below: Amounts of LC3 and SQSTM1 from three independent samples were quantified by ImageJ software. **p-value ≤0.01(Student's t-test). See Supplementary Fig. 7a for LC3 and SQSTM1 amounts in the absence of bafilomycin A1. (e) Distribution of Listeria antigens and LC3 after 36 h of Listeria infection in immunostaining. Arrow heads: LC3-associated Listeria. The scale bar: 20 μm. Below: The percentage of cells showing co-localization of LC3 and Listeria antigens. Values represent the average of three independent experiments +/- S.D with **p ≤0.01 (Student's t-test). (f) Bacterial yields in MΦs infected with Listeria for 24 h and treated with Act D (2 μg/ml). Data represent the average of three determinations +/- S.D. See Supplementary Fig. 8 for details of Act D effects. (g) Irf8-/- MΦs transduced with Irf8 vector were infected with Listeria for 36 h and autophagy gene expression was detected as above. The numbers represent transcript levels normalized by those with empty vector. Irf8 transcripts were normalized by gapdh. Values are the average of three experiments. p-value ≤0.05 (Student's t-test). Hprt: a negative control. (h) Left and middle: Irf8-/- MΦs transduced as above were tested for LC3II using GAPDH as a control. The amounts of LC3II in two independent experiments were quantified using ImageJ software. **p-value ≤0.01(Student's t-test). Right: Irf8-/- MΦs expressing mCherry-EGFP-LC3 were transduced as above and infected with Listeria for 36 h and fluorescent LC3 signals was visualized by confocal microscopy. See Supplementary Fig. 7b for microscopy image with controls.
Figure 7
Figure 7. IRF8 stimulates starvation and M-CSF induced autophagy
(a) Autophagy gene expression in WT and Irf8-/- MΦs after starvation was detected by qRT-PCR and normalized by transcript values in untreated WT cells. The number represents the average of three independent experiments. p-value ≤ 0.05 (Student's t-test). (b) WT and Irf8-/- MΦs expressing mCherry-EGFP LC3 after starvation for 6 h and LC3 fluorescence signals (arrow heads) were visualized. Below: The percentage of cells with double positive LC3 signals. Data represent the average of three independent experiments. **p-value ≤0.01(Student's t-test). The scale bar: 20 μm. See Supplementary Fig. 10d for LC3 fluorescence signals in the presence of bafilomycin A1. (c) Immunoblot detection of LC3II and SQSTM1 in starved WT and Irf8-/- MΦs. Below: The amounts of total LC3 and SQSTM1 in three independent samples quantified by ImageJ software. *p-value ≤0.05 and **p-value ≤0.01(Student's t-test). See Supplementary Fig. 10c for LC3 and SQSTM1 amounts in the presence of bafilomycin A1. (d) Left panel: membrane bound LC3 in WT and Irf8-/- MΦs after 2 h starvation was detected by flow cytometry. UT: untreated cells. The histogram is a typical example of three independent experiments. Right panel: Mean fluorescence intensity of membrane bound LC3. Values represent the mean of three independent experiments. **p-value ≤0.01(Student's t-test). See Supplementary Fig. 10e for FACS detection in the presence of bafilomycin A1. (e) Autophagy gene expression in WT and Irf8-/- BM cells cultured in M-CSF was detected by qRT-PCR, and transcripts were normalized by values in WT cells on day 0. The number represents the average of three independent experiments. p -value≤0.05 (Student's t-test). (f) Membrane bound LC3 in WT and Irf8-/- MΦs cultured in M-CSF for 4 days was detected by flow cytometry. The histogram is a typical example of three independent experiments. Similar results were observed with MΦs on day 3 and day 5 (See Supplementary Fig. 11a). (g) LC3 vesicles in WT and Irf8-/- MΦs cultured in M-CSF for 3 days was detected by immunostaining. Below: The percentage of cells bearing LC3 vesicles. **p-value ≤0.01(Student's t-test). The scale bar: 20 μm. (h) Expression of F4/80 and CD11b was detected in WT and Irf8-/- MΦs cultured in M-CSF for 3 days by flow cytometry. Chloroquin (CQ, 50 μM) was added in the middle panel for the final 18 h. Similar results were observed in three independent experiments.
Figure 8
Figure 8. A model for IRF8 dependent autophagy in MΦs
Upon various stresses (IFNγ/TLR stimulation, Listeria infection, starvation and M-CSF stimulation), IRF8 is activated and promotes the expression of a series of autophagy genes. These genes encode factors active at various stages of autophagy, largely covering the whole autophagic cascade. Irf8-/- MΦs are defective in autophagic activation and fail to degrade target ubiquitin conjugated factors, organelle and intracellular pathogens. Together, IRF8 acts as an autophagy master regulator in MΦs to coordinate stress responses critical for innate immunity.

Similar articles

Cited by

References

    1. He C, Klionsky DJ. Regulation mechanisms and signaling pathways of autophagy. Annu Rev Genet. 2009;43:67–93. - PMC - PubMed
    1. Mizushima N, Yoshimori T, Ohsumi Y. The role of Atg proteins in autophagosome formation. Annu Rev Cell Dev Biol. 2011;27:107–132. - PubMed
    1. Delgado MA, Deretic V. Toll-like receptors in control of immunological autophagy. Cell Death Differ. 2009;16:976–983. - PMC - PubMed
    1. Levine B, Mizushima N, Virgin HW. Autophagy in immunity and inflammation. Nature. 2011;469:323–335. - PMC - PubMed
    1. Matsuzawa T, et al. IFN-gamma elicits macrophage autophagy via the p38 MAPK signaling pathway. J Immunol. 2012;189:813–818. - PMC - PubMed

Publication types

MeSH terms