. 2015 Mar 13;5(5):911-20.
doi: 10.1534/g3.115.017178.

A Powerful New Quantitative Genetics Platform, Combining Caenorhabditis elegans High-Throughput Fitness Assays with a Large Collection of Recombinant Strains

Affiliations

A Powerful New Quantitative Genetics Platform, Combining Caenorhabditis elegans High-Throughput Fitness Assays with a Large Collection of Recombinant Strains

Erik C Andersen et al. G3 (Bethesda). .

Abstract

The genetic variants underlying complex traits are often elusive even in powerful model organisms such as Caenorhabditis elegans with controlled genetic backgrounds and environmental conditions. Two major contributing factors are: (1) the lack of statistical power from measuring the phenotypes of small numbers of individuals, and (2) the use of phenotyping platforms that do not scale to hundreds of individuals and are prone to noisy measurements. Here, we generated a new resource of 359 recombinant inbred strains that augments the existing C. elegans N2xCB4856 recombinant inbred advanced intercross line population. This new strain collection removes variation in the neuropeptide receptor gene npr-1, known to have large physiological and behavioral effects on C. elegans and mitigates the hybrid strain incompatibility caused by zeel-1 and peel-1, allowing for identification of quantitative trait loci that otherwise would have been masked by those effects. Additionally, we optimized highly scalable and accurate high-throughput assays of fecundity and body size using the COPAS BIOSORT large particle nematode sorter. Using these assays, we identified quantitative trait loci involved in fecundity and growth under normal growth conditions and after exposure to the herbicide paraquat, including independent genetic loci that regulate different stages of larval growth. Our results offer a powerful platform for the discovery of the genetic variants that control differences in responses to drugs, other aqueous compounds, bacterial foods, and pathogenic stresses.

Keywords: C. elegans; QTL mapping; fitness assays; high-throughput phenotyping.


Figures

Figure 1
Figure 1
An overview of the high-throughput analysis pipeline is shown. Animals are grown on plates for five generations without starvation and then single hermaphrodites are picked to wells of a 96-well microtiter plate. The microtiter plate either has no compound (control) or paraquat added. Animals are grown for 96 hr at which point M9 solution with sodium azide is added to kill the nematodes and straighten them out. Each well is aspirated using the ReFLx module of the COPAS BIOSORT and animals are measured for length (time of flight), optical density (extinction), and three fluorescence measures. Raw data are read in, processed, and plotted using the COPASutils R package. Example length and optical density data are shown from one 96-wel plate with animals in every well except wells in columns 4, 8, and 12.
Figure 2
Figure 2
(A) Tukey box plots of N2 (orange), CB4856 (blue), and recombinant inbred advanced intercross lines (RIAILs; gray) normalized fecundity data. The total number of offspring from twenty replicates of each parent and 357 RIAILs were counted. The fecundities of the RIAILs show transgressive segregation. (B) Linkage mapping results of normalized fecundity in control conditions are shown with genomic position (Mb) on the x-axis and logarithm of odds (LOD) score on the y-axis. The tick marks on the x-axis denote every 5 Mb. Each chromosome is in its own box labeled on top. The dotted red line is the LOD threshold for 5% FDR obtained by permuting the phenotype data and mapping 1000 times. The red triangle denotes the peak QTL marker, and the blue bar shows the 95% QTL confidence interval. FDR, false discovery rate; QTL, quantitative trait loci.
Figure 3
Figure 3
Summary statistics of body length map to different genomic regions implicating unique genetic variants. (A) Histograms of the length of every animal measured for 10 randomly chosen RIAILs are shown. The data for each RIAIL are in separate boxes with the strain name in bold above. The colored vertical lines denote population summary statistics, 10th quantile (red), 25th quantile (orange), median (yellow), 75th quantile (blue), 90th quantile (purple), and interquartile range (gray). The color of the vertical line matches the color of the chromosome label titles on top of the linkage mapping results for each trait. The genetic architectures differ when variation of size trait changes. B. Linkage mapping results of the 10th quantile of body length in control conditions are shown with genomic position (Mb) on the x-axis and logarithm of odds (LOD) score on the y-axis. The tick marks on the x-axis denote every 5 Mb. Each chromosome is in its own box labeled on top. The dotted red line is the LOD threshold for 5% FDR obtained by permuting the phenotype data and mapping 1000 times. The red triangle denotes the peak QTL marker, and the blue bar shows the 95% QTL confidence interval. (C) Linkage mapping results of the 25th quantile of body length in control conditions are shown with genomic position (Mb) on the x-axis and LOD score on the y-axis. The tick marks on the x-axis denote every 5 Mb. Each chromosome is in its own box labeled on top. The dotted red line is the LOD threshold for 5% FDR obtained by permuting the phenotype data and mapping 1000 times. The red triangle denotes the peak QTL marker, and the blue bar shows the 95% QTL confidence interval. (D) Linkage mapping results of the 50th quantile or median of body length in control conditions are shown with genomic position (Mb) on the x-axis and LOD score on the y-axis. The tick marks on the x-axis denote every 5 Mb. Each chromosome is in its own box labeled on top. The dotted red line is the LOD threshold for 5% FDR obtained by permuting the phenotype data and mapping 1000 times. The red triangle denotes the peak QTL marker, and the blue bar shows the 95% QTL confidence interval. E. Linkage mapping results of the 75th quantile of body length in control conditions are shown with genomic position (Mb) on the x-axis and LOD score on the y-axis. The tick marks on the x-axis denote every 5 Mb. Each chromosome is in its own box labeled on top. The dotted red line is the LOD threshold for 5% FDR obtained by permuting the phenotype data and mapping 1000 times. The red triangle denotes the peak QTL marker, and the blue bar shows the 95% QTL confidence interval. F. Linkage mapping results of the 90th quantile of body length in control conditions are shown with genomic position (Mb) on the x-axis and LOD score on the y-axis. The tick marks on the x-axis denote every 5 Mb. Each chromosome is in its own box labeled on top. The dotted red line is the LOD threshold for 5% FDR obtained by permuting the phenotype data and mapping 1000 times. The red triangle denotes the peak QTL marker, and the blue bar shows the 95% QTL confidence interval. G. Linkage mapping results of the variance of body length in control conditions are shown with genomic position (Mb) on the x-axis and LOD score on the y-axis. The tick marks on the x-axis denote every 5 Mb. Each chromosome is in its own box labeled on top. The dotted red line is the LOD threshold for 5% FDR obtained by permuting the phenotype data and mapping 1000 times. The red triangle denotes the peak QTL marker, and the blue bar shows the 95% QTL confidence interval. FDR, false discovery rate; QTL, quantitative trait loci; RIAIL, recombinant inbred advanced intercross lines.
Figure 4
Figure 4
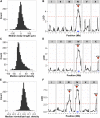
(A) Histogram of the normalized median body lengths of the RIAIL population in control conditions. Linear regression was used to reduce the effects of assay plate and plate position. (B) Linkage mapping results of median body length in control conditions are shown with genomic position (Mb) on the x-axis and logarithm of odds (LOD) score on the y-axis. The tick marks on the x-axis denote every 5 Mb. Each chromosome is in its own box labeled on top. The dotted red line is the LOD threshold for 5% FDR obtained by permuting the phenotype data and mapping 1000 times. The red triangle denotes the peak QTL marker, and the blue bar shows the 95% QTL confidence interval. (C) Histogram of the normalized median optical densities of the RIAIL population in control conditions. Linear regression was used to reduce the effects of assay plate and plate position. (D) Linkage mapping results of median optical density in control conditions are shown with genomic position (Mb) on the x-axis and LOD score on the y-axis. The tick marks on the x-axis denote every 5 Mb. Each chromosome is in its own box labeled on top. The dotted red line is the LOD threshold for 5% FDR obtained by permuting the phenotype data and mapping 1000 times. The red triangle denotes the peak QTL marker, and the blue bar shows the 95% QTL confidence interval. (E) Histogram of the median normalized optical densities (optical density of each animal divided by its length) of the RIAIL population in control conditions. Linear regression was used to reduce the effects of assay plate and plate position before normalizing for body length. (F) Linkage mapping results of median normalized optical density in control conditions are shown with genomic position (Mb) on the x-axis and LOD score on the y-axis. The tick marks on the x-axis denote every 5 Mb. Each chromosome is in its own box labeled on top. The dotted red line is the LOD threshold for 5% FDR obtained by permuting the phenotype data and mapping 1000 times. The red triangle denotes the peak QTL marker, and the blue bar shows the 95% QTL confidence interval. After normalizing for body length additional variation is revealed and maps to chromosomes III and X. FDR, false discovery rate; QTL, quantitative trait loci; RIAIL, recombinant inbred advanced intercross lines.
Figure 5
Figure 5
The normalized brood sizes of four strains in different concentrations of the herbicide paraquat are shown. N2 (orange), CB4856 (blue), JU258 (red), and LKC34 (black) have decreased growth rates and body sizes when exposed to increasing concentration of paraquat. The means of four replicates of each strain are shown.
Figure 6
Figure 6
(A) Histograms of mean normalized optical density in control (black) and in paraquat (red) conditions for the 357 RIAILs are shown. (B) Linkage mapping results of the residual normalized mean optical density in paraquat conditions are shown with genomic position (Mb) on the x-axis and logarithm of odds (LOD) score on the y-axis. The tick marks on the x-axis denote every 5 Mb. Each chromosome is in its own box labeled on top. The dotted red line is the LOD threshold for 5% FDR obtained by permuting the phenotype data and mapping 1000 times. The red triangle denotes the peak QTL marker, and the blue bar shows the 95% QTL confidence interval. FDR, false discovery rate; QTL, quantitative trait loci; RIAIL, recombinant inbred advanced intercross lines.

Similar articles

Cited by

References

    1. Andersen E. C., Gerke J. P., Shapiro J. A., Crissman J. R., Ghosh R., et al. , 2012. Chromosome-scale selective sweeps shape Caenorhabditis elegans genomic diversity. Nat. Genet. 44: 285–290. - PMC - PubMed
    1. Andersen E. C., Bloom J. S., Gerke J. P., Kruglyak L., 2014. A variant in the neuropeptide receptor npr-1 is a major determinant of Caenorhabditis elegans growth and physiology. PLoS Genet. 10: e1004156. - PMC - PubMed
    1. Ayyadevara S., Ayyadevara R., Hou S., Thaden J. J., Shmookler Reis R. J., 2001. Genetic mapping of quantitative trait loci governing longevity of Caenorhabditis elegans in recombinant-inbred progeny of a Bergerac-BO x RC301 interstrain cross. Genetics 157: 655–666. - PMC - PubMed
    1. Ayyadevara S., Ayyadevara R., Vertino A., Galecki A., Thaden J. J., et al. , 2003. Genetic loci modulating fitness and life span in Caenorhabditis elegans: categorical trait interval mapping in CL2a x Bergerac-BO recombinant-inbred worms. Genetics 163: 557–570. - PMC - PubMed
    1. Bendesky A., Tsunozaki M., Rockman M. V., Kruglyak L., Bargmann C. I., 2011. Catecholamine receptor polymorphisms affect decision-making in C. elegans. Nature 472: 313–318. - PMC - PubMed

Publication types