

The evolutionarily stable distribution of fitness effects
- PMID: 25762525
- PMCID: PMC4423373
- DOI: 10.1534/genetics.114.173815
The evolutionarily stable distribution of fitness effects
Abstract
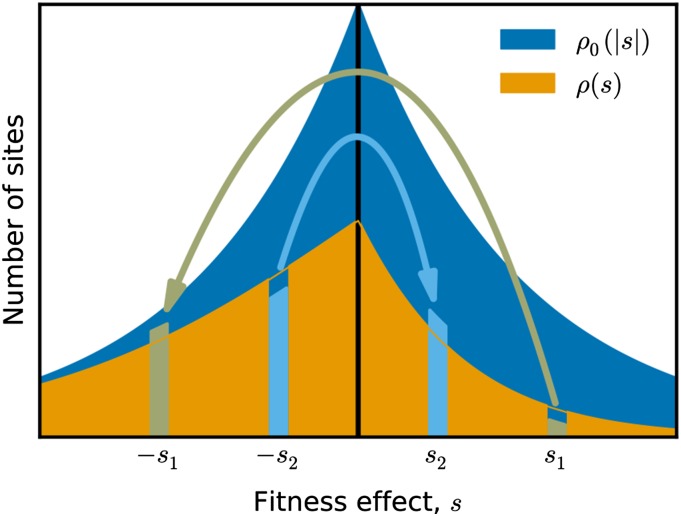
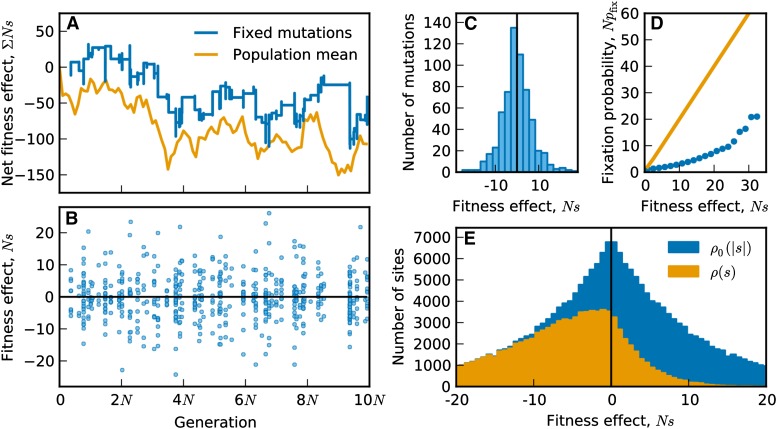
The distribution of fitness effects (DFE) of new mutations is a key parameter in determining the course of evolution. This fact has motivated extensive efforts to measure the DFE or to predict it from first principles. However, just as the DFE determines the course of evolution, the evolutionary process itself constrains the DFE. Here, we analyze a simple model of genome evolution in a constant environment in which natural selection drives the population toward a dynamic steady state where beneficial and deleterious substitutions balance. The distribution of fitness effects at this steady state is stable under further evolution and provides a natural null expectation for the DFE in a population that has evolved in a constant environment for a long time. We calculate how the shape of the evolutionarily stable DFE depends on the underlying population genetic parameters. We show that, in the absence of epistasis, the ratio of beneficial to deleterious mutations of a given fitness effect obeys a simple relationship independent of population genetic details. Finally, we analyze how the stable DFE changes in the presence of a simple form of diminishing-returns epistasis.
Keywords: distribution of fitness effects; evolutionary equilibrium; mutation–selection–drift balance.
Copyright © 2015 by the Genetics Society of America.
Figures


Similar articles
-
The Nonstationary Dynamics of Fitness Distributions: Asexual Model with Epistasis and Standing Variation.Genetics. 2016 Dec;204(4):1541-1558. doi: 10.1534/genetics.116.187385. Epub 2016 Oct 21. Genetics. 2016. PMID: 27770037 Free PMC article.
-
Comparison of the Full Distribution of Fitness Effects of New Amino Acid Mutations Across Great Apes.Genetics. 2019 Nov;213(3):953-966. doi: 10.1534/genetics.119.302494. Epub 2019 Sep 5. Genetics. 2019. PMID: 31488516 Free PMC article.
-
A null model for the distribution of fitness effects of mutations.Proc Natl Acad Sci U S A. 2023 Jun 6;120(23):e2218200120. doi: 10.1073/pnas.2218200120. Epub 2023 May 30. Proc Natl Acad Sci U S A. 2023. PMID: 37252948 Free PMC article.
-
Effects of new mutations on fitness: insights from models and data.Ann N Y Acad Sci. 2014 Jul;1320(1):76-92. doi: 10.1111/nyas.12460. Epub 2014 May 30. Ann N Y Acad Sci. 2014. PMID: 24891070 Free PMC article. Review.
-
Perspective: Sign epistasis and genetic constraint on evolutionary trajectories.Evolution. 2005 Jun;59(6):1165-74. Evolution. 2005. PMID: 16050094 Review.
Cited by
-
A Statistical Guide to the Design of Deep Mutational Scanning Experiments.Genetics. 2016 Sep;204(1):77-87. doi: 10.1534/genetics.116.190462. Epub 2016 Jul 13. Genetics. 2016. PMID: 27412710 Free PMC article.
-
Determining the factors driving selective effects of new nonsynonymous mutations.Proc Natl Acad Sci U S A. 2017 Apr 25;114(17):4465-4470. doi: 10.1073/pnas.1619508114. Epub 2017 Apr 11. Proc Natl Acad Sci U S A. 2017. PMID: 28400513 Free PMC article.
-
Experimental Studies of Evolutionary Dynamics in Microbes.Trends Genet. 2018 Sep;34(9):693-703. doi: 10.1016/j.tig.2018.06.004. Epub 2018 Jul 17. Trends Genet. 2018. PMID: 30025666 Free PMC article. Review.
-
A dynamical limit to evolutionary adaptation.bioRxiv [Preprint]. 2023 Aug 2:2023.07.31.551320. doi: 10.1101/2023.07.31.551320. bioRxiv. 2023. Update in: Proc Natl Acad Sci U S A. 2024 Jan 23;121(4):e2312845121. doi: 10.1073/pnas.2312845121 PMID: 37577473 Free PMC article. Updated. Preprint.
-
Digest: Few new mutations are recessive lethal.Evolution. 2023 Jul 27;77(8):1914-1915. doi: 10.1093/evolut/qpad117. Evolution. 2023. PMID: 37354114 Free PMC article.
References
-
- Berg, J., and M. Lässig, 2003 Stochastic evolution of transcription factor binding sites. Biophysics (Moscow) 48, Suppl. 1: 36–44.
Publication types
MeSH terms
Grants and funding
LinkOut - more resources
Full Text Sources
Other Literature Sources
