. 2015 Mar 12:6:6525.
doi: 10.1038/ncomms7525.

IL-23-mediated mononuclear phagocyte crosstalk protects mice from Citrobacter rodentium-induced colon immunopathology

Affiliations

IL-23-mediated mononuclear phagocyte crosstalk protects mice from Citrobacter rodentium-induced colon immunopathology

Tegest Aychek et al. Nat Commun. .

Abstract

Gut homeostasis and mucosal immune defense rely on the differential contributions of dendritic cells (DC) and macrophages. Here we show that colonic CX3CR1(+) mononuclear phagocytes are critical inducers of the innate response to Citrobacter rodentium infection. Specifically, the absence of IL-23 expression in macrophages or CD11b(+) DC results in the impairment of IL-22 production and in acute lethality. Highlighting immunopathology as a death cause, infected animals are rescued by the neutralization of IL-12 or IFNγ. Moreover, mice are also protected when the CD103(+) CD11b(-) DC compartment is rendered deficient for IL-12 production. We show that IL-12 production by colonic CD103(+) CD11b(-) DC is repressed by IL-23. Collectively, in addition to its role in inducing IL-22 production, macrophage-derived or CD103(-) CD11b(+) DC-derived IL-23 is required to negatively control the otherwise deleterious production of IL-12 by CD103(+) CD11b(-) DC. Impairment of this critical mononuclear phagocyte crosstalk results in the generation of IFNγ-producing former TH17 cells and fatal immunopathology.


Figures

Figure 1
Figure 1. Haematopoetic IL-23 is essential to survive C. rodentium infections.
(a) Survival curves of C. rodentium-challenged (il12b−/−>WT), (il23a−/−> WT) and (WT>WT) BM chimeras (n=6 per group, representative of three individual experiments). (b) Real-time PCR analysis of IL-22 and RegIIIβ expression in colonic tissues collected on day 7 PI. All groups, as in a (n=4–6 mice per group, representative of three individual experiments). Data were analysed by analysis of variance (ANOVA) followed by Tukey’s post hoc test, **P<0.01. (c) Tissue distribution of the luminescent C. rodentium strain at day 7. IVIS results are displayed as pseudo-colour images of peak bioluminescence, with variations in colour representing light intensity at a given location; right panel quantification of the luminescent C. rodentium signal. Lower panel, periodic acid-Schiff staining indicating goblet cell deletion, and decreased mucosal hyperplasia in (il12b−/−>WT) and (il23a−/−>WT) chimeras. (n=3–5 mice per group from three individual experiments). Data were analysed by ANOVA followed by Tukey’s post hoc test, **P<0.01. (d) ELISA for IL-12 and INFγ performed on supernatants of colon explant cultures of C. rodentium-challenged (il12b−/−>WT), (il23a−/−>WT) and (WT>WT) BM chimeras on day 7 PI (n=3–5 mice per group from three individual experiments). Data were analysed by ANOVA followed by Tukey’s post hoc test, **P<0.01, ***P<0.001.
Figure 2
Figure 2. IL-23 production by colonic macrophages and CD103 CD11b+ DC is required to survive the C. rodentium challenge.
(a) Schematic of mixed BM chimera approach. (b) Flow cytometric analysis of colon of DTx-injected mouse on day 5 after DTX treatment (lower panel) and control (upper panel) showing the depletion of CD11c+ CD45.1+ DTR-transgenic cells. Data represent one of the three independent experiments (n=3 mice per group). (c) Survival curves of DTx-treated (il23a−/− /CD11c-DTR>WT), (il12b−/− /CD11c-DTR>WT) and (WT/CD11c-DTR>WT) chimeras following Citrobacter challenge (n=6 per group from three individual experiments). (d) Real-time PCR analysis of IL-22 expression in colonic tissues collected from DTx-treated (il23a−/− /CD11c-DTR>WT), (il12b−/− /CD11c-DTR>WT) and (WT/CD11c-DTR>WT) chimeras on day 7 PI (n=4–6 per group from three individual experiments). Data were analysed by analysis of variance (ANOVA) followed by Tukey’s post hoc test, **P<0.01. (e) Survival curves of DTx-treated (il23a−/− /CX3CR1-DTR>WT), (il12b−/−/ CX3CR1-DTR>WT) and (WT/CX3CR1-DTR>WT) chimeras following Citrobacter challenge (n=7 per group from three individual experiments). (f) Real-time PCR analysis for IL-22 and RegIIIβ expression of colonic tissues collected from DTx-treated (il23a−/−/ CX3CR1-DTR>WT), (il12b−/−/ CX3CR1-DTR>WT) and (WT/CX3CR1-DTR>WT) chimeras on day 8 PI (n=5 per group from three individual experiments). Data were analysed by ANOVA followed by Tukey’s post hoc test *P<0.05, ***P<0.001. w/o, without.
Figure 3
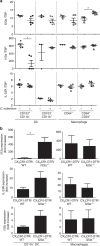
Figure 3. Analysis of intestinal mononuclear phagocytes for basal and PI cytokine production.
(a) Reverse transcription PCR (RT–PCR) analysis of FACS-sorted lamina propria DC and macrophages isolated from uninfected or infected WT mice 3 days PI. Data are representative of 3–6 independent experiments with DC and macrophages pooled from 7–10 mice (for sorting strategy see Supplementary Fig. 6). (b) RT–PCR analysis of CD103+ CD11b CD11c+ DC and CD103 CD11b+ CD11c+ cells, including macrophages and CD103 CD11b+ DC were sorted from DTx-treated mixed (WT/CX3CR1-DTR>WT) and (il23a−/−/CX3CR1-DTR>WT) BM chimeras. Data are presented as fold increase compared with the DC from uninfected mice. Data were obtained from three independent experiments with cells pooled from 9–11 chimeras. Data were analysed by two-tailed t-test *P<0.05. TBP, TATA binding protein.
Figure 4
Figure 4. IL-23 negatively controls IL-12 production by colonic CD103+ CD11b DC in vivo.
(a) Schematic of mixed chimera approach and flow cytometric analysis of colonic mononuclear phagocyte compartment of Citrobacter-infected (il-23rgfp/gfp (CD45.2)/WT (CD45.1)>WT (CD45.2)) mice indicating chimerism of CD103 CD11b+ DC population. Cells are gated according to scatter, doublets and CD11c expression. Data represent. one of the three independent experiments (n=3 mice per group). Data were analysed by two-tailed t-test *P<0.05. (b) reverse transcription PCR analysis of il12a, il12b and il23R transcripts measured in CD103+ CD11b CD11c+ DC sorted from (IL-23Rgfp/gfp(CD45.2)/WT (CD45.1)>WT (CD45.2)) chimeras. (n=3 mice per group from three individual experiments). (c) ELISA for IL-12 performed on colon explant culture supernatants ofC. rodentium-challenged (IL-23Rgfp/gfp>WT) and (WT>WT) chimeras on day 7 PI (n=3–4 mice per group from three individual experiments). Data were analysed by two-tailed t-test *P<0.05, **P<0.01.
Figure 5
Figure 5. Citrobacter-infected mice that lack IL-23-producing macrophages and CD103 CD11b+ DC succumb to IL-12- and IFNγ-mediated immunopathology.
(a) Survival curves of DTx-treated mixed (il23a−/−/CD11c-DTR>WT) BM chimeras infected by Citrobacter gavage and treated with IFNγ- and IL12p40-specific neutralizing antibodies by intravenous injection or PBS and isotype control antibodies. (n=5 per group, representative of three individual experiments). Statistical analysis was performed using the log-rank test. (b) Survival curves of DTx-treated mixed (il23a−/−/CX3CR1-DTR>WT) BM chimeras infected by Citrobacter gavage and treated with IFNγ- and IL12p40-specific neutralizing antibodies by intravenous injection or PBS; (n=5–6 per group from three individual experiments). Statistical analysis was performed using the log-rank test. (c) (Top) real-time PCR analysis of IFNγ and IL-17A of colonic tissues collected on day 7 PI and (bottom) flow cytometric analysis of TH17 and TH1 isolated from the lamina propria of il23a−/−, il12b−/− and WT BM chimeras. Cells were pregated on CD3+CD4+ cells. (n=3–6 mice per group from two individual experiments). Data were analysed by analysis of variance (ANOVA) followed by Tukey’s post hoc test *P<0.05. (d) (Top) real-time PCR analysis of IFNγ and IL-17A of colonic tissues collected on day 7 PI and (bottom). Flow cytometric analysis of TH17 and TH1 isolated from the lamina propria of indicated chimeras generated with haematopoietic mixture of mutant BM with CD11c-DTR BM. Cells were pregated on CD3+ CD4+ cells. (n=4–5 mice per group from two individual experiments). Data were analysed by ANOVA followed by Tukey’s post hoc test *P<0.05. (e) Flow cytometric analysis of TH1 cells isolated from DTx-treated (il23a−/−/CD11c-DTR>WT), (il12b−/−/CD11c-DTR>WT) and (WT/CD11c-DTR>WT) BM chimeras (n=4 per group from four individual experiments). Data were analysed by ANOVA followed by Tukey’s post hoc test *P<0.05.

Similar articles

Cited by

References

    1. Cerovic V., Bain C. C., Mowat A. M. & Milling S. W. F. Intestinal macrophages and dendritic cells: what's the difference? Trends. Immunol. 35, 270–277 (2014) . - PubMed
    1. Farache J., Zigmond E., Shakhar G. & Jung S. Contributions of dendritic cells and macrophages to intestinal homeostasis and immune defense. Immunol. Cell. Biol. 91, 232–239 (2013) . - PubMed
    1. Mildner A. & Jung S. Development and function of dendritic cell subsets. Immunity 40, 642–656 (2014) . - PubMed
    1. Cerovic V. et al.. Lymph-borne CD8α(+) dendritic cells are uniquely able to cross-prime CD8(+) T cells with antigen acquired from intestinal epithelial cells. Mucosal Immunol. 4, 104–113 (2014) . - PMC - PubMed
    1. Lewis K. L. et al.. Notch2 receptor signaling controls functional differentiation of dendritic cells in the spleen and intestine. Immunity 35, 780–791 (2011) . - PMC - PubMed

Publication types

MeSH terms