. 2015 Mar 11;11(3):e1004751.
doi: 10.1371/journal.ppat.1004751. eCollection 2015 Mar.

CD169-mediated trafficking of HIV to plasma membrane invaginations in dendritic cells attenuates efficacy of anti-gp120 broadly neutralizing antibodies

Affiliations

CD169-mediated trafficking of HIV to plasma membrane invaginations in dendritic cells attenuates efficacy of anti-gp120 broadly neutralizing antibodies

Hisashi Akiyama et al. PLoS Pathog. .

Erratum in

Abstract

Myeloid dendritic cells (DCs) can capture HIV-1 via the receptor CD169/Siglec-1 that binds to the ganglioside, GM3, in the virus particle membrane. In turn, HIV-1 particles captured by CD169, an I-type lectin, whose expression on DCs is enhanced upon maturation with LPS, are protected from degradation in CD169+ virus-containing compartments (VCCs) and disseminated to CD4⁺ T cells, a mechanism of DC-mediated HIV-1 trans-infection. In this study, we describe the mechanism of VCC formation and its role in immune evasion mechanisms of HIV-1. We find HIV-1-induced formation of VCCs is restricted to myeloid cells, and that the cytoplasmic tail of CD169 is dispensable for HIV-1 trafficking and retention within VCCs and subsequent trans-infection to CD4⁺ T cells. Interestingly, introduction of a di-aromatic endocytic motif in the cytoplasmic tail of CD169 that results in endocytosis of HIV-1 particles, suppressed CD169-mediated HIV-1 trans-infection. Furthermore, super-resolution microscopy revealed close association of CD169 and HIV-1 particles in surface-accessible but deep plasma membrane invaginations. Intriguingly, HIV-1 particles in deep VCCs were inefficiently accessed by anti-gp120 broadly neutralizing antibodies, VRC01 and NIH45-46 G54W, and thus were less susceptible to neutralization. Our study suggests that HIV-1 capture by CD169 can provide virus evasion from both innate (phagocytosis) and adaptive immune responses.


Conflict of interest statement

I have read the journal's policy and the authors of this manuscript have the following competing interests: MVG is an employee at Bruker Nano Surfaces. This does not alter our adherence to all PLOS policies on sharing data and materials.

Figures
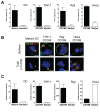
Fig 1
Fig 1. THP-1/CD169 cells recapitulate mature DC-mediated HIV-1 capture, trafficking and trans-infection of CD4+ T cells.
(A) Cells incubated with HIV-1 particles were lysed, and cell lysates used for measuring cell-associated p24gag. The data shown are the mean percent of captured p24gag (virus) ± SEM of independent experiments performed in triplicates (n = 3 for DC, n = 5 for THP-1, n = 3 for Raji and HeLa). (B) CD169 expressing cell lines and mature DCs were incubated with Gag-mCherry VLPs and stained for plasma membrane bound CD169 (Surface, top panel) or total CD169 (+ Tx100, bottom panel). CD169 (green), Gag-mCherry VLP (red) and nucleus (blue). Representative deconvolved images of single slices of cells are shown. Scale bars represent 5 μm. (C) Cells incubated with HIV-1 particles were co-cultured with CD4+ T cells to monitor HIV-1 trans-infection. Cells were lysed two days post initiation of co-culture and lysates used for measurement of luciferase activity. Values were normalized to luciferase activity observed in control cells (immature DCs or CD169low/null control cell lines). The data shown are the means ± SEM of independent experiments performed in triplicates with CD4+ T cells from different donors (n = 3 for DC, n = 4 for THP-1, n = 3 for Raji and n = 4 for HeLa).
Fig 2
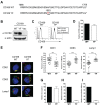
Fig 2. The cytoplasmic tail (CT) of CD169 is dispensable for mediating HIV-1 trans-infection.
(A) Sequences of wild type and mutant CD169 CTs. The asterisks represent stop codons introduced into the ORFs of the two CT mutants. (B) Western blot analysis of THP-1 cell lysates expressing either wild type or mutant CD169. (C) Cell surface expression of CD169 on THP-1 cells was measured by flow cytometry. (D) Relative cell surface expression of CD169 CT mutants was quantified and normalized to that observed with THP-1/CD169 cells. (E) Cells were challenged with HIV-1, washed and cell-associated p24gag was measured. The data shown is the virus capture by THP-1/CD169 CT mutants (ΔCT or ΔCT4R) normalized to that observed with THP-1/CD169 cells. (F) THP-1/CD169- or THP-1/CD169 CT mutant-mediated trans-infection was determined by measuring luciferase activity in THP—CD4+ T cell co-cultures 2 days post initiation of co-culture. The data shown is the relative virus transmission by THP-1/CD169 CT mutants (ΔCT or ΔCT4R) to that observed with THP-1/CD169 cells. (G) Efficacy of trans-infection was calculated as trans-infection (luciferase activity) per amount of virus captured (cell-associated p24gag) and normalized to that observed with THP-1/CD169 cells (set as 100). The data shown are the means ± SEM of three (D to F) or four (G) independent experiments. (H) THP-1/CD169 or THP-1/CD169ΔCT4R cells were incubated with Gag-mCherry VLPs (red), washed, fixed and stained for CD169 (green) and nucleus (blue). Representative deconvolved images of single slices of cells are shown. Scale bar represents 5 μm. WT: THP-1/CD169, ΔCT: THP-1/CD169ΔCT, ΔCT4R: THP-1/CD169ΔCT4R and Vec: empty vector transduced THP-1.
Fig 3
Fig 3. Introduction of a di-aromatic motif in CT of CD169 results in endocytosis of HIV-1 particles and attenuation of CD169-mediated trans-infection.
(A) Amino acid sequences of the CTs of wild type (WT) CD169 and mutant CD169YF are shown. Alanine to tyrosine mutation at position 1683 (in red) creates a di-aromatic motif, YF (underlined). (B) Western blot analysis for CD169 expression in THP-1/CD169 and THP-1/CD169YF cell lysates. (C) Representative FACS analysis of cell surface expression of CD169 on wild type and YF mutant expressing THP-1 cells. (D) The mean fluorescence intensity of cell surface expression of CD169 on YF mutant expressing THP-1 cells was quantified and normalized to that observed with THP-1/CD169 (wt) cells (set at 100). (E) Cells were incubated with Gag-mCherry VLPs and stained for CD81, CD63 or Lamp1 and nucleus. CD81, CD63 or Lamp1 (green), Gag-mCherry VLP (red) and nucleus (blue). Representative deconvolved images of single slices of cells are shown. Scale bar represents 5 μm. (F) Co-localization between green (CD81, CD63 or Lamp1) and red (VLPs) signals is reported as mean Pearson’s coefficient ± SEM. Each dot represents a single cell. Two-tailed P values were calculated using unpaired t-test in GraphPad Prism 5. ***: P < 0.0001. (G) Cells were challenged with HIV-1, washed and cell-associated p24gag was measured. Virus capture observed with THP-1/CD169YF cells was normalized to that observed with THP-1/CD169 cells (WT; set as 100). (H) Cells challenged with HIV-1/Bal-luc, were washed, co-cultured with CD4+ T cells and lysed at two days post initiation of co-culture for measurement of luciferase activity. The level of virus transmission observed in THP-1/CD169 (wt)—CD4+ T cell co-cultures was set as 100. (I) Efficacy of trans-infection was calculated as trans-infection (luciferase activity) per virus capture (cell-associated p24gag) and is shown relative to that observed with THP-1/CD169 cells (set as 100). The data shown are the means ± SEM of four (D) or six (G to I) independent experiments.
Fig 4
Fig 4. Localization of HIV-1 particles in CD169+ deep plasma membrane invaginations in LPS-matured DCs.
(A) Representative FACS analysis for CD169 expression on LPS or IFN-α-matured DCs. (B) HIV-1 capture by immature (NT), IFN-α or LPS-matured DCs was determined by measuring cell-associated p24gag in cell lysates. (C) HIV-1 transfer to CD4+ T cells, by immature (NT), IFN-α or LPS-matured DCs was determined by measuring luciferase activity in DC—CD4+ T cell co-cultures. HIV-1 capture and transfer experiments were performed in triplicates with DCs isolated from eight independent donors. The individual dot represents a single donor and the means ± SEM are depicted. (D) LPS or IFN-α-matured DCs were incubated with fluorescent HIV-1 particles (green) and stained for CD169 (red) and nucleus (blue). Representative deconvolved images of single slices of cells are shown. Scale bar represents 5 μm. (E) Representative electron micrographs of LPS or IFN-α-matured DCs incubated with HIV-1. The bottom panels are higher magnification pictures of the area depicted within the highlighted squares in the top panels. Arrows indicate virus particles. Scale bar represents 1 μm for top panels and 500 nm for bottom panels. (F) Cells were incubated with HIV-1 and stained for HIV-1 p24gag (green) and CD169 (red). Cells were imaged by FPALM super resolution microscopy. The top panels represent a single LPS or IFN-α matured DC while the middle panels show cross sections along the ab line indicated in the top panels. The bottom panels are pictures enlarged from the area depicted within the highlighted (dotted) squares in the middle panels. Scale bars represent 1 μm in the top and middle panels and 500 nm in the bottom panels. LPS: LPS-treated DCs, IFN-α: IFN-α-treated DCs, Immature: immature DCs.
Fig 5
Fig 5. Virus particles localized within CD169+ VCCs in mature DCs are susceptible to pronase.
(A) Experimental procedure utilized for testing the susceptibility of HIV-1 particles captured by CD169 to extracellular protease treatment is depicted. (B) Representative FACS analysis of cell surface expression of CD169 on LPS-DCs. (C) Relative cell surface expression of CD169 expression was measured by flow cytometry and normalized to that observed with untreated control (NT, set at 1). The data shown are the means ± SD of five (LPS-DCs, Trp), nine (LPS-DCs, Prn) and two (IFN-DCs, Typ and Prn) independent experiments with DCs from different donors. (D) LPS or IFN-α-matured DCs, incubated with HIV-1, were treated with pronase or trypsin. The amount of virus particles left associated with cells following protease treatments was determined by measuring cell-associated p24gag and the values were normalized to that observed with untreated cells (NT). The data shown are the means ± SD of four (LPS-DCs, Trp), seven (LPS-DCs, Prn) and two (IFN-DCs, Typ and Prn) independent experiments with DCs from different donors. (C and D) Two-tailed P values were calculated using one sample t-test in GraphPad Prism 5. *: P < 0.05, ***: P < 0.0001. Trp: trypsin-treated sample, Prn: pronase-treated sample.
Fig 6
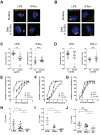
Fig 6. Neutralization of HIV-1 by anti-gp120 bNAbs is attenuated upon virus localization within CD169+ VCCs in LPS-matured DCs.
(A and B) LPS or IFN-α-matured DCs incubated with fluorescent HIV-1 particles, were stained for either surface-exposed gp120 (A) or CD169 (B) on living cells (Surface, top panels) or total gp120 (A) or CD169 (B) on cells after fixation and TritonX-100 treatment (+ Tx100, bottom panels). HIV-1 particles (green), gp120 or CD169 (red) and nucleus (blue). The arrowheads indicate green HIV-1 particles in VCCs that were not stained by surface-applied antibodies. Representative deconvolved images of single slices of cells are shown. Scale bar represents 5 μm. (C and D) Co-localization between HIV-1 particles and gp120 (C) or CD169 (D) is reported as Manders’ coefficients. Each dot represents a single cell and the means ± SEM are shown. The data shown is a representative experiment using DCs isolated from two different donors. (E and F) HIV-1 exposed LPS or IFN-α-matured DCs or cell-free (CF) HIV-1 particles were incubated with increasing concentrations of VRC01 (E), NIH45–46 G54W (F) or sCD4–183 (G) prior to initiation of CD4+ T cell infections. The x-axis shows the concentration of input VRC01 (E), NIH45–46 G54W (F) and sCD4–183 (G) in log μg/ml, and the y-axis shows the percentage inhibition relative to infection without any antibody. The data shown are the means ± SEM of a representative experiment performed in triplicate. (H, I and J) IC50 values for VRC01 (H), NIH45–46 G54W (I) or sCD4–183 (J) are shown as mean ± SEM and each dot represents data obtained from cells derived from an independent donor. Two-tailed P values were calculated using unpaired (C and D) or paired (H, I and J) t-test in GraphPad Prism 5. * P<0.05, **: P < 0.01, ***: P < 0.0001, n.s.: not significant.
Fig 7
Fig 7. A model for CD169+ VCC formation in LPS-DCs.
Capture of HIV-1 particles by CD169 leads to the formation of CD169+ VCCs in LPS-matured DCs. Lateral membrane movement of CD169-bound HIV-1 can result in accumulation of HIV-1 particles in plasma membrane microdomains in LPS-DCs. Multivalent interactions between multiple CD169 and HIV-1 particles and co-factor(s) recruitment might induce localized stress and strain to which the plasma membrane responds by forming invaginations. Arrow indicates lateral movement of CD169-bound HIV-1 particles into the VCC.

Similar articles

Cited by

References

    1. Banchereau J, Steinman RM (1998) Dendritic cells and the control of immunity. Nature 392: 245–252. - PubMed
    1. Hladik F, McElrath MJ (2008) Setting the stage: host invasion by HIV. Nat Rev Immunol 8: 447–457. 10.1038/nri2302 - DOI - PMC - PubMed
    1. Wu L, KewalRamani VN (2006) Dendritic-cell interactions with HIV: infection and viral dissemination. Nat Rev Immunol 6: 859–868. - PMC - PubMed
    1. Aggarwal A, Iemma TL, Shih I, Newsome TP, McAllery S, et al. (2012) Mobilization of HIV spread by diaphanous 2 dependent filopodia in infected dendritic cells. PLoS Pathog 8: e1002762 10.1371/journal.ppat.1002762 - DOI - PMC - PubMed
    1. Pope M, Gezelter S, Gallo N, Hoffman L, Steinman RM (1995) Low levels of HIV-1 infection in cutaneous dendritic cells promote extensive viral replication upon binding to memory CD4+ T cells. J Exp Med 182: 2045–2056. - PMC - PubMed

Publication types

MeSH terms

Substances