

Beyond apoptosis: the mechanism and function of phosphatidylserine asymmetry in the membrane of activating mast cells
- PMID: 25759911
- PMCID: PMC4914033
- DOI: 10.1080/19490992.2014.995516
Beyond apoptosis: the mechanism and function of phosphatidylserine asymmetry in the membrane of activating mast cells
Abstract
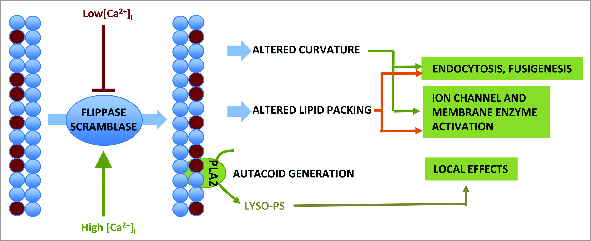
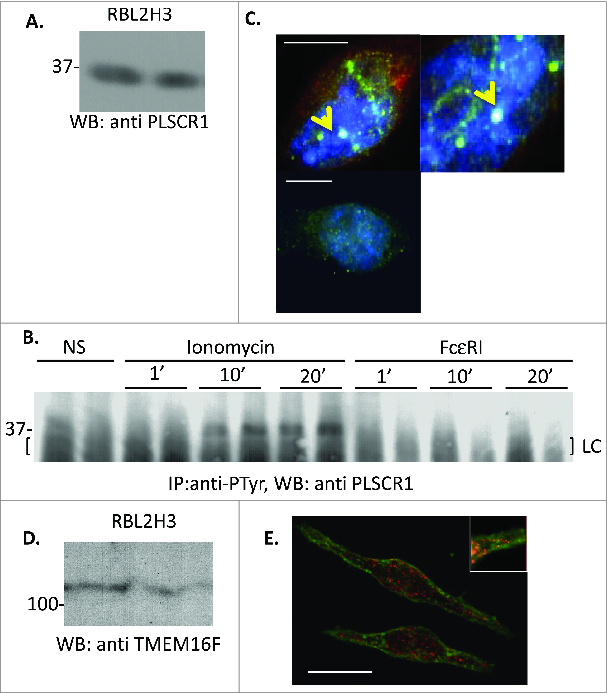
Loss of plasma membrane asymmetry is a hallmark of apoptosis, but lipid bilayer asymmetry and loss of asymmetry can contribute to numerous cellular functions and responses that are independent of programmed cell death. Exofacial exposure of phosphatidylserine occurs in lymphocytes and mast cells after antigenic stimulation and in the absence of apoptosis, suggesting that there is a functional requirement for phosphatidylserine exposure in immunocytes. In this review we examine current ideas as to the nature of this functional role in mast cell activation. Mechanistically, there is controversy as to the candidate proteins responsible for phosphatidylserine translocation from the internal to external leaflet, and here we review the candidacies of mast cell PLSCR1 and TMEM16F. Finally we examine the potential relationship between functionally important mast cell membrane perturbations and phosphatidylserine exposure during activation.
Keywords: ABCA, ABC binding cassette family A; CRAC, calcium release activated channel; GPMV, giant plasma membrane vesicle; ITIM, immunoreceptor tyrosine based inhibitory motif; PLA2, phospholipase A2; PLSCR, phospholipid scramblase; PMA, phorbol 12,13-myristate acetate; RBL, rat basophilic leukemia; RFU, relative fluorescence units; ROI, region of interest; TMEM, transmembrane protein; TMEM16F; WGA, wheat germ agglutinin; mast cells; membrane lipids; phosphatidylserine.
Figures

Similar articles
-
Immunologic stimulation of mast cells leads to the reversible exposure of phosphatidylserine in the absence of apoptosis.Int Arch Allergy Immunol. 2000 Nov;123(3):249-58. doi: 10.1159/000024451. Int Arch Allergy Immunol. 2000. PMID: 11112862
-
Stimulation of phosphatidylserine biosynthesis and facilitation of UV-induced apoptosis in Chinese hamster ovary cells overexpressing phospholipid scramblase 1.J Biol Chem. 2003 Mar 14;278(11):9706-14. doi: 10.1074/jbc.M204614200. Epub 2002 Dec 30. J Biol Chem. 2003. PMID: 12509439
-
Plasma membrane lipid scrambling causing phosphatidylserine exposure negatively regulates NK cell activation.Cell Mol Immunol. 2021 Mar;18(3):686-697. doi: 10.1038/s41423-020-00600-9. Epub 2021 Jan 19. Cell Mol Immunol. 2021. PMID: 33469162 Free PMC article.
-
Lipid translocation across the plasma membrane of mammalian cells.Biochim Biophys Acta. 1999 Aug 18;1439(3):317-30. doi: 10.1016/s1388-1981(99)00110-9. Biochim Biophys Acta. 1999. PMID: 10446420 Review.
-
Roles and regulation of phospholipid scramblases.FEBS Lett. 2015 Jan 2;589(1):3-14. doi: 10.1016/j.febslet.2014.11.036. Epub 2014 Dec 3. FEBS Lett. 2015. PMID: 25479087 Review.
Cited by
-
10-Gingerol as an inducer of apoptosis through HTR1A in cumulus cells: In-vitro and in-silico studies.J Taibah Univ Med Sci. 2017 Jun 23;12(5):397-406. doi: 10.1016/j.jtumed.2017.05.012. eCollection 2017 Oct. J Taibah Univ Med Sci. 2017. PMID: 31435270 Free PMC article.
-
Compensatory endocytosis occurs after cortical granule exocytosis in mouse eggs.J Cell Physiol. 2020 May;235(5):4351-4360. doi: 10.1002/jcp.29311. Epub 2019 Oct 14. J Cell Physiol. 2020. PMID: 31612508 Free PMC article.
-
Calcium-dependent, non-apoptotic, large plasma membrane bleb formation in physiologically stimulated mast cells and basophils.J Extracell Vesicles. 2019 Feb 20;8(1):1578589. doi: 10.1080/20013078.2019.1578589. eCollection 2019. J Extracell Vesicles. 2019. PMID: 30815238 Free PMC article.
-
Introducing Membrane Charge and Membrane Potential to T Cell Signaling.Front Immunol. 2017 Nov 9;8:1513. doi: 10.3389/fimmu.2017.01513. eCollection 2017. Front Immunol. 2017. PMID: 29170669 Free PMC article. Review.
-
Prognostic implications and procoagulant activity of phosphatidylserine exposure of blood cells and microparticles in patients with atrial fibrillation treated with pulmonary vein isolation.Mol Med Rep. 2017 Dec;16(6):8579-8588. doi: 10.3892/mmr.2017.7763. Epub 2017 Oct 11. Mol Med Rep. 2017. PMID: 29039531 Free PMC article.
References
-
- Bevers EM, Comfurius P, Dekkers DW, Zwaal RF. Lipid translocation across the plasma membrane of mammalian cells. Biochim Biophys Acta 1999; 1439:317-30; PMID:10446420; http://dx.doi.org/10.1016/S1388-1981(99)00110-9 - DOI - PubMed
-
- Bevers EM, Comfurius P, Zwaal RF. Regulatory mechanisms in maintenance and modulation of transmembrane lipid asymmetry: pathophysiological implications. Lupus 1996; 5:480-7; PMID:8902787 - PubMed
-
- Sims PJ, Wiedmer T. Unraveling the mysteries of phospholipid scrambling. Thromb Haemost 2001; 86:266-75; PMID:11487015 - PubMed
-
- Zwaal RF, Comfurius P, Bevers EM. Surface exposure of phosphatidylserine in pathological cells. Cell Mol Life Sci 2005; 62:971-88; PMID:15761668; http://dx.doi.org/10.1007/s00018-005-4527-3 - DOI - PubMed
-
- Bevers EM, Comfurius P, Dekkers DW, Harmsma M, Zwaal RF. Regulatory mechanisms of transmembrane phospholipid distributions and pathophysiological implications of transbilayer lipid scrambling. Lupus 1998; 7 Suppl 2:S126-31; PMID:9814689; http://dx.doi.org/10.1177/096120339800700228 - DOI - PubMed
Publication types
MeSH terms
Substances
Grants and funding
LinkOut - more resources
Full Text Sources