. 2015 May;14(5):1419-34.
doi: 10.1074/mcp.O114.044792. Epub 2015 Mar 9.

System-wide Analysis of SUMOylation Dynamics in Response to Replication Stress Reveals Novel Small Ubiquitin-like Modified Target Proteins and Acceptor Lysines Relevant for Genome Stability

Affiliations

System-wide Analysis of SUMOylation Dynamics in Response to Replication Stress Reveals Novel Small Ubiquitin-like Modified Target Proteins and Acceptor Lysines Relevant for Genome Stability

Zhenyu Xiao et al. Mol Cell Proteomics. 2015 May.

Abstract

Genotoxic agents can cause replication fork stalling in dividing cells because of DNA lesions, eventually leading to replication fork collapse when the damage is not repaired. Small Ubiquitin-like Modifiers (SUMOs) are known to counteract replication stress, nevertheless, only a small number of relevant SUMO target proteins are known. To address this, we have purified and identified SUMO-2 target proteins regulated by replication stress in human cells. The developed methodology enabled single step purification of His10-SUMO-2 conjugates under denaturing conditions with high yield and high purity. Following statistical analysis on five biological replicates, a total of 566 SUMO-2 targets were identified. After 2 h of hydroxyurea treatment, 10 proteins were up-regulated for SUMOylation and two proteins were down-regulated for SUMOylation, whereas after 24 h, 35 proteins were up-regulated for SUMOylation, and 13 proteins were down-regulated for SUMOylation. A site-specific approach was used to map over 1000 SUMO-2 acceptor lysines in target proteins. The methodology is generic and is widely applicable in the ubiquitin field. A large subset of these identified proteins function in one network that consists of interacting replication factors, transcriptional regulators, DNA damage response factors including MDC1, ATR-interacting protein ATRIP, the Bloom syndrome protein and the BLM-binding partner RMI1, the crossover junction endonuclease EME1, BRCA1, and CHAF1A. Furthermore, centromeric proteins and signal transducers were dynamically regulated by SUMOylation upon replication stress. Our results uncover a comprehensive network of SUMO target proteins dealing with replication damage and provide a framework for detailed understanding of the role of SUMOylation to counteract replication stress. Ultimately, our study reveals how a post-translational modification is able to orchestrate a large variety of different proteins to integrate different nuclear processes with the aim of dealing with the induced DNA damage.


Figures

Fig. 1.
Fig. 1.
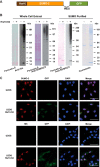
Generation and validation of U2OS cells stably expressing His10-SUMO-2. A, Schematic representation of the His10-SUMO-2-IRES-GFP construct used in this project. U2OS cells were infected with a lentivirus encoding His10-SUMO-2 (His10-S2) and GFP separated by an Internal Ribosome Entry Site (IRES) and cells stably expressing low levels of GFP were sorted by flow cytometry. B, Expression levels of SUMO-2 in U2OS cells and His10-SUMO-2 (His10-S2) expressing stable cells were compared by immunoblotting. Whole cell extracts were analyzed by immunoblotting using anti-polyHistidine and anti-SUMO-2/3 antibody to confirm the expression of SUMO-2 in U2OS cells and His10-SUMO-2 (His10-S2) expressing stable cells. Ponceau-S staining is shown as a loading control. Additionally, a His-pulldown was performed using Ni-NTA agarose beads to enrich SUMOylated proteins, and purification of His10-SUMO-2 conjugates was confirmed by immunoblotting using anti-SUMO-2/3 antibody. Ponceau-S staining and Coomassie staining were performed to confirm the purity of the final fraction. The experiment was performed in three biological replicates. C, The predominant nuclear localization of His10-SUMO-2 was visualized via confocal fluorescence microscopy after immunostaining with the indicated antibodies. DAPI staining was used to visualize the nuclei. Scale bars represent 75 μm.
Fig. 2.
Fig. 2.
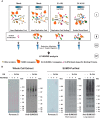
A strategy for discerning SUMOylation dynamics during replication stress. A, Cartoon depicting the strategy to study SUMOylation dynamics during replication stress. U2OS cells expressing His10-SUMO-2 were treated with 2 mm Hydroxyurea (HU) for 2 h or 24 h to induce DNA replication fork stalling and double strand breaks, respectively. Parental U2OS cells and U2OS cells expressing His10-SUMO-2 were mock treated as negative controls. SUMO-2 target proteins were purified by Ni-NTA purification. To study SUMO-2 targets that dynamically respond to replication stress, five biological replicates were performed. B, Purification of His10-SUMO-2 conjugates via NTA purification was confirmed by immunoblotting. Whole cell extracts and SUMO-2 purified proteins of the differently treated cells were run on 4–12% Bis-Tris polyacrylamide gels and levels of His10-SUMO-2 conjugates were compared by immunoblotting using anti-SUMO-2/3 antibody.
Fig. 3.
Fig. 3.
HU-induced DNA damage in U2OS stably expressing His10-SUMO-2. A, DNA content analysis of Hydroxyurea treated and nontreated cells. Flow cytometry was employed to confirm an increase in G1 phase cells upon HU treatment and a corresponding decrease in G2/M phase cells. B, The percentage of cells in each cell cycle phase is depicted. Error bars indicate the standard deviation from three independent replicates. Asterisks indicate significant differences by two-tailed Student's t testing. * p < 0.05, ** p < 0.001. C, Localization of γH2AX and 53BP1 on HU treatment. Cells were treated with 2 mm HU for 2 h or 24 h or left untreated. Cells were then fixed, permeabilized, and immunostained for γH2AX (red) or 53BP1 (red), and DNA was stained with DAPI (blue). Scale bars represent 75 μm.
Fig. 4.
Fig. 4.
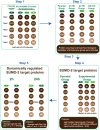
Label Free Quantification Strategy. Cartoon depicting our strategy for Label Free Quantification (LFQ) to select SUMO-2 target proteins and to identify significantly up- or down- regulated SUMO-2 target proteins in response to 2 h or 24 h HU treatment. Step 1: Protein lists generated by MaxQuant were further analyzed by Perseus and LFQ intensities were log2 transformed. Step 2: Different experiments were divided into four groups based on experimental conditions: A parental control group for U2OS control samples and three experimental groups for SUMO-2 samples purified from U2OS cells expressing His10-SUMO-2 treated with HU for 2 h or 24 h or mock treated. Inclusion criteria are depicted. Step 3: Imputation of the missing values by normally distributed values with 1.8 downshift (log2) and 0.3 randomized width (log2). Step 4: Proteins were considered as SUMO-2 target proteins using the indicated criteria. Step 5: Significantly up- or down-regulated SUMO-2 target proteins in response to 2 h or 24 h HU treatment were identified as indicated.
Fig. 5.
Fig. 5.
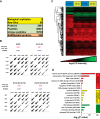
Overview of the SUMO proteomics results. A, Overview of the proteomic experiments. Out of 2,881 proteins identified with 48,821 peptides, 566 proteins were considered as SUMO-2 target proteins after filtering by LFQ intensities as described in Fig. 4. B, LFQ intensity scatter plot. Each condition of each biological replicate was plotted together to visualize the correlation between the experiments. Pearson correlation averages were calculated for each condition and standard deviations (S.D.) are indicated. C, Heat map of log2 LFQ intensities. Hierarchical clustering was performed for all identified proteins. Within each biological replicate, the sample order from left to right was U2OS, U2OS His10-SUMO-2 (mock treated), U2OS His10-SUMO-2 (2 h HU), and U2OS His10-SUMO-2 (24 h HU). D, GO term enrichment analysis of the SUMOylated proteins identified. The bar chart shows GO terms for biological processes, cellular components and molecular functions.
Fig. 6.
Fig. 6.
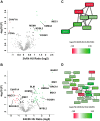
Volcano plots and STRING protein interaction network of dynamically regulated SUMO-2 target proteins. A, B, Volcano plots to show significantly altered SUMO-2 targets in response to 2 h HU treatment (A) or 24 h HU treatment (B). The -log10(P) value of 2 h/0 h and 24 h/0 h from pairwise comparisons of SUMO-2 target proteins purified from mock treated cells and HU-treated cells were plotted against the average LFQ ratio 2 h/0 h (log2) and LFQ ratio 24 h/0 h (log2). The red dots represent proteins decreased for SUMOylation in response to HU with an average log2 ratio smaller than −1. The green dots represent proteins increased for SUMOylation in response to HU with an average log2 ratio greater than 1. C, STRING analysis of dynamically regulated SUMO-2 target proteins after 2 h Hydroxyurea treatment. p value: 1.42*10−7. Up-regulated SUMOylated proteins are colored in green and down-regulated SUMOylated proteins are colored in red. D, STRING analysis of dynamically regulated SUMO-2 target proteins after 24 h Hydroxyurea treatment. p value: 6.94*10−14. Up-regulated SUMOylated proteins are colored in green and down-regulated SUMOylated proteins are colored in red.
Fig. 7.
Fig. 7.
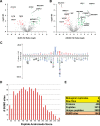
Volcano plots of dynamically regulated SUMOylation sites and SUMOylation motif analysis. A, B, Volcano plots showing dynamically regulated SUMO-2 acceptor sites in response to 2 h HU treatment (A) or 24 h HU treatment (B). The -log10(P) value from pairwise comparisons of SUMO-2 acceptor lysines purified from mock treated cells and HU-treated cells were plotted against the average LFQ Ratio 2 h/0 h (log2) and LFQ Ratio 24 h/0 h (log2). The red dots represent sites decreased for SUMOylation in response to HU with an average log2 ratio smaller than −1.0 and with p < 0.05. The green dots represent sites increased for SUMOylation in response to HU with an average log2 ratio greater than 1.0 and with p < 0.05. C, All SUMO-2 acceptor lysines identified in this study (1043 sites) were used to generate a SUMOylation motif employing IceLogo software. The height of the amino acid letters represents the fold change as compared with amino acid background frequency. All amino acid changes were significant with p < 0.05 by two-tailed Student's t test. D and E, Summary of the SUMO-2 acceptor lysines identified (E) with their peptide Andromeda scores (Median = 141.36) (D).
Fig. 8.
Fig. 8.
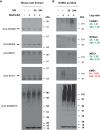
Verification of SUMO targets showing SUMOylation dynamics in response to replication stress. U2OS cells and U2OS cells expressing His10-tagged SUMO-2 were either mock treated or treated with Hydroxyurea (2 mm) for 2 h or 24 h as described, and His10-SUMO-2 conjugates were purified by Ni-NTA purification. SUMOylation dynamics induced by DNA replication stress was analyzed for four different SUMO-2 targets identified in the mass spectrometry screen using the indicated antibodies, and equal levels of SUMO conjugates in all samples were verified via immunoblotting using anti-SUMO-2/3 antibody. The fold changes in SUMOylation (log2) of these proteins as found in our proteomics screen are indicated on the right.

Similar articles

Cited by

References

    1. Deribe Y. L., Pawson T., Dikic I. (2010) Post-translational modifications in signal integration. Nat. Struct. Mol. Biol. 17, 666–672 - PubMed
    1. Scott J. D., Pawson T. (2009) Cell Signaling in Space and Time: Where Proteins Come Together and When They're Apart. Science 326, 1220–1224 - PMC - PubMed
    1. Choudhary C., Mann M. (2010) Decoding signalling networks by mass spectrometry-based proteomics. Nat. Rev. Mol. Cell Biol. 11, 427–439 - PubMed
    1. Komander D., Rape M. (2012) The Ubiquitin Code. Annu. Rev. Biochem. 81, 203–229 - PubMed
    1. Vertegaal A. C. O. (2011) Uncovering Ubiquitin and Ubiquitin-like Signaling Networks. Chem. Rev. 111, 7923–7940 - PMC - PubMed

Publication types

MeSH terms

Substances