. 2015 Jul;32(7):1730-47.
doi: 10.1093/molbev/msv052. Epub 2015 Mar 4.

Multispecies Analysis of Expression Pattern Diversification in the Recently Expanded Insect Ly6 Gene Family

Affiliations

Multispecies Analysis of Expression Pattern Diversification in the Recently Expanded Insect Ly6 Gene Family

Kohtaro Tanaka et al. Mol Biol Evol. 2015 Jul.

Abstract

Gene families often consist of members with diverse expression domains reflecting their functions in a wide variety of tissues. However, how the expression of individual members, and thus their tissue-specific functions, diversified during the course of gene family expansion is not well understood. In this study, we approached this question through the analysis of the duplication history and transcriptional evolution of a rapidly expanding subfamily of insect Ly6 genes. We analyzed different insect genomes and identified seven Ly6 genes that have originated from a single ancestor through sequential duplication within the higher Diptera. We then determined how the original embryonic expression pattern of the founding gene diversified by characterizing its tissue-specific expression in the beetle Tribolium castaneum, the butterfly Bicyclus anynana, and the mosquito Anopheles stephensi and those of its duplicates in three higher dipteran species, representing various stages of the duplication history (Megaselia abdita, Ceratitis capitata, and Drosophila melanogaster). Our results revealed that frequent neofunctionalization episodes contributed to the increased expression breadth of this subfamily and that these events occurred after duplication and speciation events at comparable frequencies. In addition, at each duplication node, we consistently found asymmetric expression divergence. One paralog inherited most of the tissue-specificities of the founder gene, whereas the other paralog evolved drastically reduced expression domains. Our approach attests to the power of combining a well-established duplication history with a comprehensive coverage of representative species in acquiring unequivocal information about the dynamics of gene expression evolution in gene families.

Keywords: Drosophila; Ly6 protein; gene duplication; gene family evolution; regulatory evolution.


Figures

F<sc>ig</sc><sc>.</sc> 1.
Fig. 1.
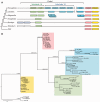
Phylogenetic analysis of Cluster III and V Ly6 genes. (A) Numbers and cluster organizations of the Cluster III and V Ly6 genes in insect genomes. The phylogenetic relationship of the groups is shown on the left. Pointed ends on the genes indicate their orientations within the clusters. Genes in the same clusters are connected with lines. The members are further subdivided according to the phylogenetic analysis below (Clade1, Subclades A and B). In Megaselia, neither the cluster organization nor the orientations of the genes are known. Megaselia also has multiple copies of CG9336–CG9338 and atilla homologs. The Apis homologs are not in a cluster. (B) Bayesian consensus tree generated using BAli-Phy program. For each branch, posterior probabilities above 0.5 are shown on the left. Those obtained for the corresponding branches in the tree generated by MrBayes are shown on the right. A distantly related Ly6 gene coiled (cold) was used as an outgroup. Dm, Drosophila melanogaster; Cc, Ceratitis capitata; Ma, Megaselia abdita; Ag, Anopheles gambiae; Tc, Tribolium castaneum; Am, Apis mellifera; Dp, Danaus plexippus; Ba, Bicyclus anynana; and Bm, Bombyx mori.
F<sc>ig</sc><sc>.</sc> 2.
Fig. 2.
Evolutionary history of Clusters III and V Ly6 gene subfamily. The red scissor indicates the separation of the ancestral cluster into two distinct genomic locations. Note that in the ancestral cluster with three genes, CG6583 orthologs are found in different orientations in different groups. See text for details.
F<sc>ig</sc><sc>.</sc> 3.
Fig. 3.
Embryonic tissue-specificities of aC1 genes. (A–E) Tribolium castaneum. (A) Ventral view of the whole embryo. Asterisks indicate nonspecific labeling of the pleuripod. (B) Boxed area in (A), showing aC1 expression in the VNC and in the exiting nerves (arrows). (C) Glial cells in the VNC and the exiting nerves (arrows) visualized with the repo riboprobe. (D) Dorsal longitudinal trachea (tr). (E) Expression in the hindgut (hg) and anal structures (arrow). (F–J) Bicyclus anynana. (F) Ventral view showing the expression in the larval photoreceptor neurons (lp), the brain (br), and the VNC. (G) Boxed area in (F), showing aC1 expression in the VNC and in the PNS glia (arrows). (H) repo expression labels glial cells in both the CNS and PNS (arrows). (I) aC1 expression in the larval photoreceptor neurons and optic nerve glia (os). (J) Expression in the hindgut (hg), the anal structures (arrow), and the VNC. (K–S) Anopheles stephensi. (K–N) Ventral views. (L) Boxed area in (K), showing aC1 expression in the VNC (arrowheads) and the exiting nerves (arrows). (M) repo expression labeling glial cells associated with the exiting nerves (arrows) and the VNC (arrowheads). (N) Neurons in the VNC visualized with elav expression. (O) aC1 expression in the anal structures (arrow). Asterisk, Nonspecific staining. (P–S) Lateral views. (P) Lateral view of the whole embryo. Arrows, brain. (Q) Boxed area in (P), showing expression in the exiting nerves (arrows) and in trachea (arrowheads). t3, third thoracic segment; a1 and a2, first and second abdominal segments. (R) repo expression in the glia labeling exiting nerves (arrows) and PNS. (S) elav expression in the CNS and PNS neurons. Anterior is to the left in all figures.
F<sc>ig</sc><sc>.</sc> 4.
Fig. 4.
Embryonic tissue-specificities of twit and CG31676 orthologs. (A–F) twit. (A, B) Megaselia abdita. (A) Ventral view showing expression in the VNC. (B) Dorsal view showing strong signal in the larval photoreceptors (lp) and a set of cells in the brain (arrow). (C, D) Ceratitis capitata. Asterisks label a nonspecific signal associated with the mouth hooks. (C) Ventral view showing expression in the VNC. (D) Dorsal view showing expression in distinct cells in the brain (arrow). (E, F) Drosophila melanogaster. (E) VNC expression. (F) Expression in the larval photoreceptors and the neurons in the brain (arrow). (G–R) CG31676. (G–J) Megaselia abdita dorsal views. (G). Transcript distribution in the hindgut (hg), terminal organ (to), and lateral sensory neurons (arrows). Asterisk labels nonspecific staining in the mouth hooks. (H) Expression in the dorsal organ (do) and in pharynx associated cells (arrow). (I) No detectable expression is observed in the heart (hr). (J) Expression in two lateral rows of cells in the hindgut. (K–N) Ceratitis capitata dorsal views. (K) Expression is detected in the terminal organ (to), anterior heart (hr), and the hindgut (hg). Asterisk labels nonspecific staining in the dorsal trachea. (L) Cephalic region showing expression in unidentified rows of cells dorsal to the pharynx (arrows). (M) Expression in the heart (hr) and an unidentified structure (arrows). (N) Expression in a single row of cells in the hindgut. (O–R) Drosophila melanogaster. (O) Expression in the terminal organ (to), lateral sensory neurons (arrows), gonads (gn), and a ring of cells in the hindgut (hg). (P) Details of the cephalic region, showing expression in the pharyngeal muscle (pm), dorsal organ (do), and ring gland (rg). (Q) Expression in the posterior heart (hr). (R) Germ cells labeled with VASA protein (green) are in contact with gonad mesodermal cells expressing CG31676 transcripts (red). In all images, anterior is to the left.
F<sc>ig</sc><sc>.</sc> 5.
Fig. 5.
Embryonic tissue-specificities of atilla, CG14401, and CG31675 genes. (A–N) atilla genes. (A–E) Megaselia abdita atilla1. (A, B) Lateral views showing expression in the lateral sensory neurons (ne) and the larval photoreceptors (lp). (C) Fluorescent double staining showing atilla1 (red) and Elav protein (green) distribution on the lateral sensory neurons (ne). atilla1 expression is detected in both neurons and trachea (tr). (D) Expression in the dorsal epidermis. (E) Ventral view of atilla1—Elav double staining showing atilla1 expression in the Elav-negative glial cells associated with the exiting nerves (arrows) and within the VNC (inset). (F–J) Megaselia abdita atilla2. (F, G) Lateral views displaying expression in the muscle apodemes (ap) and the chordotonal organs (co). (H) Fluorescent staining of atilla2 (red) and Elav protein (green) on the lateral sensory organs. atilla2 transcripts are found both in nonneuronal components of the chordotonal organs (co) and in few Elav positive sensory neurons on the ventral side (ne). (I) Expression in the dorsal heart (hr) and apodemes (ap). (J) atilla2 is expressed in Elav positive cells in the VNC (magnified in inset). (K–M) Ceratitis capitata atilla. (K, L) Lateral views showing expression in the hindgut (hg) and the oenocytes (oe). (M) Late embryos show expression in the epidermis. (N) Drosophila melanogaster lateral view. atilla is expressed in the epidermis, trachea (arrows), and pharynx (ph). (O–R) CG31675 orthologs. (O, P) Ventral (O) and lateral (P) views of C. capitata embryo at the extended germband stage showing labeling of unidentified groups of cells posterior to the head (arrow). (Q, R) Drosophila melanogaster CG31675. (Q) Lateral view showing expression in the dorsal sensory organs. (R) CG31675 (red) is expressed in Elav-positive (green) lateral neurons (arrows). (S–V) CG14401 orthologs. (S, T) Ceratitis capitata. (S) Lateral view showing CG14401 expression in the ventral longitudinal muscles (vm). (T) Magnified view of the ventral muscle, seen from a ventrolateral perspective. (U, V). Drosophila melanogaster CG14401. (U) Ventral view showing expression in the garland cells (gc). (V) Dorsal view showing expression in a subset of cells associated with the posterior spiracles (arrow).
F<sc>ig</sc><sc>.</sc> 6.
Fig. 6.
Tissue specificities of aC1B and a-36/38 genes. (A–E) Megaselia abdita aC1B1. (A, B) Ventral view showing expression in the glia of exiting nerves (arrows) and VNC neurons (ne). The dashed line demarcates the boundary of the nerve cord. (C) Trachea (tr) on the lateral body wall. (D) aC1B1 (red) is expressed in muscles at a moderate level. Strong signal corresponds to glial cells (arrows). (E) Dorsal view showing low expression in the heart (hr). Asterisks indicate nonspecific staining in the cuticle of the tracheal lumen. (F–I) Megaselia abdita aC1B3. (F) Ventral view showing expression in the salivary ducts (sd) and at the fore–midgut junction (arrowhead). (G) Expression in a single row of cells belonging to the hindgut (hg). (H) Expression in the cells associated with the tracheal branches (tr). Asterisks indicate nonspecific labeling of the tracheal cuticle. (I) Expression in the posterior spiracles (arrow). (J–N) Ceratitis capitata a-36/38. (J, K) Ventral views showing expression in the pharynx-associated cells (ph) and the exiting nerves (arrows) and the VNC neurons (ne). (L) Tracheal expression in the anterior dorsal segment. (M) Expression in the epidermis. (N) Expression along the lateral sides and the tip of the hindgut is visible (arrows) in a dorsal view.
F<sc>ig</sc><sc>.</sc> 7.
Fig. 7.
Drosophila melanogaster CG9336 and CG9338 expression. (A–E) D. melanogaster CG9336 in situ hybridization. (A) Ventral view showing prominent expression in the midline glia (mg) and the exit nerves glia (arrows). (B) Expression in the larval photoreceptor neurons (lp). (C) Expression in the trachea on the lateral body wall (tr). (D) Expression in the apodemes in anterior segments (arrows). (E) Dorsal view showing expression in the heart (hr). (F–J) D. melanogaster CG9338 transcripts detected by the riboprobe. (F) Ventral view showing expression in the glia in the exiting nerves (arrows) and weaker expression in the midline glia (compare with A). (G) Expression in the larval photoreceptors. (H) Trachea on the lateral body wall. (I) Expression in migrating hemocytes seen in the cephalic region (arrows). (J) Faint signal detected in the heart. Note that the two riboprobes share sequence similarity and may be cross-reacting. (K–M) The tissue distribution of CG9336-YFP (green) and the glial marker Repo (red) in the embryo homozygous for the CG9336-YFP protein trap insertion. (K) Ventral view. In both the exiting nerves and the VNC, the YFP signal is detected in Repo positive cells. Midline glia lacks Repo expression. (L) Dorsal view showing expression in the trachea (tr) and the lymph gland (lg). Note the ubiquitous epidermal expression, which is not visible with the riboprobes. (M) Dorsal view showing strong heart expression. (N–P) Embryos homozygous for the CG9338-YFP protein trap insertion, showing the distribution of CG9338-YFP (green) and Repo (red). (N) Ventral view showing expression in the glial cells associated with the exiting nerves, but no expression in the midline. (O) Dorsal view showing expression in the migrating hemocytes (arrows). Asterisk labels autofluorescent signal from the midgut yolk. (P) Dorsal view showing strong expression in the hemocytes (arrows) and weak expression in the heart (hr).
F<sc>ig</sc><sc>.</sc> 8.
Fig. 8.
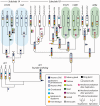
Parsimony analysis of evolution of the tissue-specificities in the aC1 lineage. The nodes with white genes represent duplication events, whereas the nodes with shaded genes indicate speciation. Tissue symbols appearing next to branches indicate acquisitions of new tissue-specificities (neofunctionalization) associated with either duplication events (stars) or speciation events (asterisks). Branching arrows above the genes indicate subfunctionalization. In this reconciliation tree, there are two equally parsimonious scenarios for evolution of epidermal expression (the yellow boxes 1 and 2). The first scenario yields nine instances of neofunctionalization after duplication and ten after speciation following the start of the Clade1 family expansion. The second scenario yields eight neofunctionalization after duplication and ten after speciation. For both scenarios, there are two cases of subfunctionalization.

Similar articles

Cited by

References

    1. Alonso CR, Wilkins AS. The molecular elements that underlie developmental evolution. Nat Rev Genet. 2005;6:709–715. - PubMed
    1. Altschul SF, Madden TL, Schäffer AA, Zhang J, Zhang Z, Miller W, Lipman DJ. Gapped BLAST and PSI-BLAST: a new generation of protein database search programs. Nucleic Acids Res. 1997;25:3389–3402. - PMC - PubMed
    1. Assis R, Bachtrog D. Neofunctionalization of young duplicate genes in Drosophila. Proc Natl Acad Sci U S A. 2013;110:17409–17414. - PMC - PubMed
    1. Blount ZD, Barrick JE, Davidson CJ, Lenski RE. Genomic analysis of a key innovation in an experimental Escherichia coli population. Nature. 2012;489:513–518. - PMC - PubMed
    1. Casneuf T, De Bodt S, Raes J, Maere S, Van de Peer Y. Nonrandom divergence of gene expression following gene and genome duplications in the flowering plant Arabidopsis thaliana. Genome Biol. 2006;7:R13. - PMC - PubMed

Publication types

LinkOut - more resources