

Effects of blast overpressure on neurons and glial cells in rat organotypic hippocampal slice cultures
- PMID: 25729377
- PMCID: PMC4325926
- DOI: 10.3389/fneur.2015.00020
Effects of blast overpressure on neurons and glial cells in rat organotypic hippocampal slice cultures
Abstract
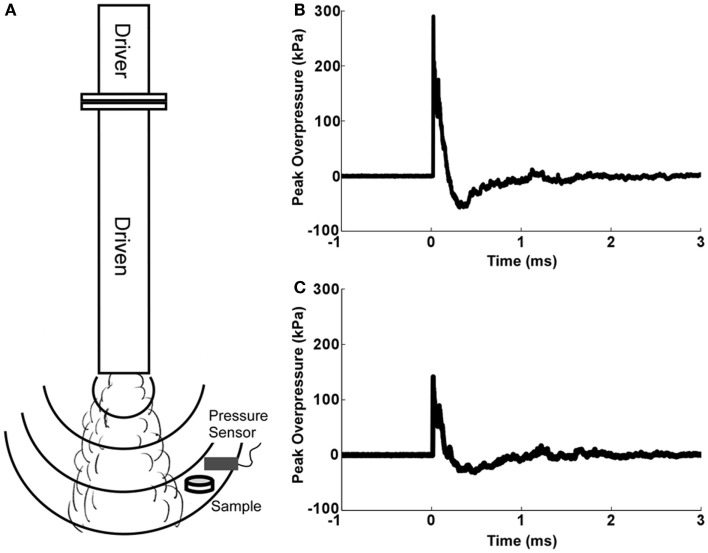
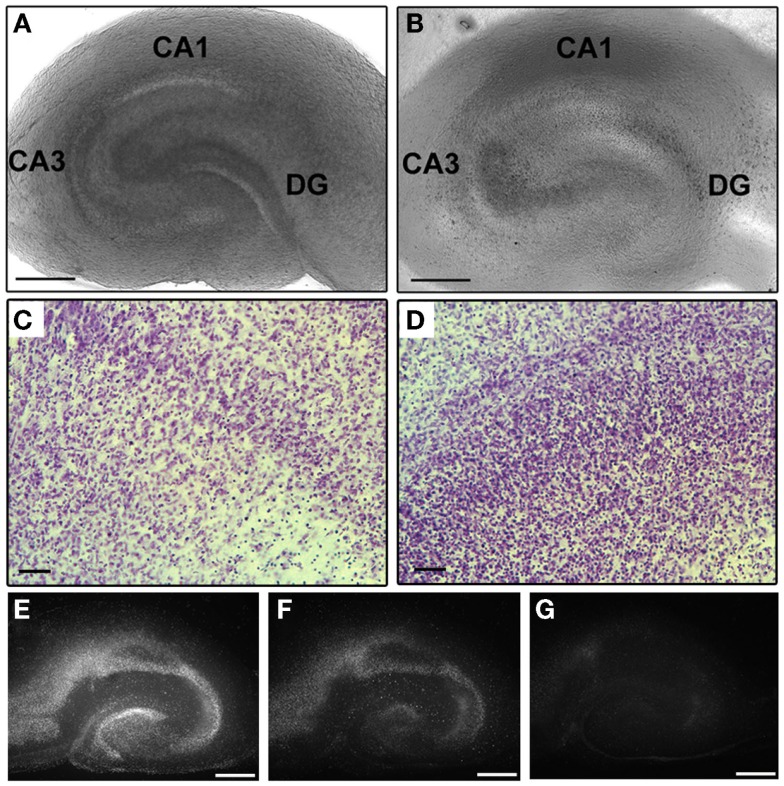
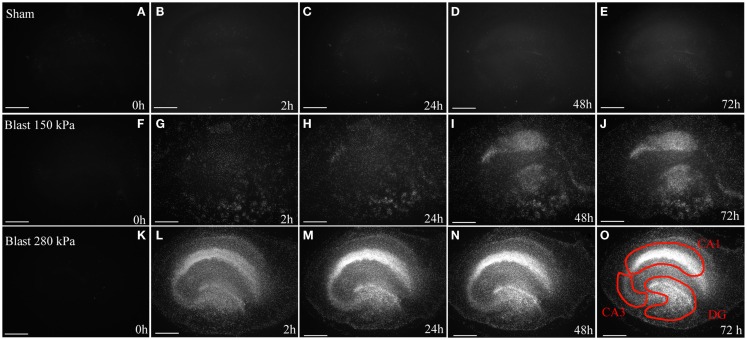
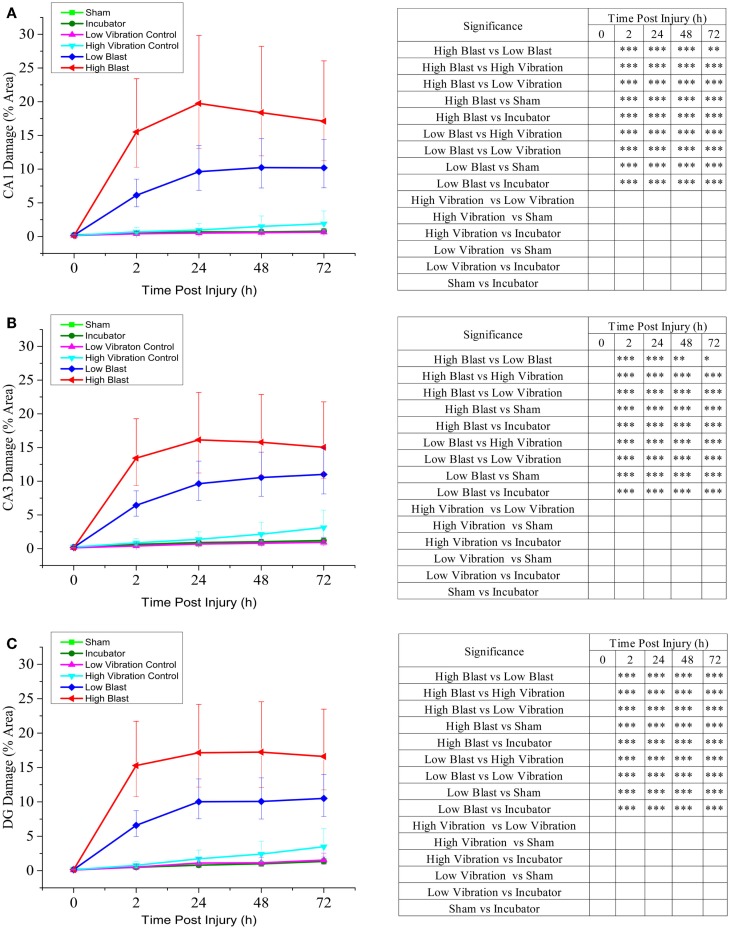
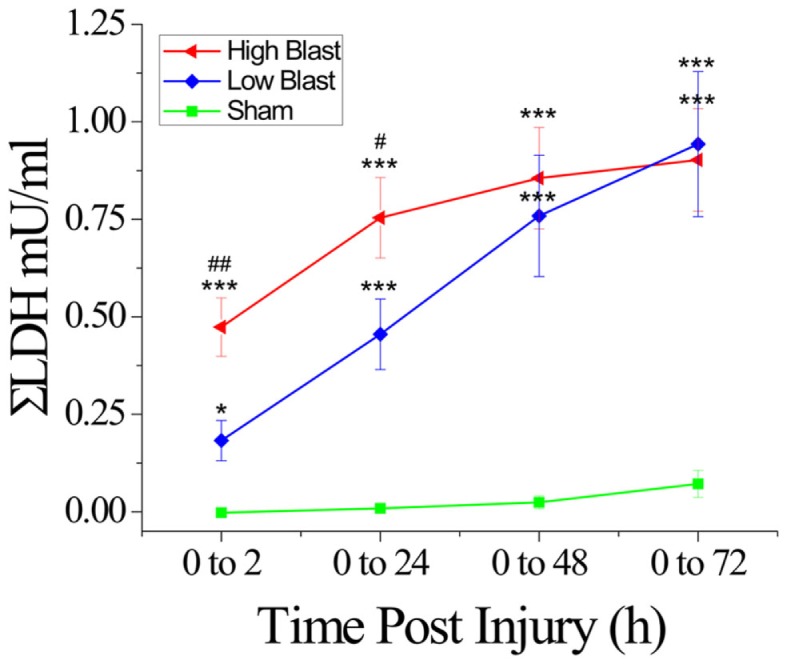
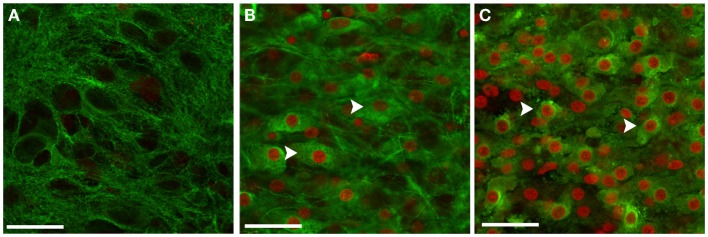
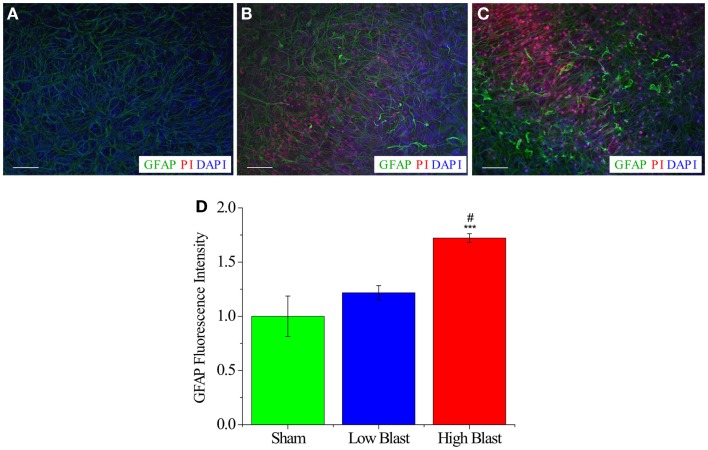
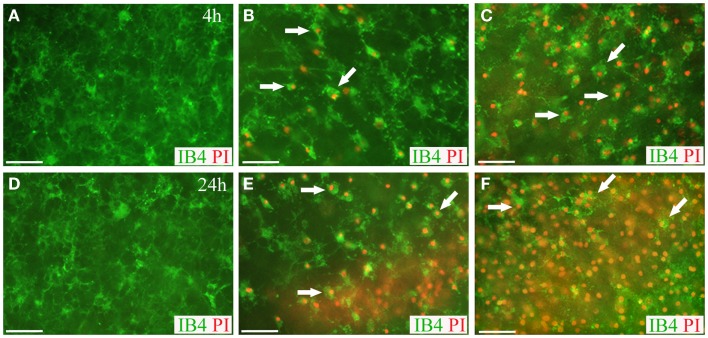
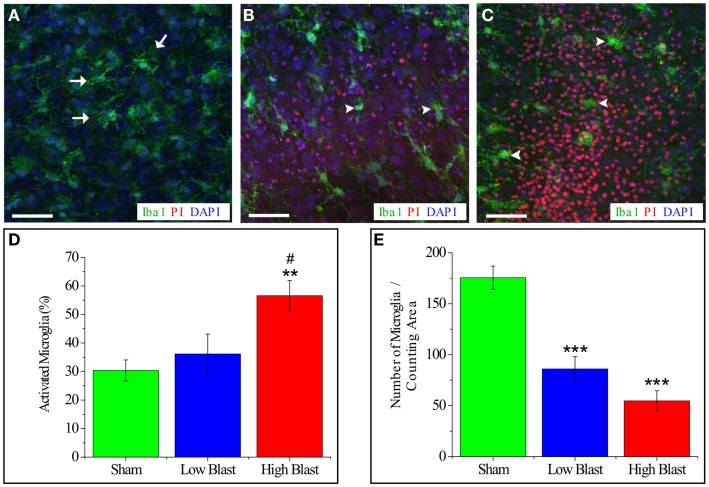
Due to recent involvement in military conflicts, and an increase in the use of explosives, there has been an escalation in the incidence of blast-induced traumatic brain injury (bTBI) among US military personnel. Having a better understanding of the cellular and molecular cascade of events in bTBI is prerequisite for the development of an effective therapy that currently is unavailable. The present study utilized organotypic hippocampal slice cultures (OHCs) exposed to blast overpressures of 150 kPa (low) and 280 kPa (high) as an in vitro bTBI model. Using this model, we further characterized the cellular effects of the blast injury. Blast-evoked cell death was visualized by a propidium iodide (PI) uptake assay as early as 2 h post-injury. Quantification of PI staining in the cornu Ammonis 1 and 3 (CA1 and CA3) and the dentate gyrus regions of the hippocampus at 2, 24, 48, and 72 h following blast exposure revealed significant time dependent effects. OHCs exposed to 150 kPa demonstrated a slow increase in cell death plateauing between 24 and 48 h, while OHCs from the high-blast group exhibited a rapid increase in cell death already at 2 h, peaking at ~24 h post-injury. Measurements of lactate dehydrogenase release into the culture medium also revealed a significant increase in cell lysis in both low- and high-blast groups compared to sham controls. OHCs were fixed at 72 h post-injury and immunostained for markers against neurons, astrocytes, and microglia. Labeling OHCs with PI, neuronal, and glial markers revealed that the blast-evoked extensive neuronal death and to a lesser extent loss of glial cells. Furthermore, our data demonstrated activation of astrocytes and microglial cells in low- and high-blasted OHCs, which reached a statistically significant difference in the high-blast group. These data confirmed that our in vitro bTBI model is a useful tool for studying cellular and molecular changes after blast exposure.
Keywords: blast injury; cell death; hippocampus; in vitro model; organotypic slice culture; traumatic brain injury.
Figures
Similar articles
-
Partial Depletion of Microglia Attenuates Long-Term Potentiation Deficits following Repeated Blast Traumatic Brain Injury in Organotypic Hippocampal Slice Cultures.J Neurotrauma. 2023 Mar;40(5-6):547-560. doi: 10.1089/neu.2022.0284. Epub 2022 Oct 12. J Neurotrauma. 2023. PMID: 36508265 Free PMC article.
-
Acute death of astrocytes in blast-exposed rat organotypic hippocampal slice cultures.PLoS One. 2017 Mar 6;12(3):e0173167. doi: 10.1371/journal.pone.0173167. eCollection 2017. PLoS One. 2017. PMID: 28264063 Free PMC article.
-
A method for objectively quantifying propidium iodide exclusion in organotypic hippocampal slice cultures.J Neurosci Methods. 2016 Aug 30;269:1-5. doi: 10.1016/j.jneumeth.2016.05.006. Epub 2016 May 11. J Neurosci Methods. 2016. PMID: 27179931
-
Modeling the Neurobehavioral Consequences of Blast-Induced Traumatic Brain Injury Spectrum Disorder and Identifying Related Biomarkers.In: Kobeissy FH, editor. Brain Neurotrauma: Molecular, Neuropsychological, and Rehabilitation Aspects. Boca Raton (FL): CRC Press/Taylor & Francis; 2015. Chapter 23. In: Kobeissy FH, editor. Brain Neurotrauma: Molecular, Neuropsychological, and Rehabilitation Aspects. Boca Raton (FL): CRC Press/Taylor & Francis; 2015. Chapter 23. PMID: 26269904 Free Books & Documents. Review.
-
Cellular and molecular correlates to plasticity during recovery from injury in the developing mammalian brain.Prog Brain Res. 1996;108:365-77. doi: 10.1016/s0079-6123(08)62552-2. Prog Brain Res. 1996. PMID: 8979814 Review.
Cited by
-
On the Accurate Determination of Shock Wave Time-Pressure Profile in the Experimental Models of Blast-Induced Neurotrauma.Front Neurol. 2018 Feb 6;9:52. doi: 10.3389/fneur.2018.00052. eCollection 2018. Front Neurol. 2018. PMID: 29467718 Free PMC article.
-
Increasing cellular lifespan with a flow system in organotypic culture of the Laterodorsal Tegmentum (LDT).Sci Rep. 2019 Feb 6;9(1):1486. doi: 10.1038/s41598-018-37606-3. Sci Rep. 2019. PMID: 30728375 Free PMC article.
-
Partial Depletion of Microglia Attenuates Long-Term Potentiation Deficits following Repeated Blast Traumatic Brain Injury in Organotypic Hippocampal Slice Cultures.J Neurotrauma. 2023 Mar;40(5-6):547-560. doi: 10.1089/neu.2022.0284. Epub 2022 Oct 12. J Neurotrauma. 2023. PMID: 36508265 Free PMC article.
-
Photobiomodulation (660 nm) therapy reduces oxidative stress and induces BDNF expression in the hippocampus.Sci Rep. 2019 Jul 12;9(1):10114. doi: 10.1038/s41598-019-46490-4. Sci Rep. 2019. PMID: 31300736 Free PMC article.
-
Exposure to mild blast forces induces neuropathological effects, neurophysiological deficits and biochemical changes.Mol Brain. 2018 Nov 9;11(1):64. doi: 10.1186/s13041-018-0408-1. Mol Brain. 2018. PMID: 30409147 Free PMC article.
References
LinkOut - more resources
Full Text Sources
Other Literature Sources
Research Materials
Miscellaneous