

A quantitative and dynamic model of the Arabidopsis flowering time gene regulatory network
- PMID: 25719734
- PMCID: PMC4342252
- DOI: 10.1371/journal.pone.0116973
A quantitative and dynamic model of the Arabidopsis flowering time gene regulatory network
Abstract
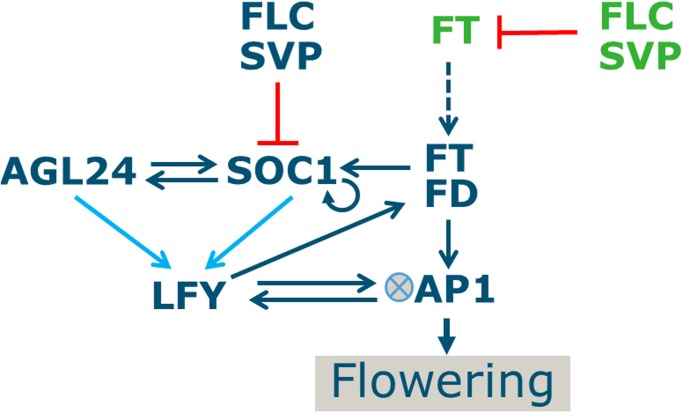
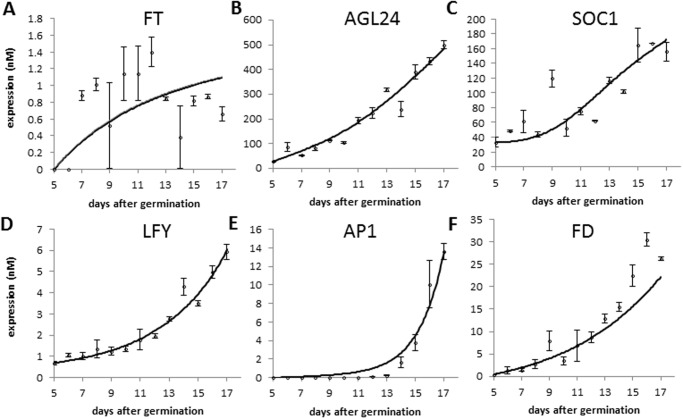
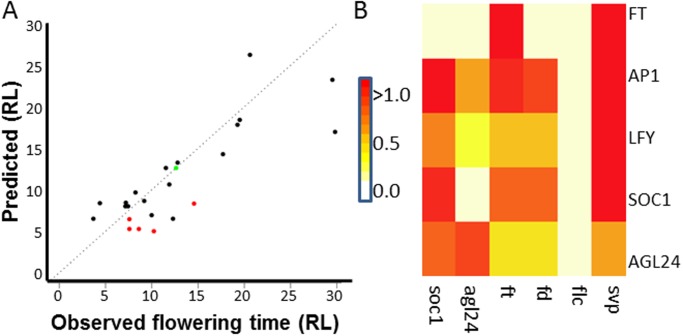
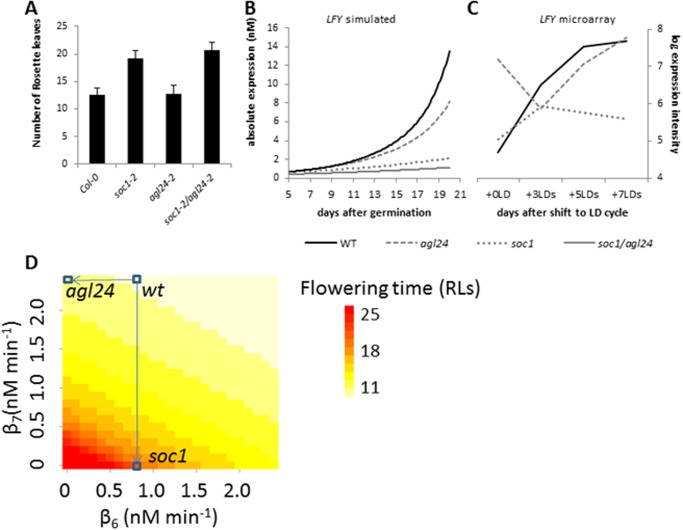
Various environmental signals integrate into a network of floral regulatory genes leading to the final decision on when to flower. Although a wealth of qualitative knowledge is available on how flowering time genes regulate each other, only a few studies incorporated this knowledge into predictive models. Such models are invaluable as they enable to investigate how various types of inputs are combined to give a quantitative readout. To investigate the effect of gene expression disturbances on flowering time, we developed a dynamic model for the regulation of flowering time in Arabidopsis thaliana. Model parameters were estimated based on expression time-courses for relevant genes, and a consistent set of flowering times for plants of various genetic backgrounds. Validation was performed by predicting changes in expression level in mutant backgrounds and comparing these predictions with independent expression data, and by comparison of predicted and experimental flowering times for several double mutants. Remarkably, the model predicts that a disturbance in a particular gene has not necessarily the largest impact on directly connected genes. For example, the model predicts that SUPPRESSOR OF OVEREXPRESSION OF CONSTANS (SOC1) mutation has a larger impact on APETALA1 (AP1), which is not directly regulated by SOC1, compared to its effect on LEAFY (LFY) which is under direct control of SOC1. This was confirmed by expression data. Another model prediction involves the importance of cooperativity in the regulation of APETALA1 (AP1) by LFY, a prediction supported by experimental evidence. Concluding, our model for flowering time gene regulation enables to address how different quantitative inputs are combined into one quantitative output, flowering time.
Conflict of interest statement
Figures
Similar articles
-
Genome-wide identification of SOC1 and SVP targets during the floral transition in Arabidopsis.Plant J. 2012 May;70(4):549-61. doi: 10.1111/j.1365-313X.2012.04919.x. Epub 2012 Mar 5. Plant J. 2012. PMID: 22268548
-
Analysis of flowering pathway integrators in Arabidopsis.Plant Cell Physiol. 2005 Feb;46(2):292-9. doi: 10.1093/pcp/pci024. Epub 2005 Feb 2. Plant Cell Physiol. 2005. PMID: 15695467
-
The SOC1-SPL module integrates photoperiod and gibberellic acid signals to control flowering time in Arabidopsis.Plant J. 2012 Feb;69(4):577-88. doi: 10.1111/j.1365-313X.2011.04813.x. Epub 2011 Nov 16. Plant J. 2012. PMID: 21988498
-
[Regulation network and biological roles of LEAFY in Arabidopsis thaliana in floral development].Yi Chuan. 2004 Jan;26(1):137-42. Yi Chuan. 2004. PMID: 15626683 Review. Chinese.
-
Regulation and function of SOC1, a flowering pathway integrator.J Exp Bot. 2010 May;61(9):2247-54. doi: 10.1093/jxb/erq098. Epub 2010 Apr 22. J Exp Bot. 2010. PMID: 20413527 Review.
Cited by
-
A matter of time - How transient transcription factor interactions create dynamic gene regulatory networks.Biochim Biophys Acta Gene Regul Mech. 2017 Jan;1860(1):75-83. doi: 10.1016/j.bbagrm.2016.08.007. Epub 2016 Aug 18. Biochim Biophys Acta Gene Regul Mech. 2017. PMID: 27546191 Free PMC article. Review.
-
WRKY23 is a component of the transcriptional network mediating auxin feedback on PIN polarity.PLoS Genet. 2018 Jan 29;14(1):e1007177. doi: 10.1371/journal.pgen.1007177. eCollection 2018 Jan. PLoS Genet. 2018. PMID: 29377885 Free PMC article.
-
The logic of the floral transition: Reverse-engineering the switch controlling the identity of lateral organs.PLoS Comput Biol. 2017 Sep 20;13(9):e1005744. doi: 10.1371/journal.pcbi.1005744. eCollection 2017 Sep. PLoS Comput Biol. 2017. PMID: 28931004 Free PMC article.
-
Effect of epistasis and environment on flowering time in barley reveals a novel flowering-delaying QTL allele.J Exp Bot. 2020 Jan 23;71(3):893-906. doi: 10.1093/jxb/erz477. J Exp Bot. 2020. PMID: 31781747 Free PMC article.
-
Dynamical Modeling of the Core Gene Network Controlling Flowering Suggests Cumulative Activation From the FLOWERING LOCUS T Gene Homologs in Chickpea.Front Genet. 2018 Nov 20;9:547. doi: 10.3389/fgene.2018.00547. eCollection 2018. Front Genet. 2018. PMID: 30524469 Free PMC article.
References
Publication types
MeSH terms
Substances
Grants and funding
LinkOut - more resources
Full Text Sources
Other Literature Sources
Molecular Biology Databases
Research Materials
